Looking for more up-to-date data? Try Similarweb now.
The pre-Christmas shopping holidays create a lot of hype and excitement for shoppers every year, and 2019 was no different. We have explored the digital data behind the 2019 holiday shopping season to provide investors with insight into the performance of online retailers in the U.S. over the period.
- Traffic to online retailers in the U.S. decreased year-over-year (YoY) over the shopping holidays
- The number of downloads of the top U.S. shopping Android apps experienced significant YoY growth over the shopping holidays
- Retailers in the U.S. are investing more each year in paid advertising to attract shoppers to their sites over the shopping holidays
Methodology
All data for this report is based on activity in the U.S. unless otherwise stated. All app data is based on Android app data unless otherwise stated. The analysis covers the period from Nov. 1, 2016 – Dec. 2, 2019.
Introduction
Thanksgiving and the associated shopping holidays are an exciting time of year for shoppers looking to bag some bargains ahead of the festive season. This white paper explores digital insights into the YoY growth of traffic to top shopping sites in the US over the shopping holidays, in addition to app usage, market share, and more.
Key takeaways
- Sites: The 2019 holiday shopping season saw a YoY decrease in engaged visits to shopping sites in the U.S.
- Apps: Android app downloads of top US retailers experienced significant YoY growth over the shopping holidays in 2019
- Traffic Channels: Retailers are investing more in paid advertising each year to increase their chances of a successful holiday shopping season

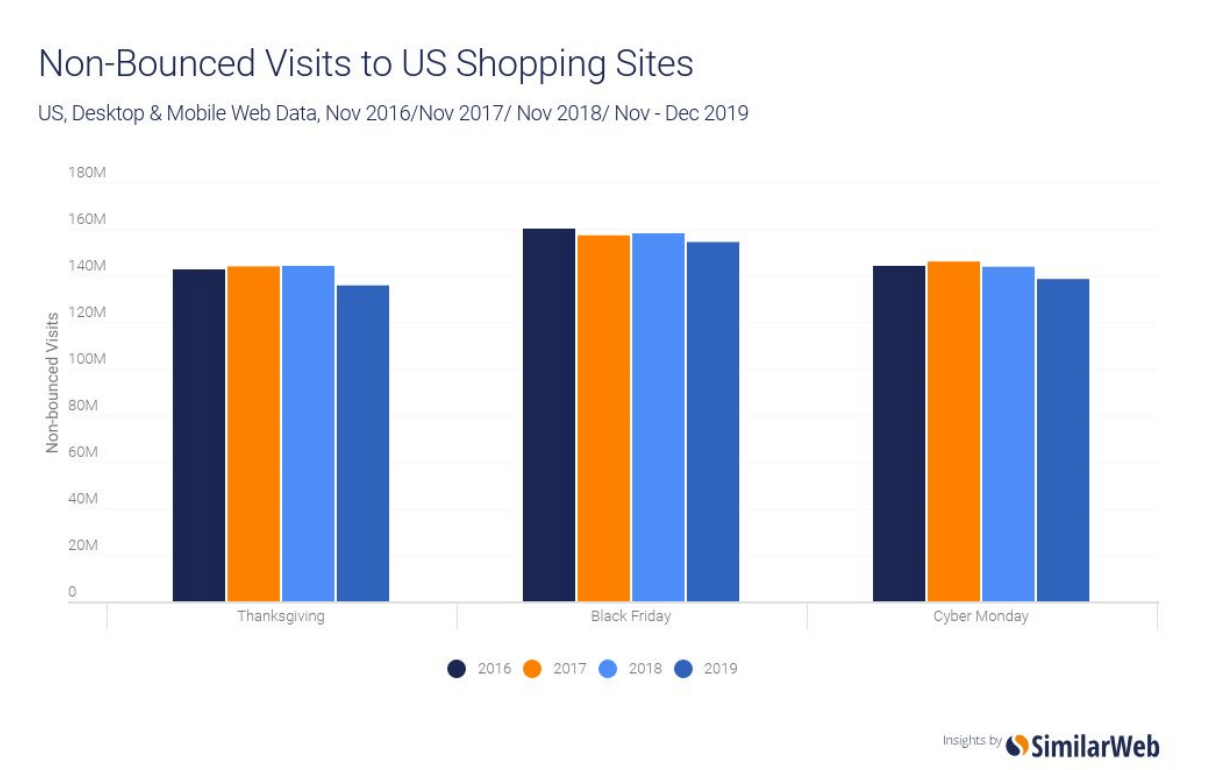
Non-bounced visits to top U.S. shopping sites
Engaged visits (visits that go past the landing page) on Thanksgiving, Black Friday, and Cyber Monday are experiencing a downward trend.
In 2019 non-bounced visits to top US shopping sites declined by 5.75% YoY on Thanksgiving, 2.37% YoY on Black Friday, and 3.69% YoY on Cyber Monday.
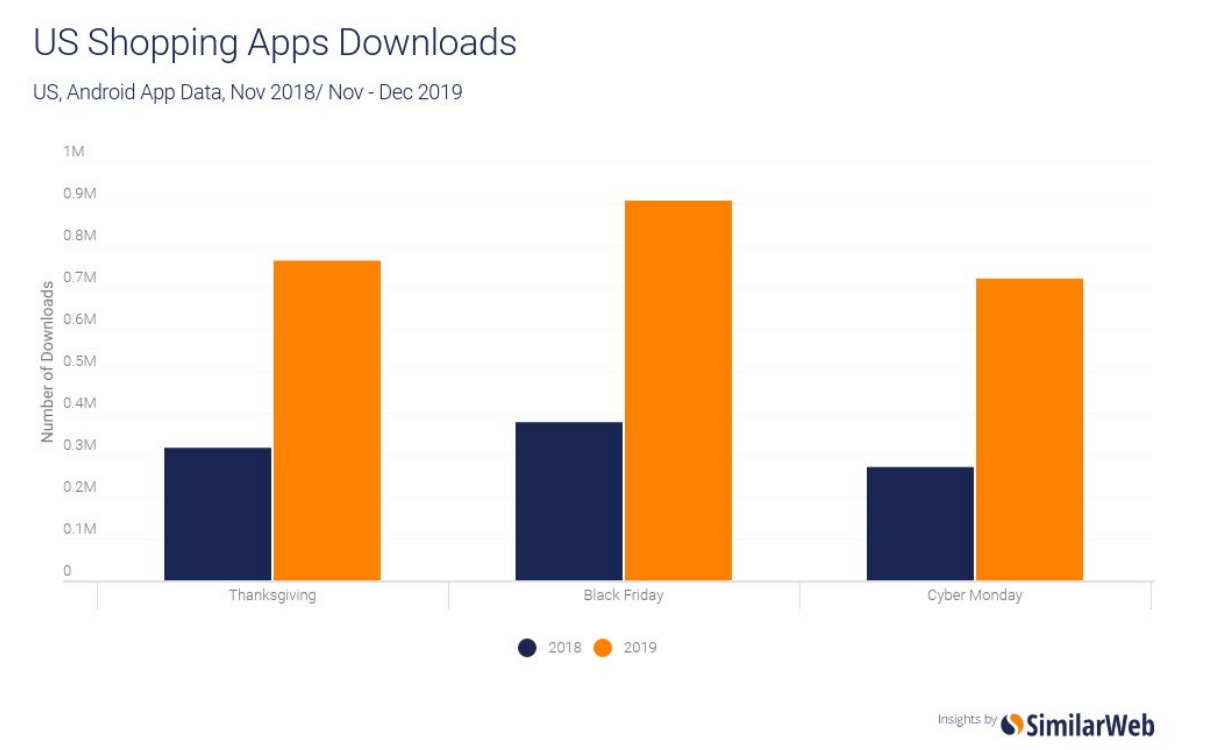
Top U.S. shopping apps downloads
Despite the decrease in engaged site visits in 2019, the top shopping apps in the US experienced YoY growth in the number of downloads over the shopping holidays.
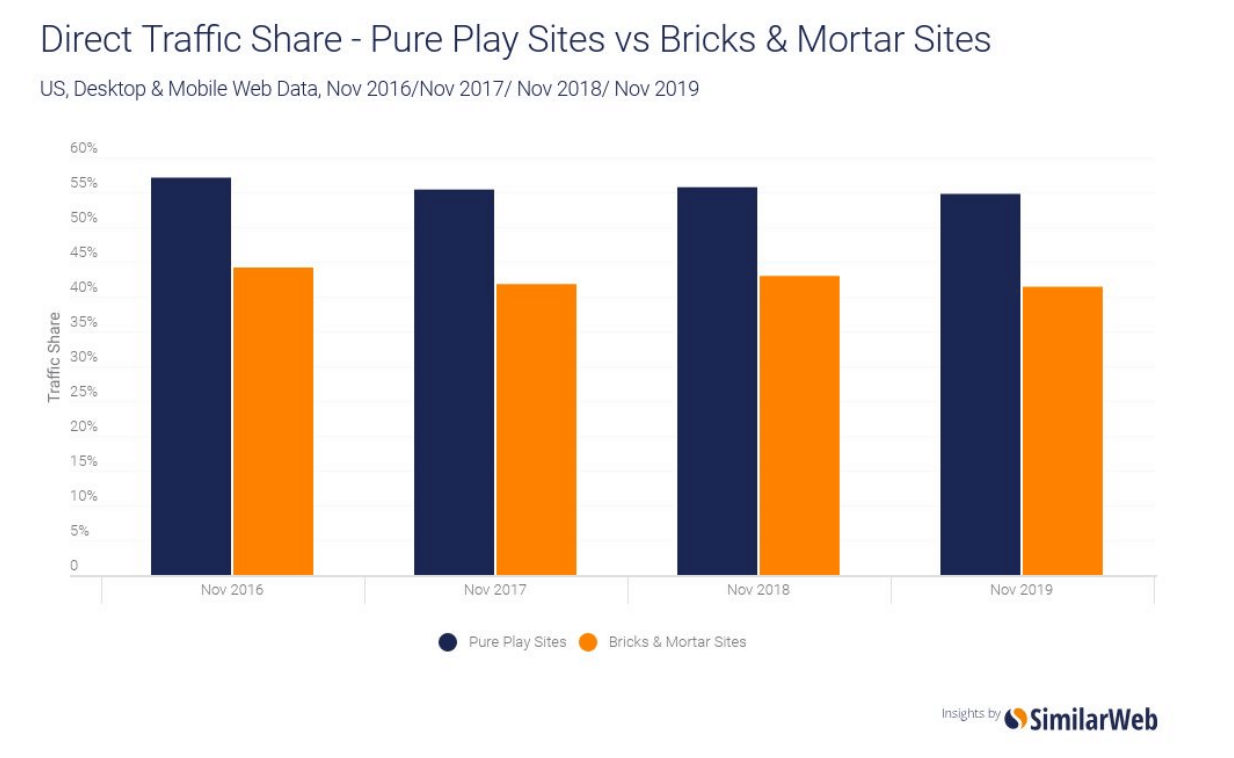
Direct traffic
Both pure-play sites and bricks-and-mortar sites have been experiencing negative YoY growth in the amount of traffic arriving directly during the holiday shopping season.
In 2019 pure-play sites in the U.S. experienced a 6.6% YoY decrease in direct traffic and bricks and mortar sites experienced a 14.9% YoY decrease.
Paid search
On the contrary, the share of traffic from paid searches to both the top pure play and bricks and mortar sites in the U.S. is experiencing an upward trend.
Bricks and mortar sites are more reliant on traffic from paid search than pure-play sites.
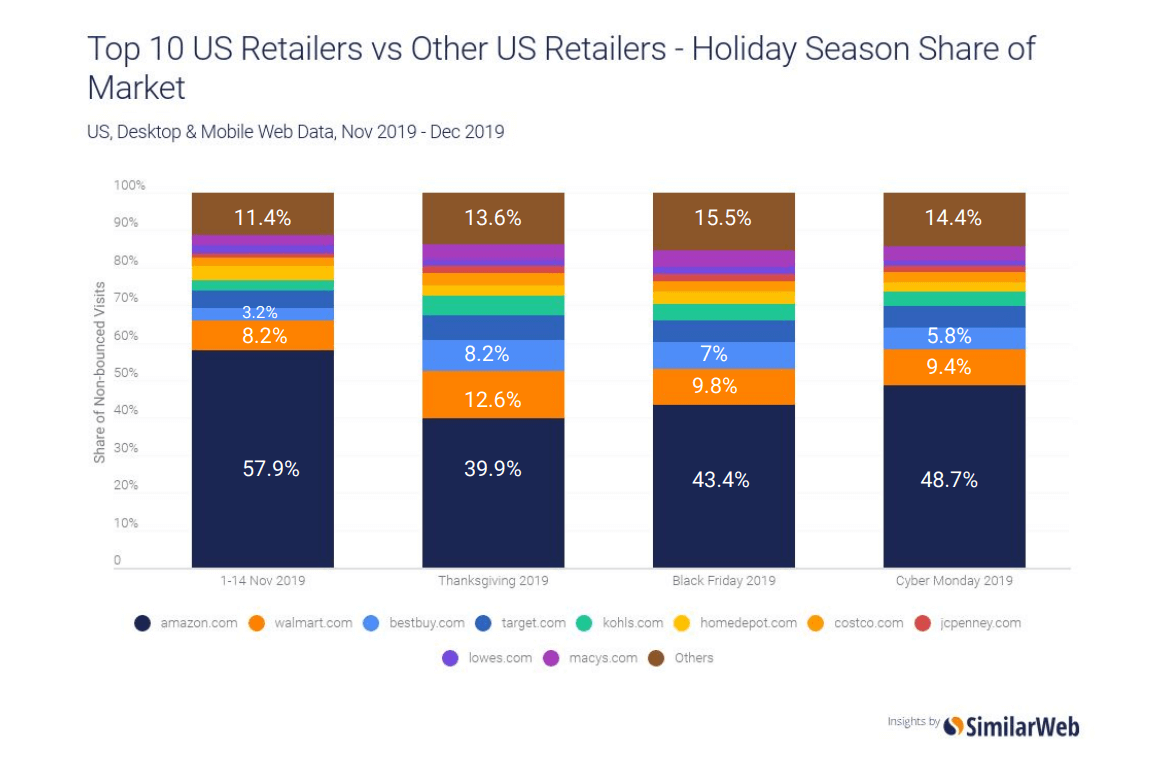
 2019 holiday season market share
Amazon.com dominates the U.S. market however it loses share to other retailers over the shopping holidays – with Thanksgiving being its weakest day.
Bestbuy.com increased its online share by 5 percentage points between 1-14 November and Thanksgiving.
The top 10 U.S. online retailers accounted for over 84% of the online retail market during the 2019 shopping holidays.
 Conversion rates during shopping holidays
 Conversion rates during shopping holidays
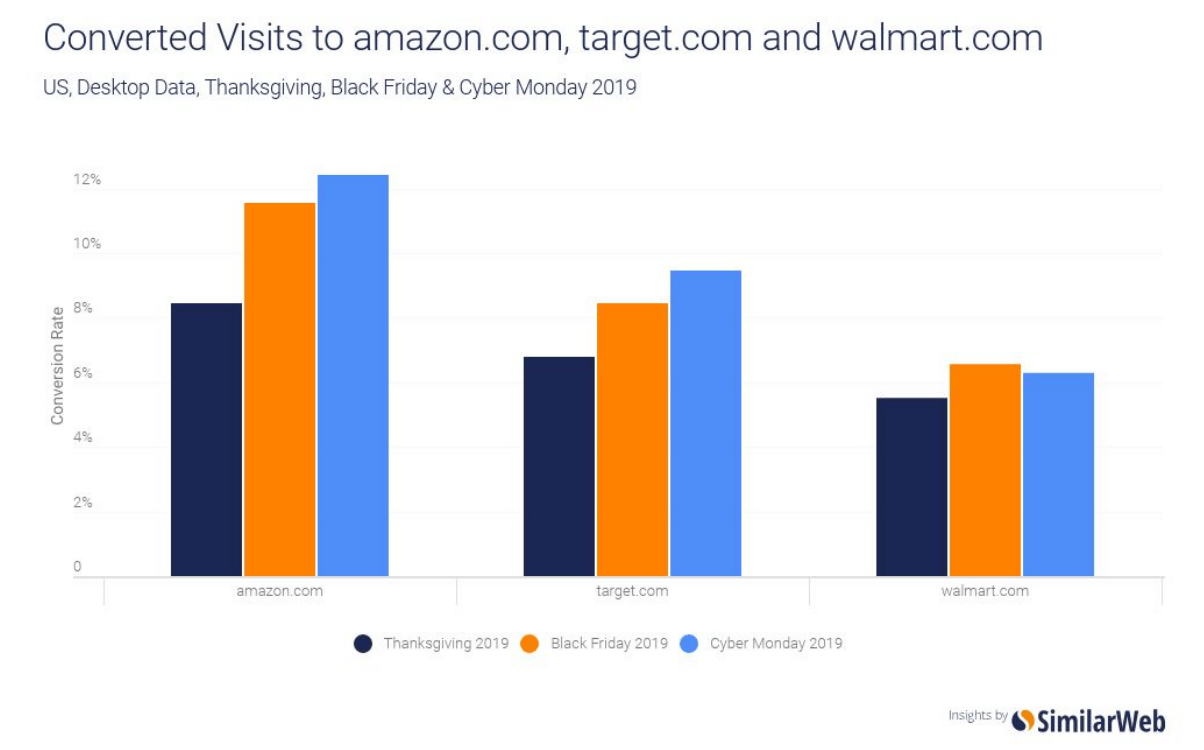
Conversion rates (the percentage of visits that ended in a sale) for amazon.com and target.com peaked on Cyber Monday at 12.4% and 9.5% respectively.
Of the three, walmart.com was the only site to experience a decrease in conversion rate on Cyber Monday.
The conversion rate for walmart.com peaked on Black Friday at 6.6% Amazon.com experienced the highest conversion rate on all three days, followed by target.com and then walmart.com.
2019 vs. 2018: market share YoY growth
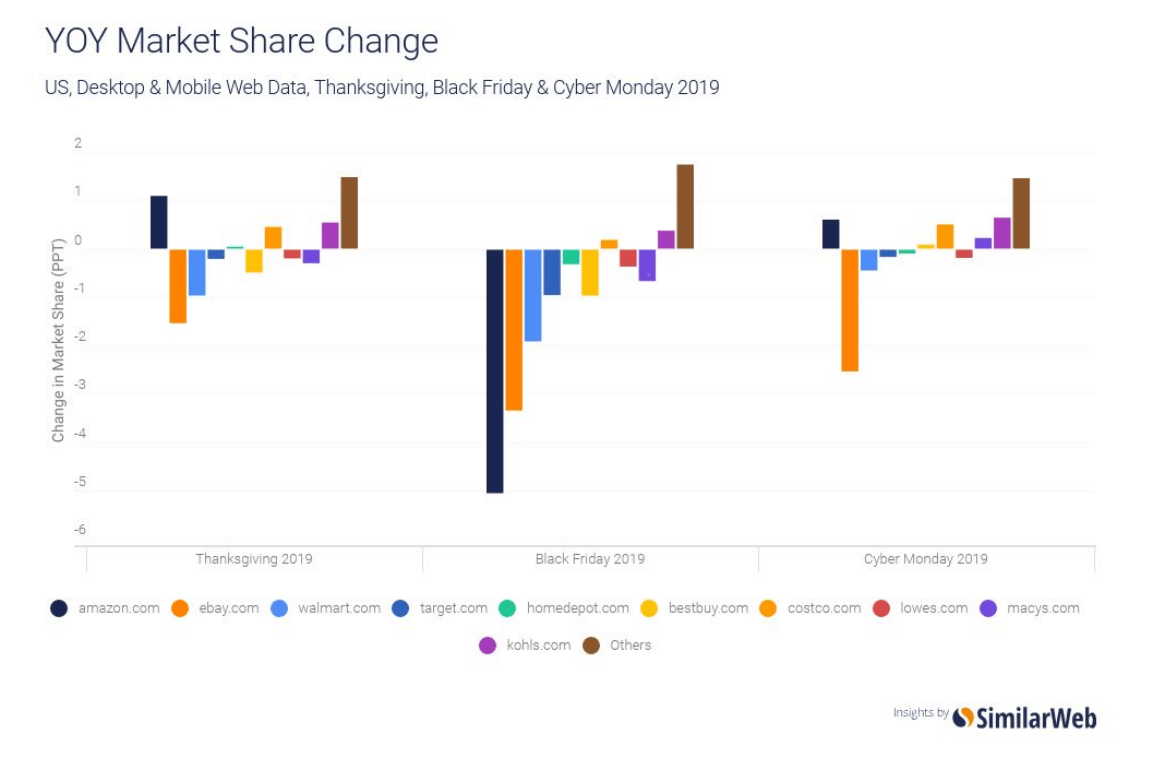
Costco.com and kohls.com were the only two top U.S. retailers to grow in market share on all three days.
The U.S. retailers outside of the top 10 experienced YoY growth on all three of the shopping holidays.
 2019 Winners and Losers
 2019 Winners and Losers
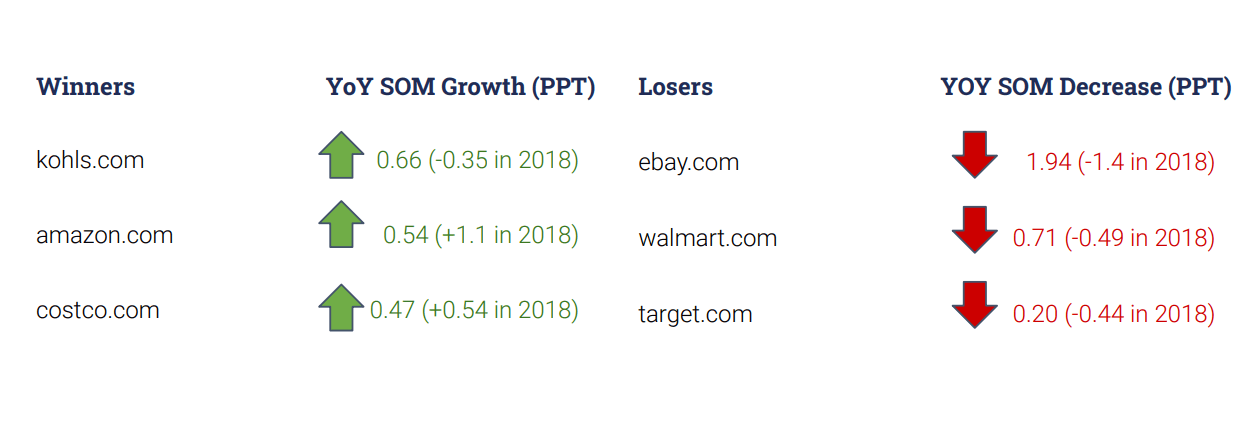
In 2019 kohls.com was the biggest holiday season winner – increasing its online market share by 0.66 percentage points over Thanksgiving, Black Friday, and Cyber Monday.
Ebay.com was the biggest loser – experiencing a 1.94 percentage point decrease in online market share.
Battle of the brands
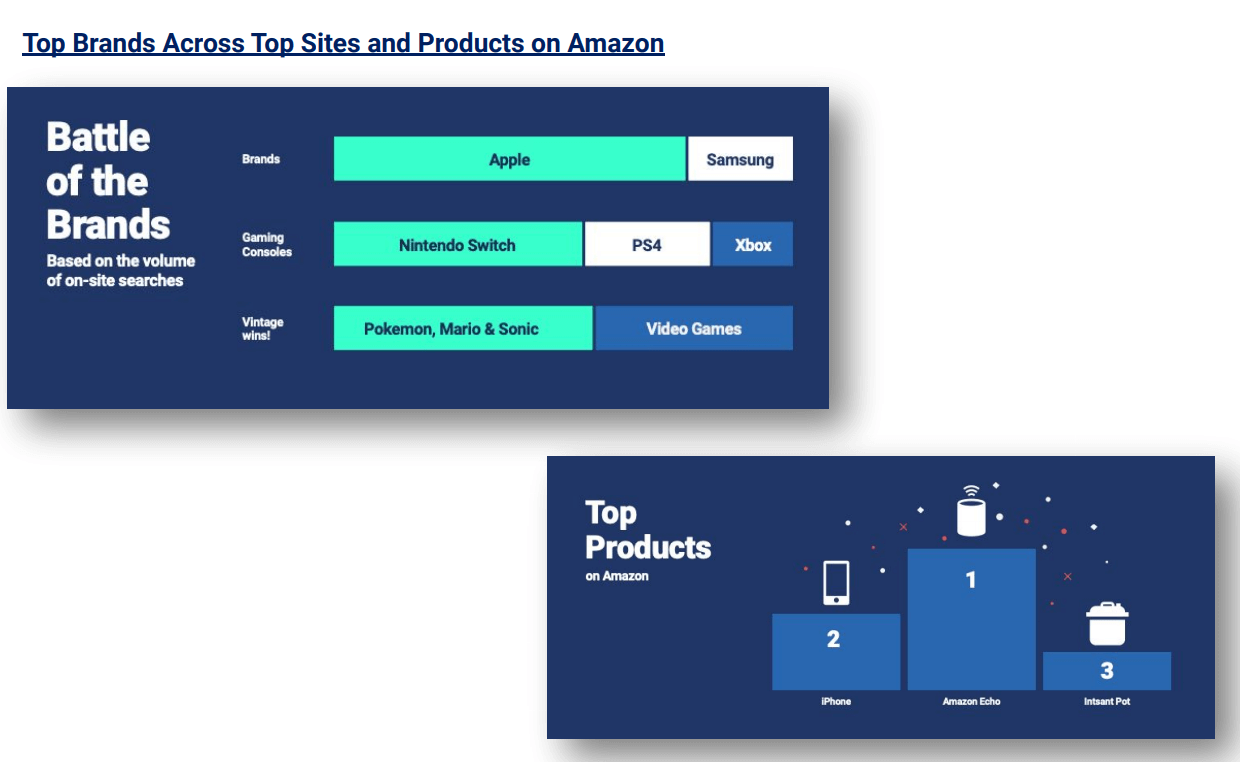
Apple was the most searched-for brand on top retailer sites over the 2019 holiday shopping season, followed by Samsung.
On Amazon, the Echo was the most searched for product.
 Conclusion
 Conclusion
Shoppers’ preferences are shifting from online to an app, and online retailers are spending more and more on paid advertising to drive sales over the shopping holidays.
Although amazon.com dominates the online retail space in the U.S., it lost online share to other retailers between the first two weeks of November and the shopping holidays. Whilst at the same time bestbuy.com increased its market share by 5 percentage points between the first two weeks of November and Thanksgiving.
That said amazon.com still received the highest conversion rate on Thanksgiving, Black Friday, and Cyber Monday. However whilst both amazon.com and target.com reached their peak conversion rates on Cyber Monday, walmart.com reached its peak on Black Friday and experienced a decrease in conversion rate on Cyber Monday.
In terms of the most searched for products Apple was the most searched for brand over the 2019 shopping holiday season, and the Nintendo Switch was the most searched for gaming console.
Contact one of our investment specialists
Find out how you can make better investment decisions with Similarweb’s alternative data. Schedule a live demo now.
