





Global gambling market overview highlights strong growth worldwide and in Latin America
by David F. Carr3 Min.
Nov 07, 2024
 Insights
With the NCAA “March Madness” tournament already underway, we found traffic to leading sports betting sites in the U.S. is sharply higher than at this time last year.
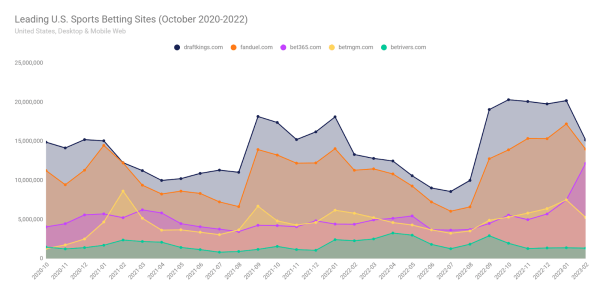
The long-term trend chart for the five leading sports betting sites shows strong growth for most participants. After rising 19% in January year-over-year, aggregated web traffic to these five sports betting sites rose by 29% in February. For the first two months of the year, web traffic was up 24%.
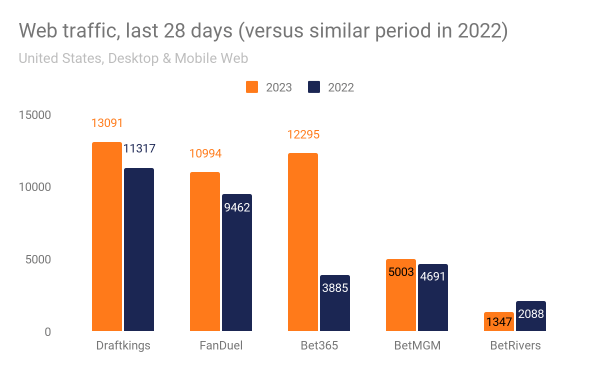
The past 28 days have also been strong, with aggregated traffic for that time period up by 34% over a similar period a year earlier. Of the five companies in this report, only BetRivers saw its traffic decline over the past 28 days.
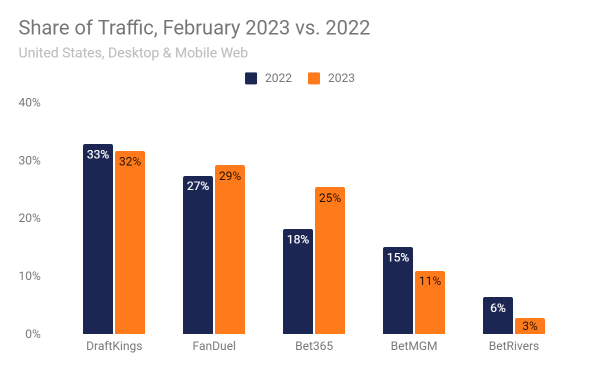
A look at the share of traffic (a proxy for market share) for these five companies shows that DraftKings remains in the lead with a 32% share of traffic in February 2023, with FanDuel second at 27% and Bet365 third at 25%. However, due to its rapid web traffic growth, Bet365 has gained seven percentage points of traffic in the past year, while both DraftKings and FanDuel, even as they saw strong web traffic growth, saw their relative shares decline.
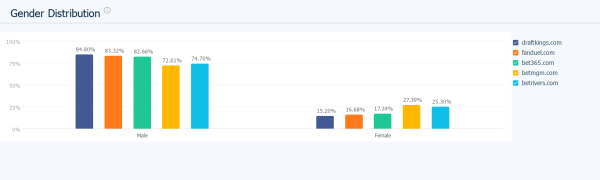
The demographics of sports betting skew overwhelmingly toward males and also skew younger. Of the five companies in this report, all of them saw males representing over 72% of total web traffic, and the leader, DraftKings, received 85% of its web traffic from men.
In terms of ages, you can see that for each of them, the largest age cohorts were ages 25-34 followed by ages 35-44 and ages 18-24. It seems older people are less interested in sports betting, with the cohort of ages 65+ less than 7% of traffic for each company.
<img loading="lazy" decoding="async" class="alignnone wp-image-144860 size-full" src="https://corporate.similarweb.io/wp-content/uploads/sites/2/2023/03/march_madness__5-600x180-1.png" alt="Age distribution of the leading U.S. sports betting websites" width="600" height="180" srcset="https://corporate.similarweb.io/blog/wp-content/uploads/sites/2/2023/03/march_madness__5-600x180-1.png 600w, https://corporate.similarweb.io/blog/wp-content/uploads/sites/2/2023/03/march_madness__5-600x180-1-300x90.png 300w, https://corporate.similarweb.io/blog/wp-content/uploads/sites/2/2023/03/march_madness__5-600x180-1-512x154.png 512w" sizes="auto, (max-width: 600px) 100vw, 600px" data-source-url="https://corporate.similarweb.io/wp-content/uploads/sites/2/2023/03/march_madness__5-600x180-1.png" data-cdn-url="https://static-us-east-1.similarcdn.com/corporate/uploads/sites/2/2023/03/march_madness__5-600x180-1.png" />
The Similarweb Insights & Communications team is available to pull additional or updated data on request for the news media (journalists are invited to write to press@similarweb.com). When citing our data, please reference Similarweb as the source and link back to the most relevant blog post or similarweb.com/blog/insights/.
Disclaimer: All names, brands, trademarks, and registered trademarks are the property of their respective owners. The data, reports, and other materials provided or made available by Similarweb consist of or include estimated metrics and digital insights generated by Similarweb using its proprietary algorithms, based on information collected by Similarweb from multiple sources using its advanced data methodologies. Similarweb shall not be responsible for the accuracy of such data, reports, and materials and shall have no liability for any decision by any third party based in whole or in part on such data, reports, and materials.

Senior Analyst
Jim provides insights across multiple sectors. With 30 years on Wall Street and numerous awards for stock-picking, he is a SUNY Albany graduate.
Global gambling market overview highlights strong growth worldwide and in Latin America

Polymarket Traffic Surges as US Election Approaches

Ahead of NCAA March Madness, Bracket Builders See 400% Traffic Spike
Give it a try or talk to our insights team — don’t worry, it’s free!