





Zillow Continued to Lead the Web with 318 Million Monthly Visits, While Homes.com Grew over 200%
by RJ Jones4 Min.
Jun 22, 2023
 Insights
Similarweb’s latest look at the real estate industry’s leading search sites for buying and selling homes in the U.S. shows an overall 1% year-over-year decrease in visits in the second quarter. Seasonally, the category traffic increased by 12% over the previous quarter.
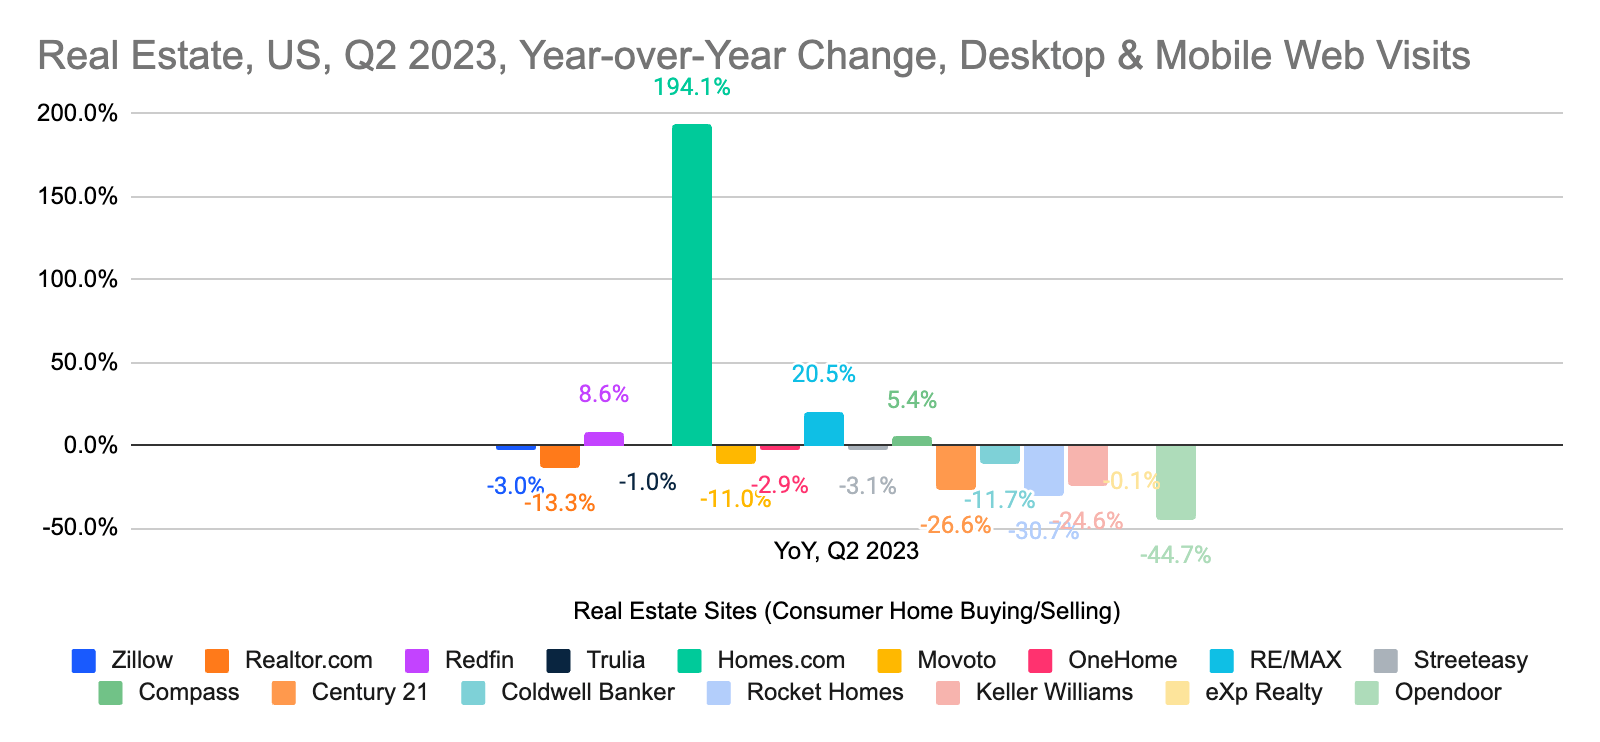
In the second quarter of 2023, Homes.com saw the most growth in web traffic on a year-over-year basis at 194%, while RE/MAX grew nearly 21% and Redfin grew almost 9%. Opendoor saw a 45% year-over-year web traffic decline, and Rocket Homes saw a 31% drop in traffic.
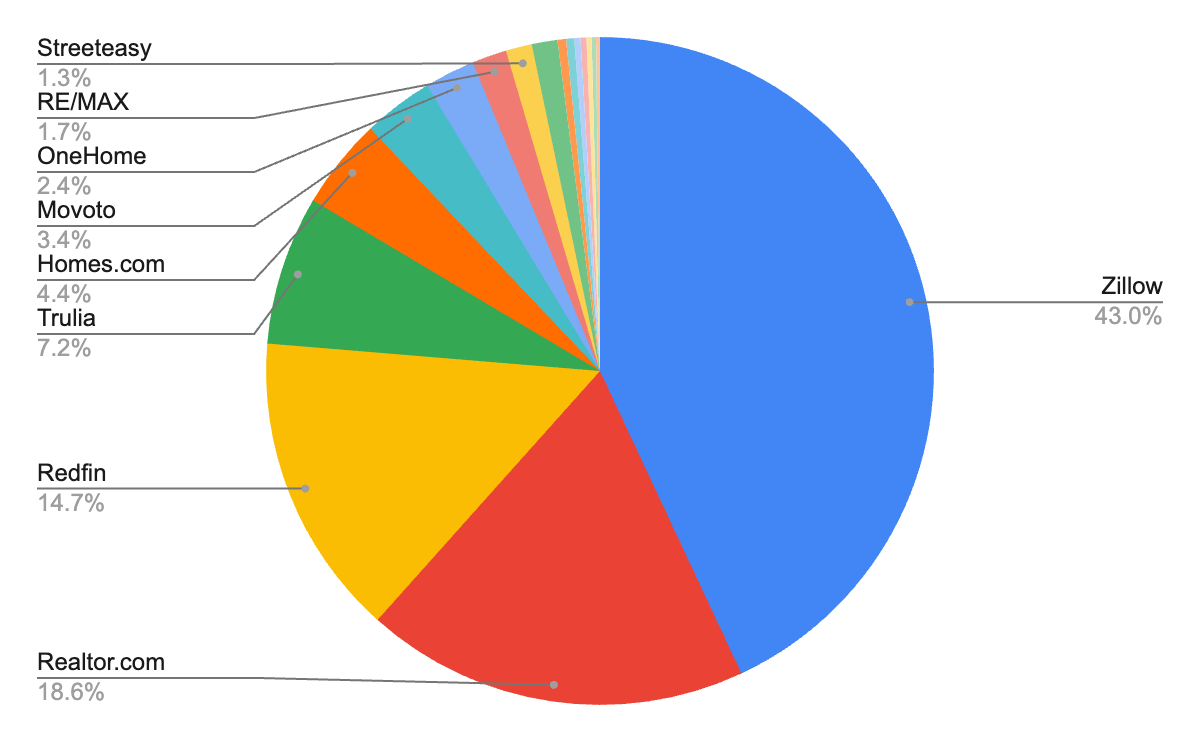
Zillow led in share of traffic among real estate peers for the second quarter (based on a look at seventeen leading peers) with a 43% share estimate. Zillow is scheduled to report second-quarter earnings on August 2. Redfin showed a notable share gain this month of 0.6 percentage point, and is scheduled to report earnings on August 3.
We watch traffic to these home search sites as a proxy for potential demand, as most consumers visit these websites before making in-person visits and purchases. The chart below shows the change in web traffic on a year-over-year basis. Homes.com saw tremendous growth, while Opendoor performed the worst. Homes.com appears to be benefiting from its increased advertising spend. Opendoor’s instant home buying value proposition looks to have fallen out of favor with consumers, while interest rates continue to negatively impact traffic to Rocket Homes, which relies heavily on mortgage-related inquiries.
The below chart shows the relative market share of each company in the peer group relative to each other (share of traffic). Zillow leads with 43%, followed by Realtor.com at 19%, Redfin at 15% and Trulia at 7%. Traffic to Compass, Keller Williams, and eXp Realty barely registers amongst peers, while they are industry leaders in transaction units and volume.
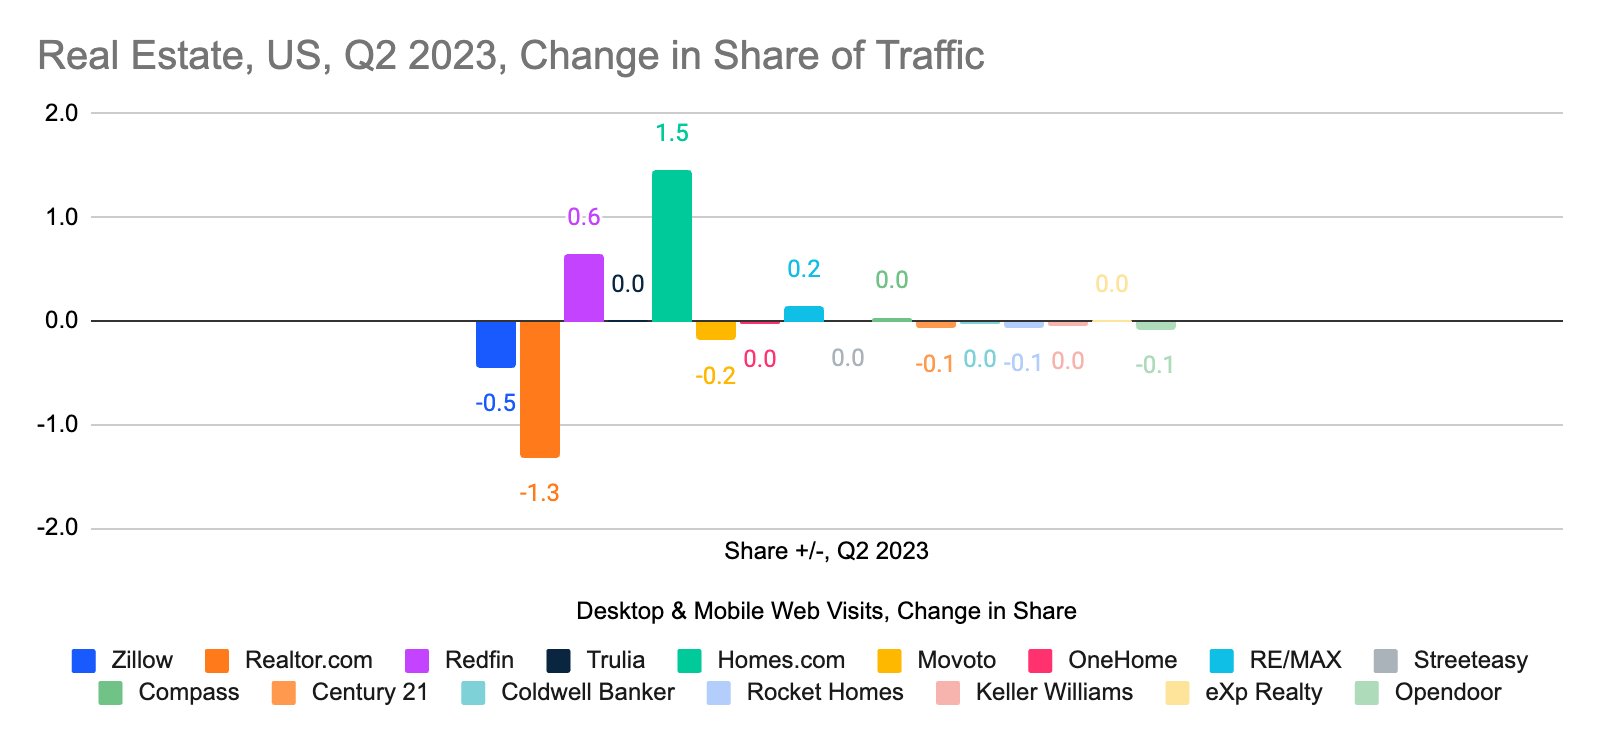
Shifts in share of traffic year-over-year show that Realtor.com (-1.3 percentage points) and Zillow (-0.5 percentage point) performed worst in the second quarter, while Homes.com (+1.5 percentage points) and Redfin (+0.6 percentage points) did the best.
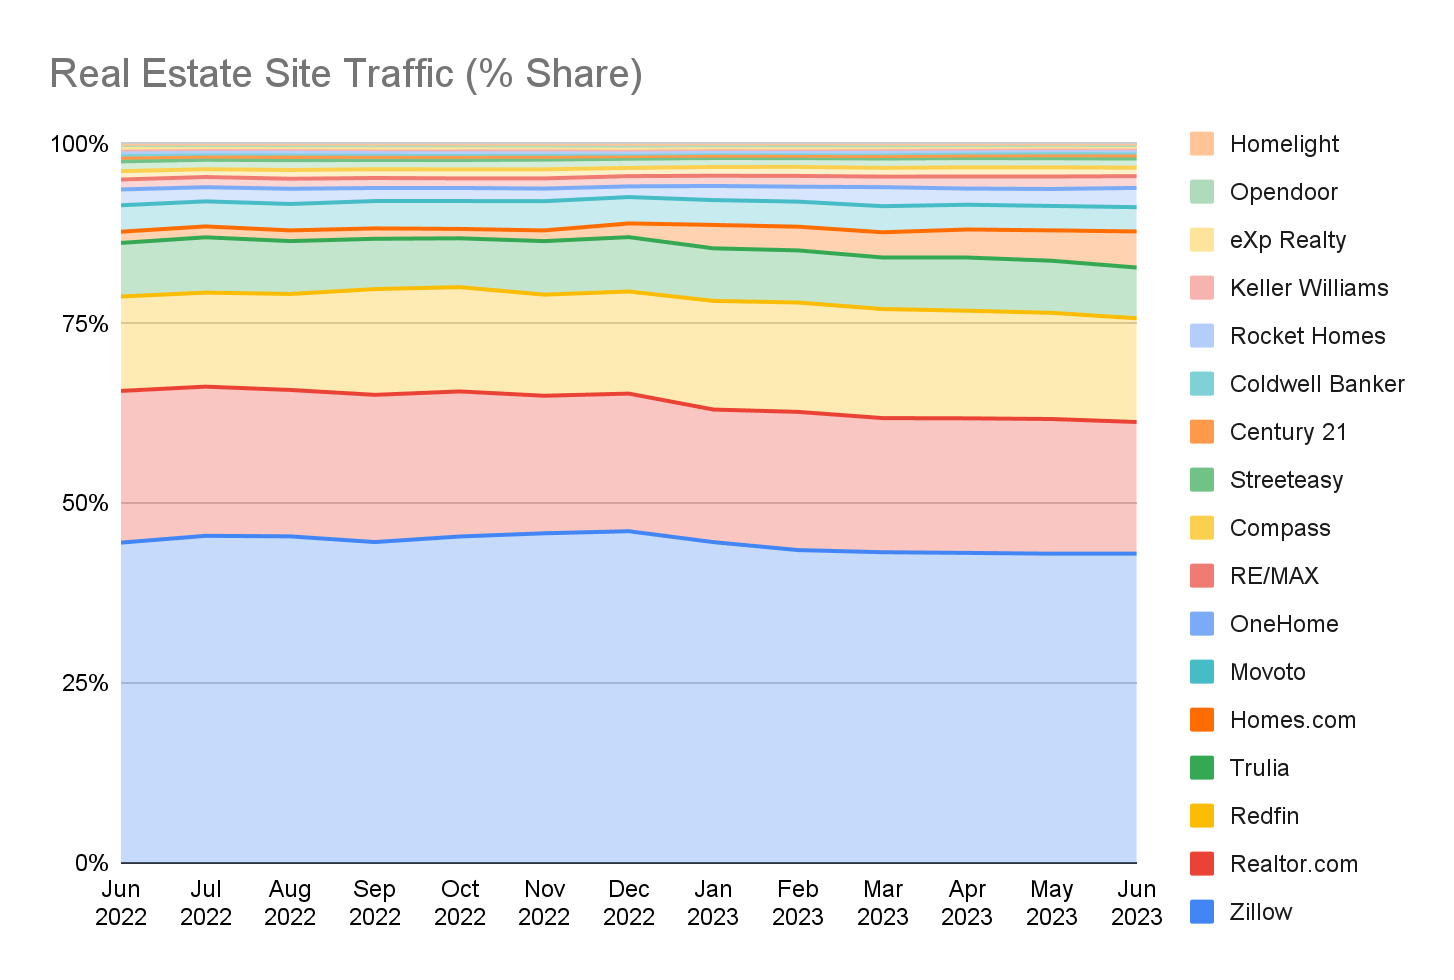
Zillow has shown a consistent lead over the past year, while Homes.com continued its momentum in gains. Realtor.com has been fading over the past twelve months.
The list of the real estate sites in this report and their traffic rankings is below.
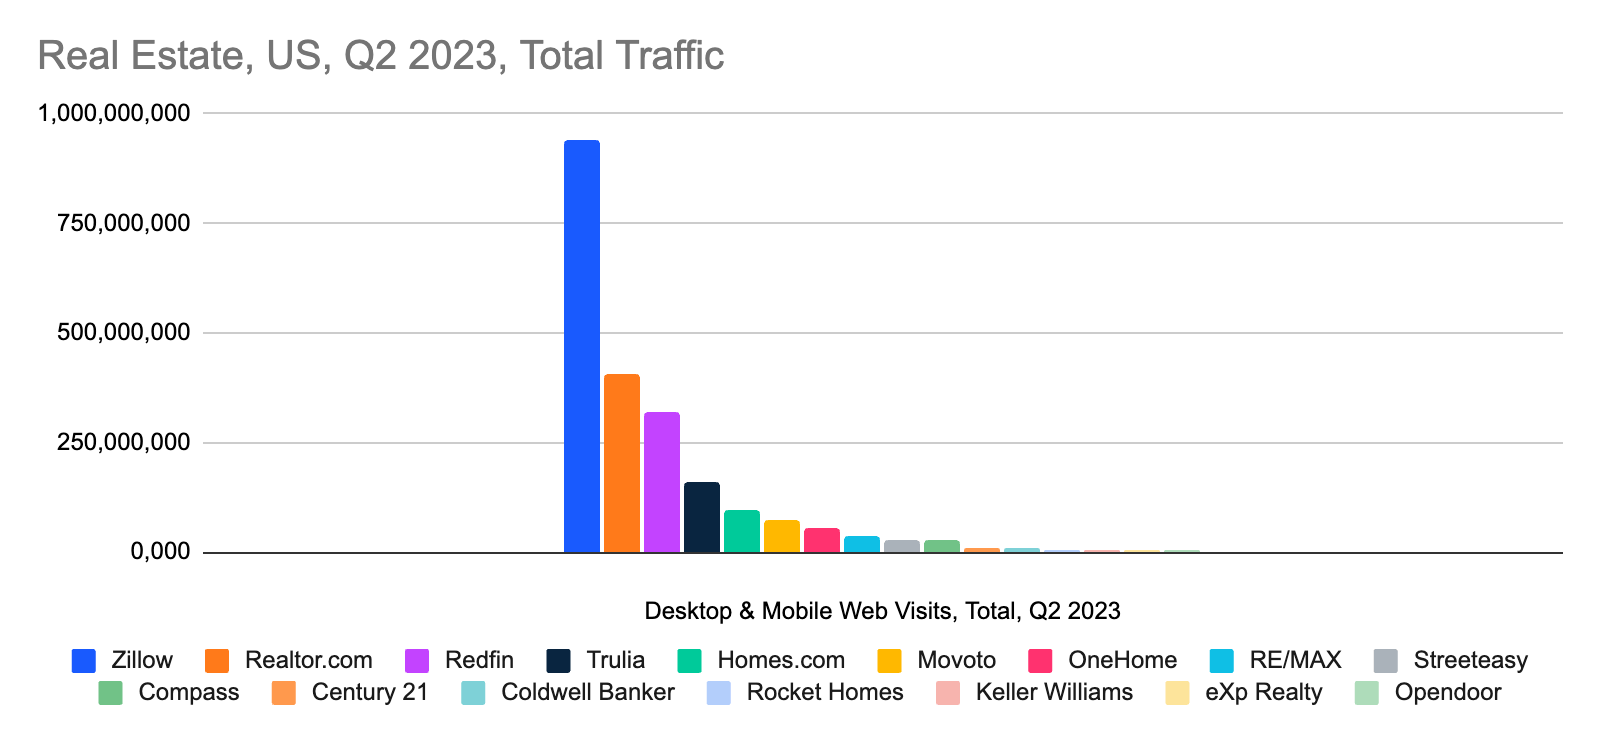
| Brand or Co | Domain | Q2 2023 Visits | Visits YoY | June 2023 Share | Share YoY pp |
| Zillow | zillow.com | 940,737,415 | -3.0% | 43.0% | -0.5 |
| Realtor.com | realtor.com | 406,009,603 | -13.3% | 18.6% | -1.3 |
| Redfin | redfin.com | 321,434,402 | 8.6% | 14.7% | 0.6 |
| Trulia | trulia.com | 157,967,414 | -1.0% | 7.2% | 0.0 |
| Homes.com | homes.com | 96,067,273 | 194.1% | 4.4% | 1.5 |
| Movoto | movoto.com | 74,387,284 | -11.0% | 3.4% | -0.2 |
| OneHome | onehome.com | 53,205,515 | -2.9% | 2.4% | 0.0 |
| RE/MAX | remax.com | 36,761,499 | 20.5% | 1.7% | 0.2 |
| Streeteasy | streeteasy.com | 27,716,063 | -3.1% | 1.3% | 0.0 |
| Compass | compass.com | 27,169,088 | 5.4% | 1.2% | 0.0 |
| Century 21 | century21.com | 9,025,144 | -26.6% | 0.4% | -0.1 |
| Coldwell Banker | coldwellbanker.com | 8,595,511 | -11.7% | 0.4% | 0.0 |
| Rocket Homes | rockethomes.com | 6,502,478 | -30.7% | 0.3% | -0.1 |
| Keller Williams | kw.com | 6,232,552 | -24.6% | 0.3% | 0.0 |
| eXp Realty | exprealty.com | 5,388,420 | -0.1% | 0.2% | 0.0 |
| Opendoor | opendoor.com | 4,665,095 | -44.7% | 0.2% | -0.1 |
| Homelight | homelight.com | 4,133,724 | -5.9% | 0.2% | 0.0 |
Publicly traded companies that own the websites mentioned in this report include Zillow Group (NASDAQ: Z, ZG), Redfin (NYSE: RDFN), News Corp (NASDAQ: NWS, NWSA), CoStar Group (NASDAQ: CSTR), Rocket Companies (NASDAQ: RKT), eXp World Holdings (NYSE: EXPI), Opendoor (NASDAQ: OPEN), Anywhere Real Estate (NASDAQ: HOUS), RE/MAX Holdings (NASDAQ: RMAX), Compass (NYSE: COMP).
The Similarweb Insights & Communications team is available to pull additional or updated data on request for the news media (journalists are invited to write to press@similarweb.com). When citing our data, please reference Similarweb as the source and link back to the most relevant blog post or similarweb.com/blog/insights/.
Contact: For more information, please write to press@similarweb.com.
Citation: Please refer to Similarweb as a digital intelligence platform. If online, please link back to www.similarweb.com or the most relevant blog post.
Disclaimer: All names, brands, trademarks, and registered trademarks are the property of their respective owners. The data, reports, and other materials provided or made available by Similarweb consist of or include estimated metrics and digital insights generated by Similarweb using its proprietary algorithms, based on information collected by Similarweb from multiple sources using its advanced data methodologies. Similarweb shall not be responsible for the accuracy of such data, reports, and materials and shall have no liability for any decision by any third party based in whole or in part on such data, reports, and materials.

by RJ Jones
Vice President of Investor Relations, Communications, Insights, and Sustainability
Vice President of Investor Relations, Communications, Insights, and Sustainability
Give it a try or talk to our insights team — don’t worry, it’s free!