


The Growth Leader’s GEO Decision Framework [+Free Template]
![The Growth Leader's GEO Decision Framework [+Free Template]](https://www.similarweb.com/blog/wp-content/uploads/2026/02/attachment-growth-leader-geo-decision-framework-768x429.png)
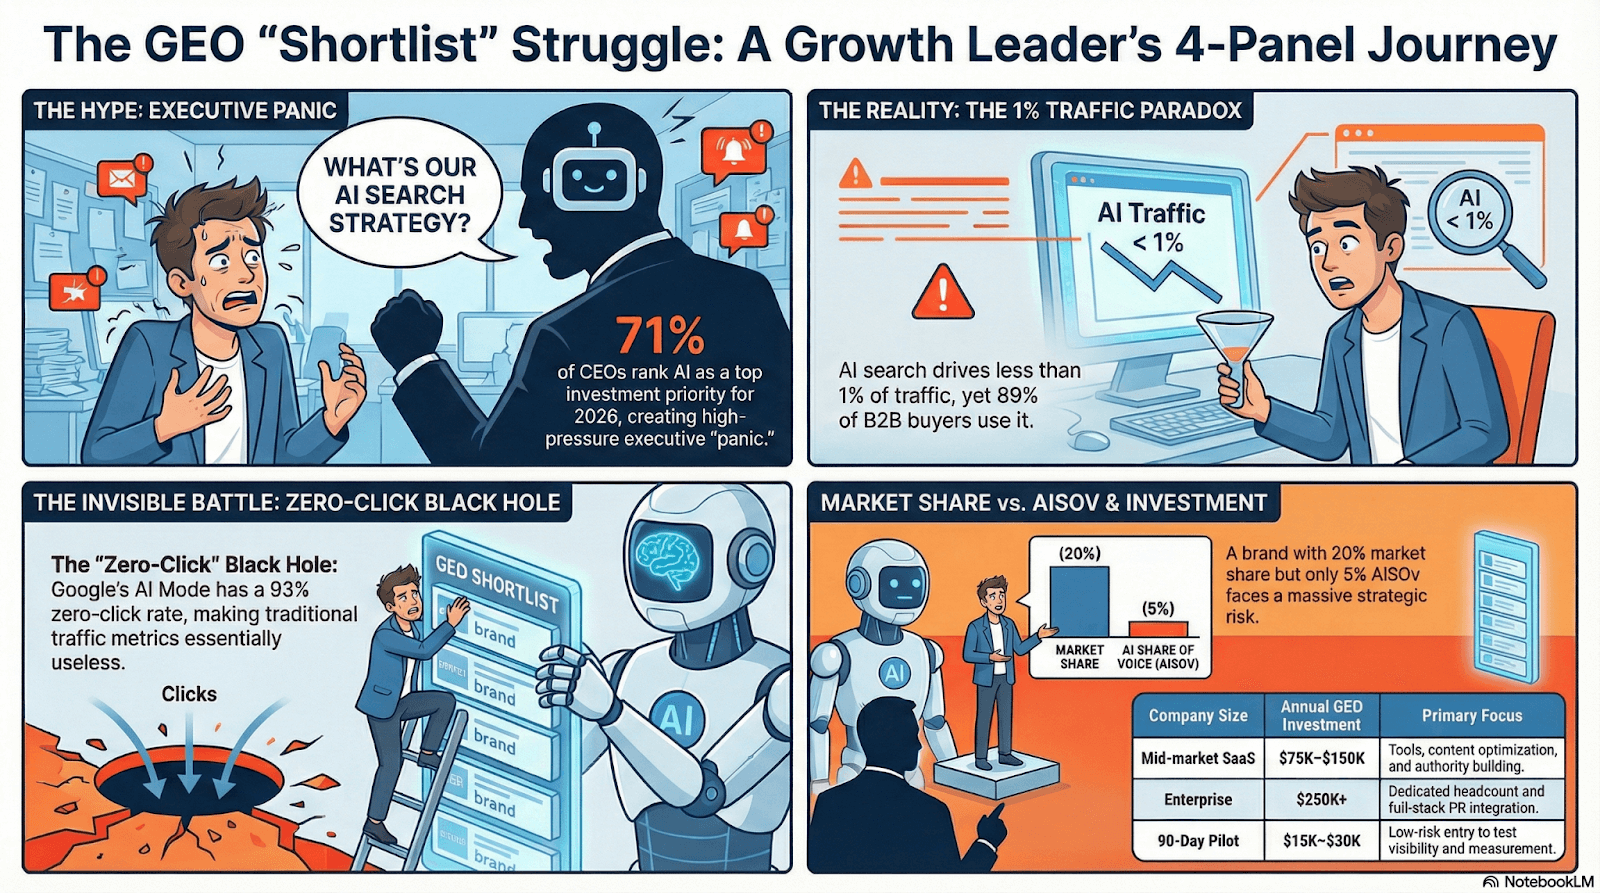
Every growth leader I know is getting the same question from their CEO: “What’s our AI search strategy?”
It makes sense. 71% of CEOs name AI a top investment priority for 2026 (KPMG Global CEO Outlook). ChatGPT hit 800 million weekly active users. Your board saw a competitor show up in a ChatGPT recommendation and now they want answers.
The problem is simple. The industry has hundreds of tactical GEO guides. How to optimize for AI Overviews. How to get cited by ChatGPT. How to structure content for LLMs. But nobody is answering the question that matters to you: should you invest, how much, where first, and how do you prove it’s working?
This post is not a GEO how-to guide (if that’s what you’re looking for, go to our GEO guide). This post outlines a practical framework I use to evaluate AI search visibility as a growth investment. The same one I’d want if I were making this decision at any company.
What’s Actually Happening in AI Search (Without the Hype)
Here’s what the data says:
The scale is real. ChatGPT has 800 million weekly active users. Google’s AI Overviews reach 2 billion monthly users and appear on roughly 18% of global search queries. At Similarweb, our Gen-AI Landscape data shows that generative AI platforms attract an average of 7 billion monthly visits, with 76% year-over-year growth. These are measured numbers, not projections.
But here’s the part most people ignore. AI-referred traffic still represents less than 1% of total website sessions. One in 769 visits, on average. AI search is not replacing Google. Not yet.
What it is doing is more important. AI search adds a new research layer to your buyer’s evaluation process. When a B2B buyer asks ChatGPT, “What are the best business productivity tools in the market?”, they’re not replacing a Google search. They’re skipping the part where they open six tabs and compare features. The AI delivers a shortlist instead.
If you’re not on that shortlist, you’re out of the consideration set. You’ll never see that loss in your analytics.
That’s the real risk. Not traffic decline. Invisible brand erosion. Forrester reports that 89% of B2B buyers now use generative AI during their buying process. The zero-click rate in Google’s AI Mode is 93%. With standard AI Overviews, 43% of queries end without a click, compared to 34% without them.
As Nataly Kelly, CMO at Zappi, put it in a recent Marketing Brew interview: “Your AI brand presence is becoming just as important as your first-party one.”
How This Changes Your Funnel
Think about it in concrete terms. Your buyer opens ChatGPT and types “best tools for email prospecting.” The AI responds with three recommendations. Your main competitor is first. You’re not mentioned.
That buyer never visits your website. Never sees your ads. Never talks to your sales team. They shortlisted your competitor before they ever entered your funnel.
This happens thousands of times a month in every B2B category. And your marketing dashboard shows nothing.
The GEO Readiness Assessment: Score Your Position Before You Spend
Before you allocate a dollar, you need to know where you stand. I use a four-factor readiness model to determine whether a company should invest aggressively, run a pilot, or focus on building foundations first.
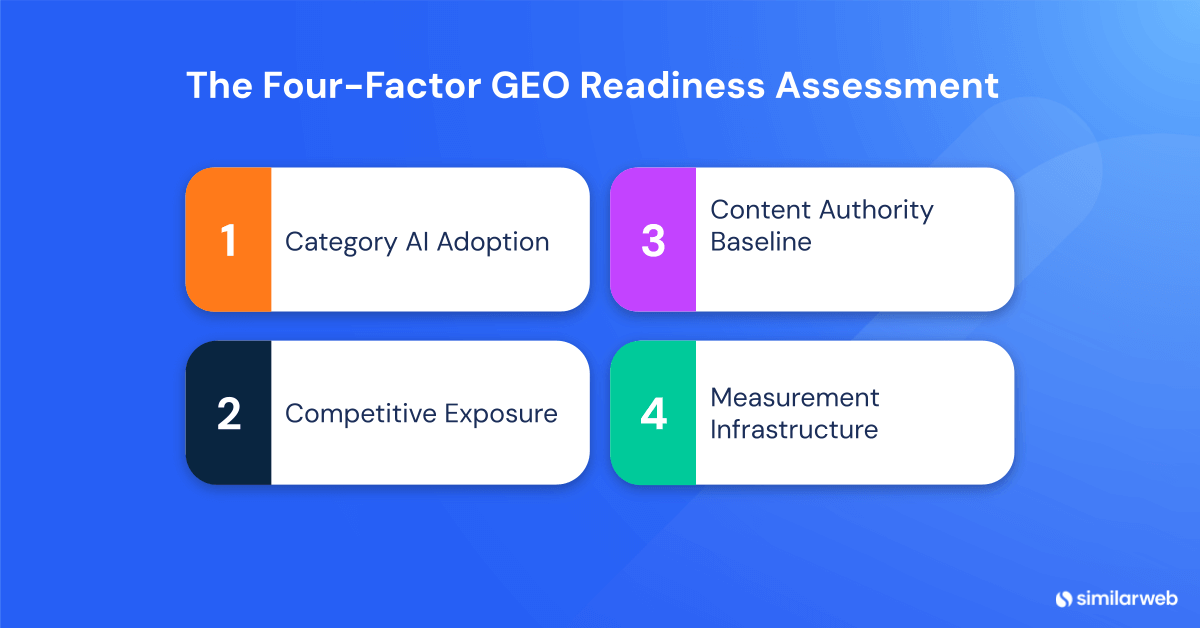
The Four Factors
Factor 1: Category AI Adoption. Is your buyer already asking AI for answers?
Not every category faces the same urgency. If your buyers are technical decision-makers in software or marketing technology, they already use AI tools for research. If you sell industrial equipment to procurement teams, adoption is slower.
The quick test: check whether competitors appear in AI answers for your core category prompts. See what percentage of your category’s high-intent keywords trigger AI Overviews. You can check both using Similarweb’s AI Brand Visibility data.
Then look at the traffic trends. How much AI-referred traffic is flowing to your brand versus your competitors? And what’s happening to your organic search traffic over the past 12 months?
If you’re seeing a significant decline in organic traffic and rising AI traffic to competitors, that’s a clear signal of urgency. It means your buyers are shifting how they research, and the brands showing up in AI answers are capturing the attention you’re losing in traditional search.
High category adoption means higher urgency. Low adoption means you have time, and also a first-mover window.
Factor 2: Competitive Exposure. Are you losing ground you can’t see?
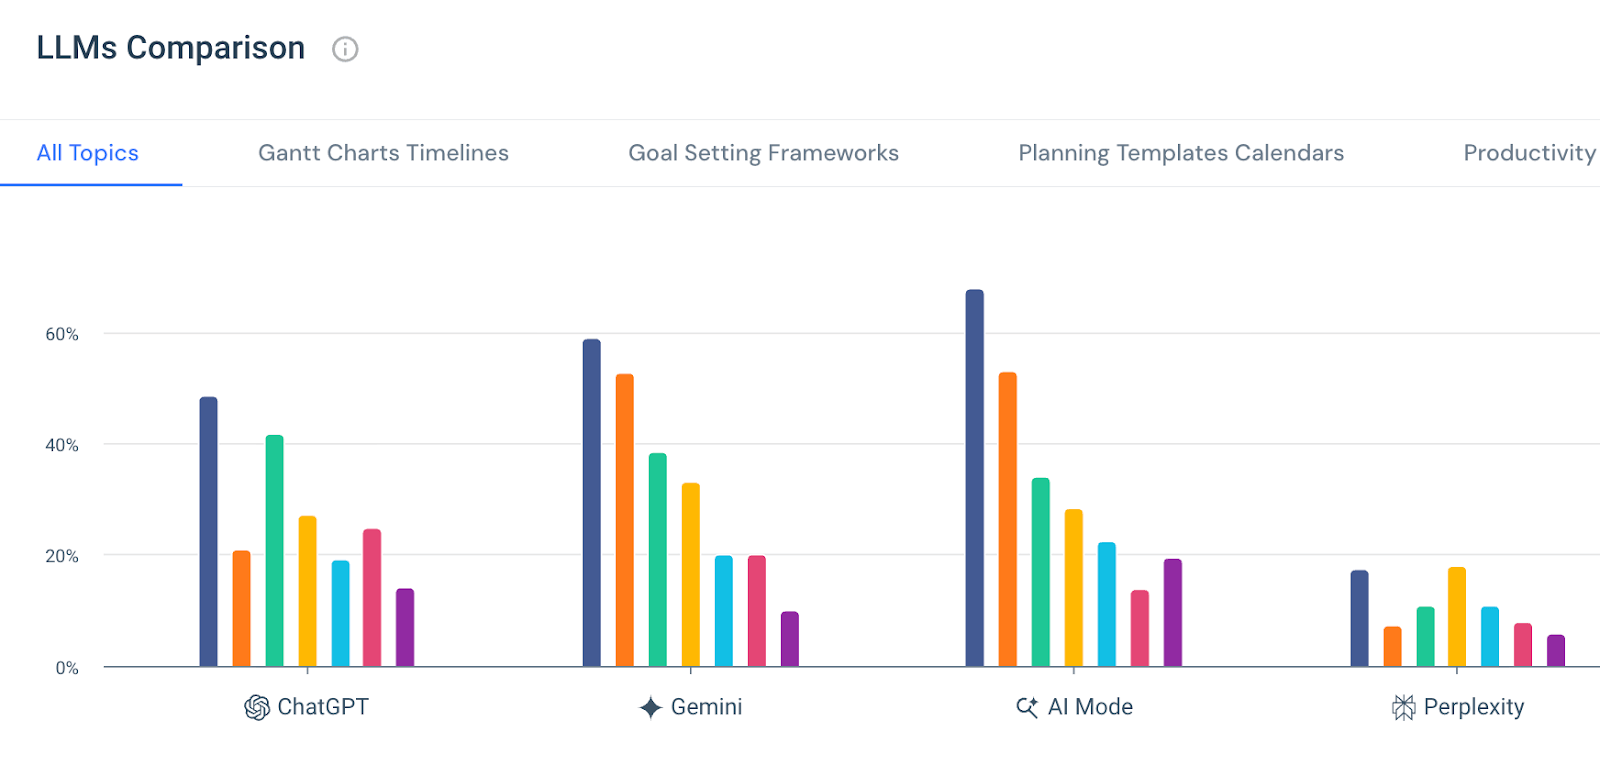
Run 10 high-intent prompts through ChatGPT and Perplexity. Use the questions your buyers actually ask. Count how many times your brand appears versus each competitor. Then compare that to your actual market share and your average ranking position in traditional search.
If you rank top 3 on Google but barely appear in AI answers, you have a visibility gap that no SEO dashboard will show you. Example: you hold 20% market share but show up in 5% of AI answers, while a smaller competitor appears in 60%. They’re building entity authority you’re not, and the AI is shaping your buyer’s shortlist before they ever reach your site. I’ve seen this exercise change the direction of a board meeting in ten minutes.
Factor 3: Content Authority Baseline. Do you have assets AI will cite?
AI systems cite sources they trust. That trust comes from well-structured content backed by third-party signals: analyst reports, review sites, media coverage, industry publications, and backlinks from authoritative domains. Check your backlink profile alongside your content quality. A strong backlink portfolio from respected industry sources signals credibility to both traditional search engines and AI systems. If your content is thin, poorly structured, or lacks external validation and inbound links, GEO optimization won’t help. You need to fix the content and authority foundation first.
Factor 4: Measurement Infrastructure. Can you track what’s happening?
Can you segment AI-referred traffic in your own tools (such as GA4)? Do you have AI visibility monitoring in place? If both answers are no, start here. You can’t optimize what you can’t measure. And you can’t justify continued investment to your CEO without showing progress. Similarweb’s AI Traffic Tracker and visibility monitoring give you this baseline for benchmarking and monitoring the progress of your efforts.
The Demand-Gen Decision Matrix
Once you score all four factors, plot your position on a 2×2 matrix. Category AI Adoption on one axis. Competitive Urgency on the other.
| Low Category AI Adoption | High Category AI Adoption | |
| High Competitive Urgency | Defensive positioning. Your competitors are building authority. Monitor actively, prepare content assets, and be ready to scale quickly when adoption takes off. | Invest aggressively now. Your buyers use AI, your competitors are visible, and every month you wait compounds their advantage. |
| Low Competitive Urgency | Watch and learn. Invest in measurement only. Revisit quarterly. Don’t let FOMO drive premature spending. | Strategic opportunity. AI adoption is high, but competitors haven’t locked up visibility yet. This is your first-mover window. |
Most B2B companies I talk to fall in the upper-right quadrant. If that’s you, keep on reading.
Where to Start: The GEO Priorities Stack
You know your position on the matrix. Now the question is sequencing. Here’s how to prioritize, organized by impact and effort.
Tier 1: Measurement Foundation (Weeks 1 to 4, minimal cost)
Set up AI traffic tracking. Create segments for referral traffic from ChatGPT, Perplexity, Claude, and Google AI. Run an AI brand visibility baseline with tools such as Similarweb’s AI Search Intelligence to see where you show up and where you don’t. Then, audit 20 to 30 high-intent prompts to map your competitive landscape.
Cost: a tool subscription (starting from $99/m) plus 10 to 15 hours of analyst time.
Tier 2: Content Authority Optimization (Months 1 to 3, moderate investment)
Identify the top 10 prompts where you should appear but don’t. Optimize existing high-authority content for AI citability: better structure, clearer entity definitions, stronger E-E-A-T signals (Experience, Expertise, Authoritativeness, and Trustworthiness, the framework AI systems use to evaluate source quality). Create answer-optimized content for key buyer questions where you have gaps.
This is a content team reallocation, not a new budget. You shift how existing resources work, not add headcount. For implementation details, our SEO team published a practical guide on getting traffic from AI.
Tier 3: Active AI Visibility Building (Months 3 to 6, strategic investment)
This is where the real executive decision happens. Tier 3 means third-party authority building through PR, analyst mentions, review site presence, and earned media. It requires cross-functional coordination: SEO, Product Marketing, and PR working together on entity authority. And an ongoing monitoring cadence with quarterly reviews and monthly reporting.
Industry benchmarks put this at $75K to $150K per year for mid-market B2B SaaS and $250K or more for enterprise (in some cases, this budget is offset from traditional PR budget). Most teams execute Tiers 1 and 2 within existing budget. Tier 3 is the decision point.
According to Conductor’s 2026 CMO Investment Report, enterprises already allocate an average of 12% of their digital marketing budgets to AEO and GEO. And 94% of CMOs plan to increase that investment this year.
Budget Reality Check: What GEO Actually Costs
Here are the real numbers.
Reallocation, not new budget. Most GEO investment comes from reallocating existing Search and content budget, not requesting new spend. Start by shifting 10-15% of your organic search budget toward GEO-specific activities. As AI referral traffic grows (it’s increasing by 40% or more per month across most categories), adjust the allocation.
The benchmarks. Based on industry data from companies actively investing in GEO:
| Company Size | Annual GEO Investment | What It Covers |
| Mid-market B2B SaaS ($10 to 50M ARR) | $75K to $150K/year | AI visibility tools, content optimization, authority building, analyst time |
| Enterprise ($50M+ ARR) | $250K+/year | Full program with dedicated headcount, enterprise tools, PR integration |
| 90-day pilot (any size) | $15K to $30K | Tools + targeted content optimization + measurement baseline |
These figures don’t include existing SEO infrastructure or content team salaries. Those are shared resources. This is the incremental investment in GEO-specific work.
The pilot approach. If your CEO wants a low-risk entry, propose a 90-day pilot with clear go/no-go criteria. $15K to $30K is less than one month of typical paid media spend for most companies. Define success upfront: measurable improvement in AI visibility scores, initial citation growth, and directional traffic signals. At day 90, you either have data to justify scaling or you’ve spent a small fraction of your quarterly budget learning something valuable.
The ROI timeline. Months 1 to 3 establish your baseline and yield initial visibility improvements. Months 3 to 6 show citation growth and early traffic signals. Pipeline attribution materializes between months 6 and 12. By months 12 to 18, consistent execution produces compounding returns.
The industry benchmark for B2B SaaS is 3 to 5x ROI on GEO investment by month 18. For the detailed model, our team built a framework and calculator that walks through the math.
The Only Four Metrics That Matter
GEO vendors track dozens of metrics. Most are noise at the executive level. When I report to my CEO and board, I use four.
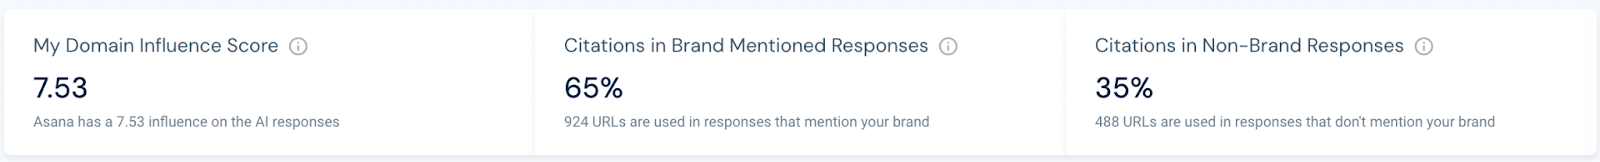
- Brand Visibility Score. The percentage of AI answers that mention your brand relative to all answers. This is your baseline presence metric. If AI engines generate 1,000 answers in your category and your brand appears in 50, your Brand Visibility Score is 5%. A 20% market share with 5% Brand Visibility is a risk signal. Similarweb’s AI Brand Visibility tool tracks this number directly.
- Brand Mention Share. Your share of total brand mentions compared to competitors. Think of it as the AI equivalent of share of voice. Frame it that way for your board because they already understand share-of-voice dynamics. If your Brand Mention Share is shrinking while a competitor’s is growing, they are building AI authority faster than you. Build this into your reporting cadence by connecting GA4 AI traffic segments to your CRM attribution model.

- Sentiment Distribution. Being mentioned is not the same as being recommended. A brand appearing in 50% of AI answers but described as “a more expensive alternative” is in worse shape than one appearing in 30% but recommended as “the most comprehensive solution.” Sentiment determines conversion. Track this through Similarweb’s AI Sentiment Analysis, which breaks down positive, neutral, and negative mentions by topic and competitor.

- Competitive Visibility Gap. The delta between your market share and your Brand Visibility Score. This is the most powerful metric for executive conversations. Show your CEO that you hold 15% market share but only 3% Brand Visibility, while a competitor holds 10% market share and 25% Brand Visibility. You don’t need to explain the GEO theory. The implication is obvious.
Report these four metrics monthly or quarterly. Skip citation counts, prompt coverage percentages, and platform-by-platform breakdowns. Those belong in your SEO team’s weekly standups, not your board deck.
Building the Business Case: The 5-Slide CEO Template
I put together a free template to help you pitch GEO investment to your team. Steal it, tweak it, make it yours:
As Lindsay Boyajian Hagan, VP of Marketing at Conductor, told CMS Critic: “AEO/GEO has moved from initial adoption to essential solution, with 94% of CMOs planning to increase investment in 2026. This speaks to a fundamental shift in how enterprise brands approach discoverability.”
Start your GEO Strategy: What to Do Next
Start with measurement. It takes a week. It costs almost nothing. Run the readiness assessment to calibrate your investment level. If you land in the upper-right quadrant of the matrix (high category adoption, high competitive urgency), move to a 90-day pilot. Track up to four metrics, not twenty. Give your team the mandate to work cross-functionally because GEO doesn’t live in SEO alone.
The growth leaders who build their AI visibility position now will compound an advantage their competitors can’t replicate in 18 months. The ones who wait will make the same investment eventually. They’ll just pay more and start further behind.
See where your brand stands in AI search with Similarweb’s AI Search Intelligence. Make your decision from data, not hype.
FAQ
How much does a GEO strategy cost for B2B SaaS companies?
Budget depends on company size. Mid-market B2B SaaS ($10 to 50M ARR) typically invests $75K to $150K per year. Enterprise ($50M+ ARR) invests $250K or more. Most of this comes from reallocating existing SEO and content budget, not new spend. A 90-day pilot runs $15K to $30K and gives you the data to decide whether to scale. Conductor’s 2026 CMO report found that enterprises allocate an average of 12% of digital marketing budgets to AEO and GEO.
How do you measure the ROI of GEO?
Use the ABMV (AI Brand Mention Valuation) framework to calculate your visibility’s advertising-equivalent value, then track four metrics: Brand Visibility Score (your % of category mentions), Brand Mention Share (vs. competitors), Sentiment Distribution (recommended vs. neutral mentions), and Competitive Visibility Gap (market share vs. AI visibility). Pipeline attribution typically materializes between months 6 and 12.
How long does it take to see results from GEO?
Expect your measurement baseline and initial visibility improvements in months 1 to 3. Citation growth and early traffic signals appear in months 3 to 6. Pipeline attribution starts between months 6 and 12. Compounding returns (the 3 to 5x ROI benchmark) arrive by month 12 to 18. The key: competitor authority compounds, so the cost of waiting 12 to 18 months is 3 to 5x the investment of starting now.
Should I invest in GEO if AI search traffic is less than 1% of web traffic?
Yes, but calibrate your investment level. AI search traffic is small today but growing 40%+ monthly. The more important factor is invisible brand erosion. When 89% of B2B buyers use AI during their research (Forrester), and the zero-click rate in Google’s AI Mode is 93%, your brand is being evaluated in places your analytics can’t track. Use the readiness assessment to determine whether to invest aggressively, run a pilot, or focus on measurement only.

Related Posts


Why Your Competitors Dominate AI Search Results, and You Don’t

10 Best Competitor Analysis Tools for 2026 (Ranked & Reviewed)
Top Web Analytics Tools: Prepare Your Performance Measurement For 2026


Wondering what Similarweb can do for your business?
Give it a try or talk to our insights team — don’t worry, it’s free!