




Tariff Shockwaves Hit Automotive: How Demand and Turmoil Changed it Overnight
by James Quilter6 Min.
May 30, 2025
 Insights
Carvana’s stock has plunged in recent days on fears the company will fall into bankruptcy. After being a huge beneficiary of pandemic stay-at-home trends, the company has been impacted by the reversal of this trend as well as by declining demand. It seems this trend of buying cars at home has faded. Vroom is also seeing a sharp decline in monthly visitors.
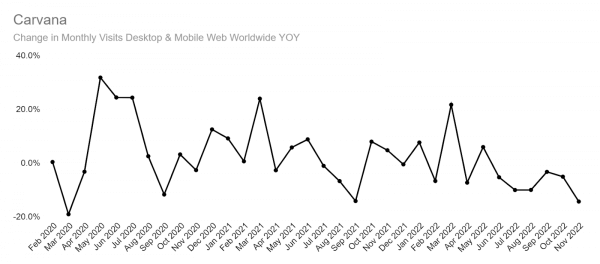
Taking a look at monthly growth for Carvana, you can see in the chart below that traffic growth peaked in early 2020 as the pandemic got underway, with subsequent spikes and declines in traffic in subsequent months. However, the trend has soured greatly, with negative growth in each of the past six months. November saw the decline accelerate, falling 17%, after declines of 5% in October, 6% in September, 6% in August, and 7% in July. The trendline does not look encouraging for demand, when you realize that web visits have to take place for revenue generating activity to occur.
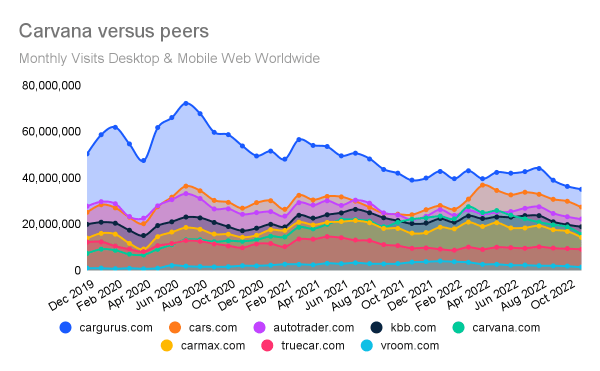
Taking a look at monthly visits for peers, you can see that the entire industry is seeing a decline. By far the worst has been Vroom, which saw monthly traffic decline 21% in November, followed by Carvana with a 17% decline and Carmax with a 15% decline. Cargurus actually fared best in November with only a 4% decline, better than the peer average of an 8% drop.
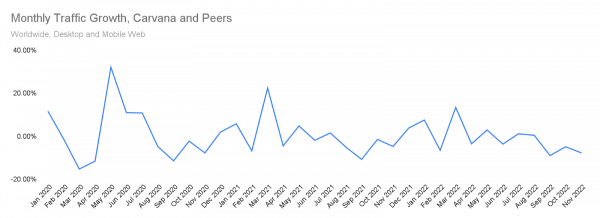
Another way to visualize the demand environment is to look at aggregated traffic to these eight car retailers over time. You can see the chart shows that the entire sector is seeing a slowdown in traffic over the past four months. Aggregated traffic to these eight companies declined 8% in November on a month-over-month basis, after falling 5% in October and 9% in September. On a year-over-year basis, web traffic fell 8% in November, 5% in October and 2% in September.
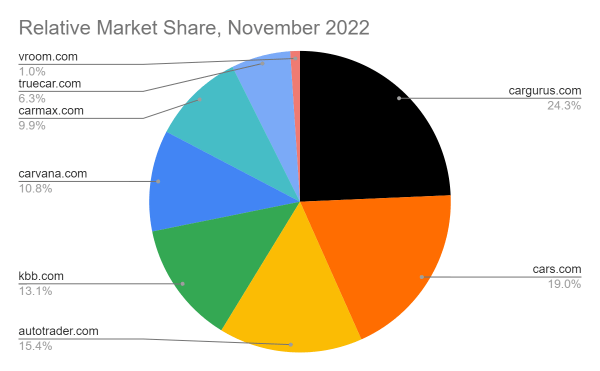
A look at relative share among the eight peers in this report shows Cargurus leading with a 24% share of traffic, followed by cars.com with 19%, and Autotrader with 15%. Carvana sits in the middle of the pack with a 10% share and Vroom lags with just a 1% share of traffic.
The Similarweb Insights & Communications team is available to pull additional or updated data on request for the news media (journalists are invited to write to press@similarweb.com). When citing our data, please reference Similarweb as the source and link back to the most relevant blog post or similarweb.com/blog/insights/.
Disclaimer: All data, reports and other materials provided or made available by Similarweb are based on data obtained from third parties, including estimations and extrapolations based on such data. Similarweb shall not be responsible for the accuracy of the materials and shall have no liability for any decision by any third party based in whole or in part on the materials.

Senior Analyst
Jim provides insights across multiple sectors. With 30 years on Wall Street and numerous awards for stock-picking, he is a SUNY Albany graduate.
Tariff Shockwaves Hit Automotive: How Demand and Turmoil Changed it Overnight

Australia's Favorite Automotive Brands Revealed

Carvana Sees 50% Web Traffic Decline in March; Down 42% in Q1 While Most Peers Grow
Give it a try or talk to our insights team — don’t worry, it’s free!