Prime Day 2025: Retail Winners, Losers, and Key Insights for Q4
by James Quilter4 Min.
Jul 31, 2025
 Insights
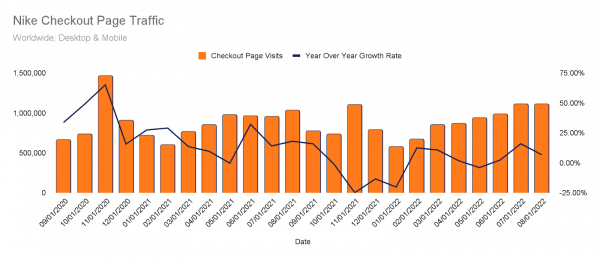
Nike Inc. reports fiscal Q1 (ended in August) results on September 29. Since changing its strategy away from first-party sales on Amazon and other online retailers the company has been able to grow its own direct sales model, according to Similarweb data. These trends were evident in Q1 web traffic and checkout data. For fiscal Q1 (ending in August), traffic to Nike checkout segments showed 8.5% growth over the prior year, and 21% growth over fiscal Q4. Nike-related third-party traffic on Amazon has surged, rising 105% year over year and 59% sequentially, according to Similarweb shopper data.
Nike stopped first-party sales on Amazon.com in December 2019. Since that time, traffic to its own checkout websites has shown steady growth. Monthly growth in web traffic to Nike’s checkout website shows strong growth on a year-over-year and quarterly basis.
Versus the prior year’s Q1 (June-August) checkout traffic grew by 8.5%, an acceleration of the year over year growth in Q4 of 2%. On a quarter over quarter basis, growth over fiscal Q4 (March-May) was 20%, up from 14% growth in last year’s Q1.
With Nike taking charge of most of its direct-to-consumer offerings, traffic to its own checkout sites should be a good indicator of overall demand for its products.
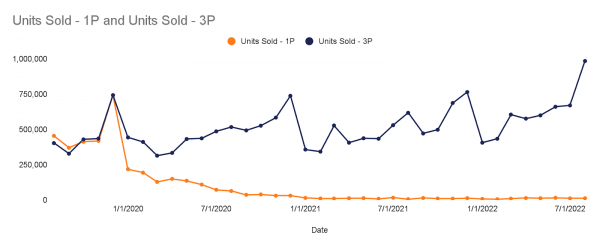
In December 2019, Nike shifted away from selling its shoes on Amazon directly, as it focused on selling directly on its own website and through a few favored retailers like Footlocker and Dicks.
Similarweb shopper data shows that first-party unit sales for Nike on Amazon plunged in subsequent months. However, third-party Amazon listings continued, and have surged since that time. The below chart shows first-party versus third-party sales on Amazon, based on Similarweb shopper data.
The strength in third-party sales on Amazon is a good indicator that overall demand for Nike’s offering remains robust, despite concerns about inflation, recession and the stock market decline.
A look at traffic to nike.com, Nike’s main landing page showed good momentum, with Q1 up 5.1%, year over year. However, versus Q4 web traffic was up only fractionally (0.02%), with Q1 2022 traffic of 432.6 million up only slightly from 432.5 million in Q1. On a monthly basis in Q1, June grew 12% versus the prior month, July was up 4% and August was up 0.4%, so momentum did slow as we moved through the quarter.
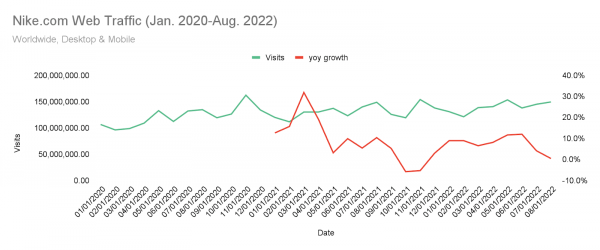
Since Nike stopped selling directly on Amazon, its own web traffic has grown, and in particular, traffic to its checkout site has seen steady growth, indicative of growth in units sold.
At the same time, third-party sales of Nike goods on Amazon grew sharply over that same period, showing that overall demand for the Nike brand remains robust. However, the momentum of traffic to Nike.com did slow as we moved through fiscal Q1.
The Similarweb Insights & Communications team is available to pull additional or updated data on request for the news media (journalists are invited to write to press@similarweb.com). When citing our data, please reference Similarweb as the source and link back to the most relevant blog post or similarweb.com/blog/insights/.
Disclaimer: All data, reports and other materials provided or made available by Similarweb are based on data obtained from third parties, including estimations and extrapolations based on such data. Similarweb shall not be responsible for the accuracy of the materials and shall have no liability for any decision by any third party based in whole or in part on the materials.

Senior Analyst
Jim provides insights across multiple sectors. With 30 years on Wall Street and numerous awards for stock-picking, he is a SUNY Albany graduate.
Give it a try or talk to our insights team — don’t worry, it’s free!