
How Gen AI Tools Are Redefining UK Holiday Planning
by James Quilter4 Min.
Jul 30, 2025
Every two weeks, the Similarweb Stock Solution team produces a series of global and regional web traffic heatmap reports – snapshots of the digital economy’s gains and losses.
Here is a sampling of the industries covered:
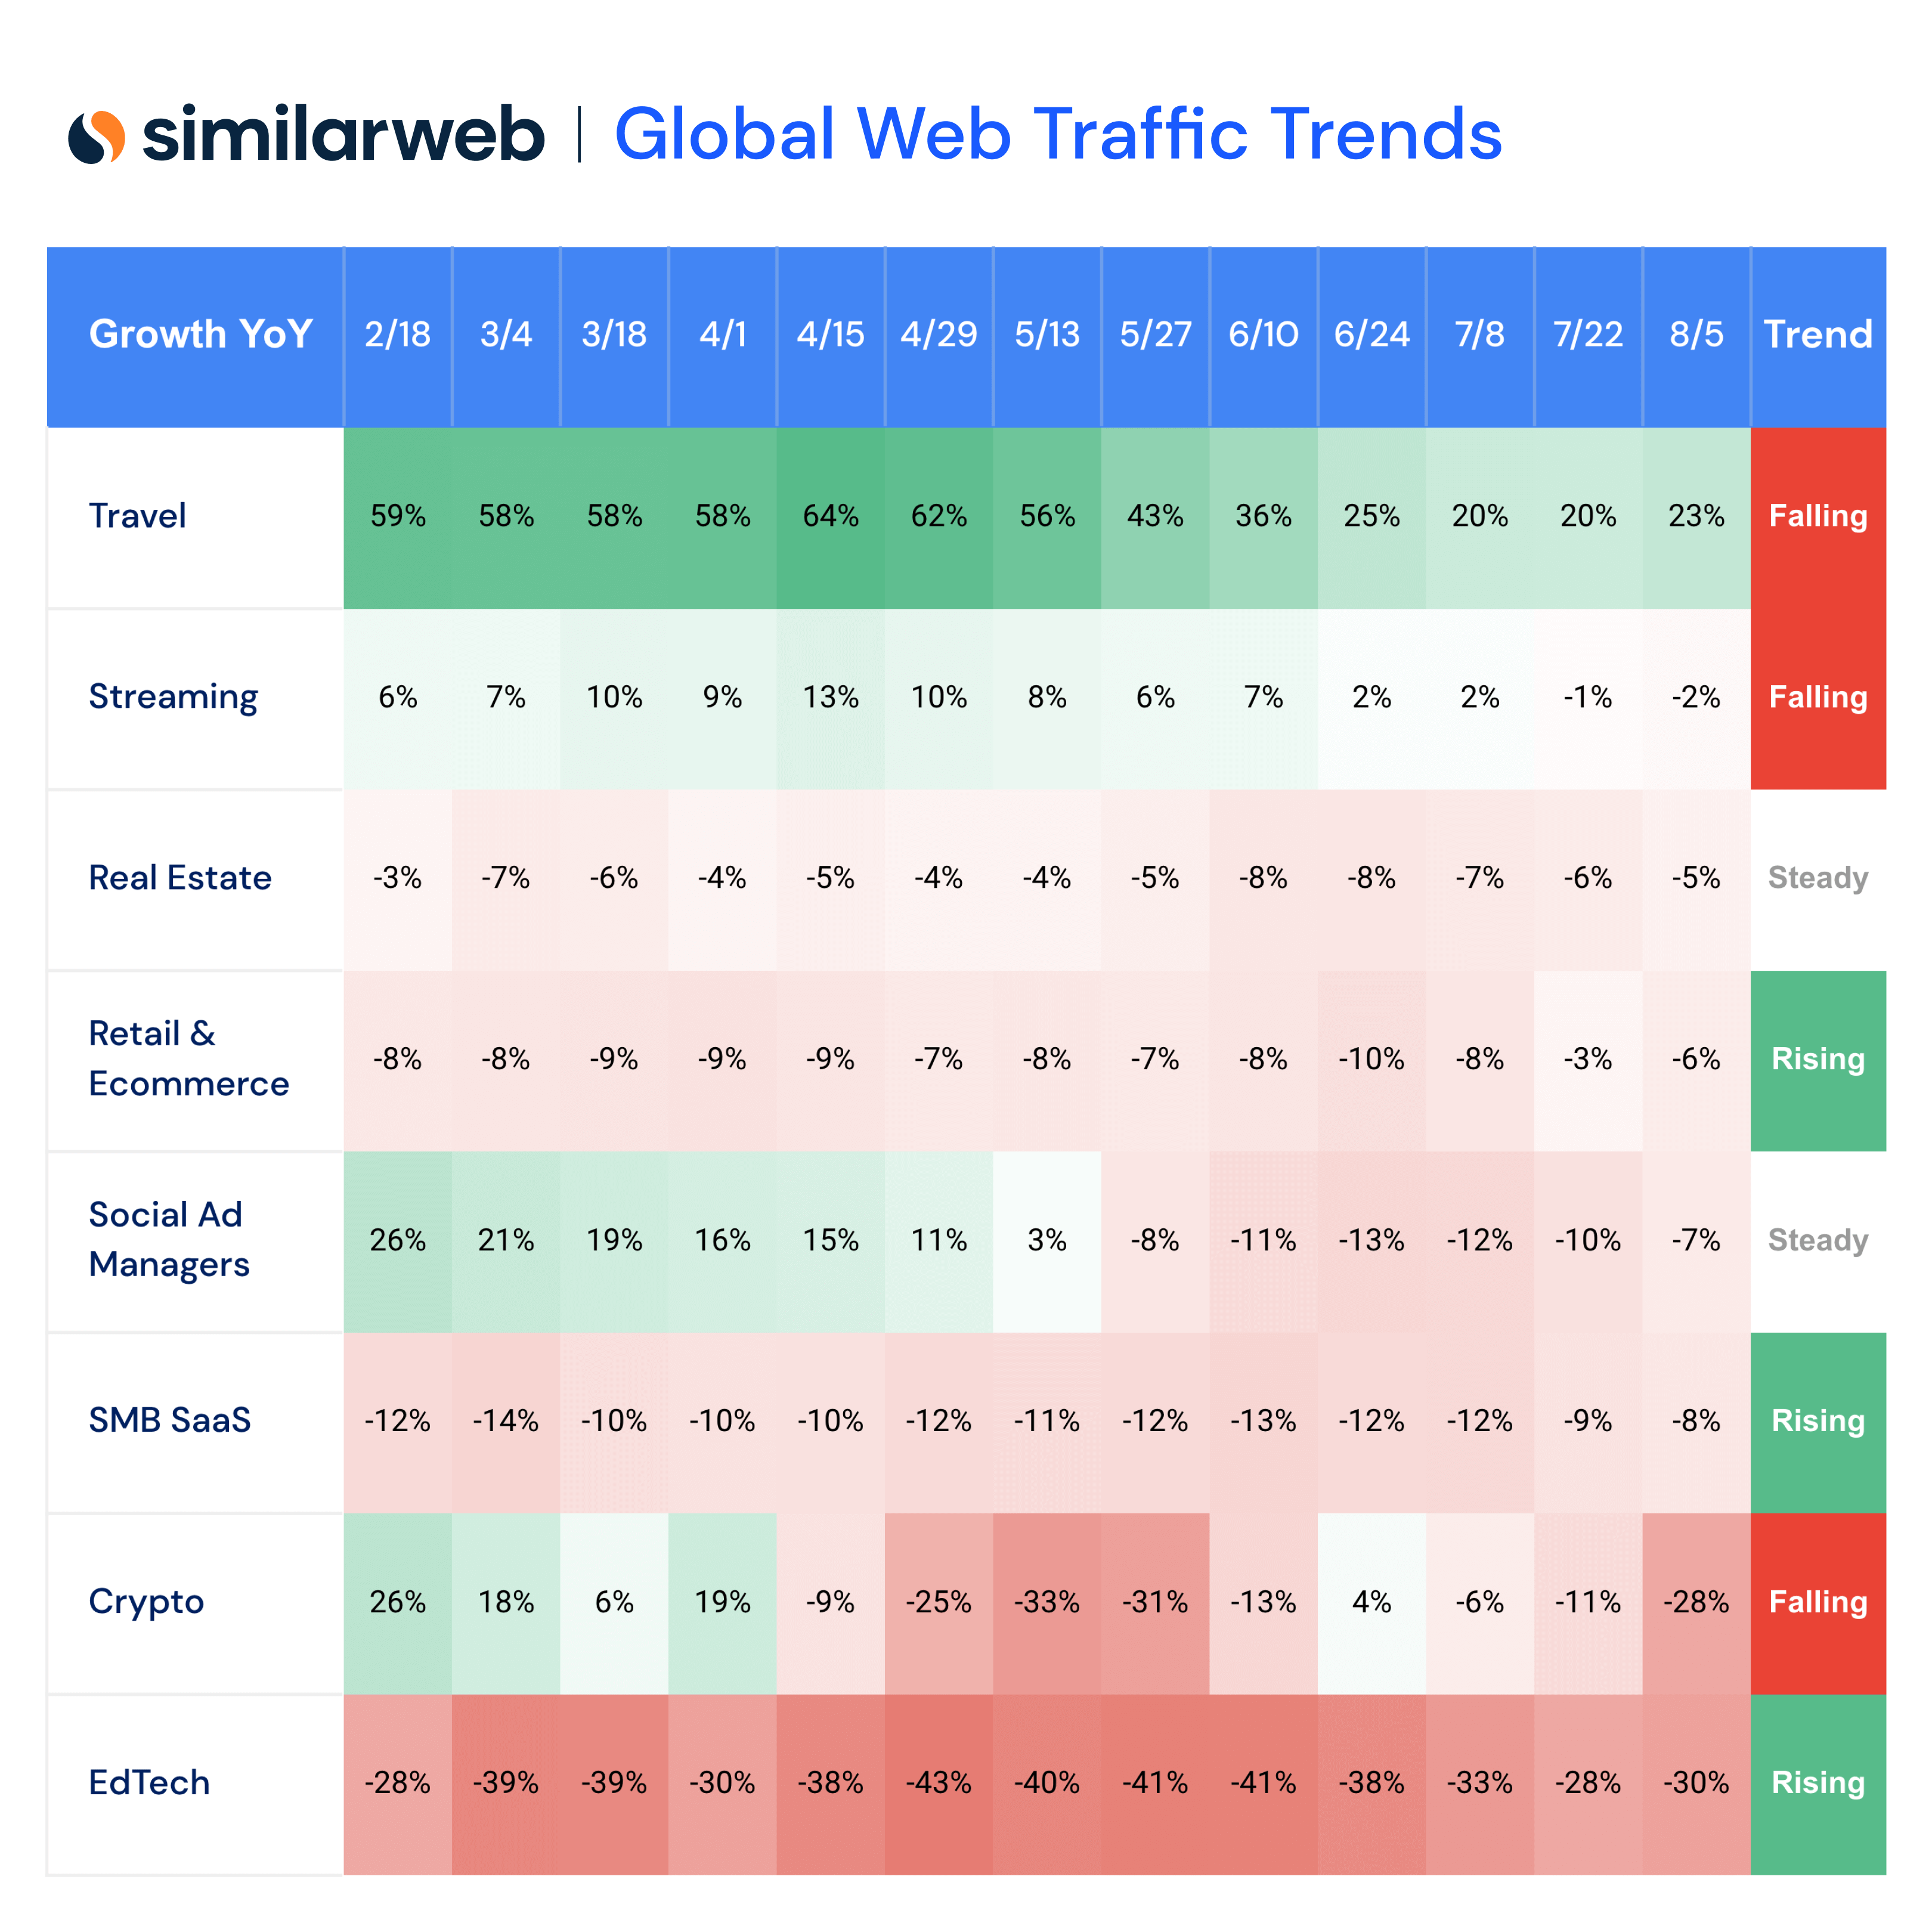
How to read this: Each 2-week snapshot of industry traffic is color-coded green or red for year-over-year increases and decreases. Rising and falling trends are determined by comparing data from the most recent four weeks with the most recent 12 weeks.
Our web traffic heatmap reports look at trends across the digital economy. Investor clients, including some prominent names such as Morgan Stanley, use these statistics as signals of positive or negative momentum. The chart below shows two-week snapshots of each industry’s year-over-year comparison with the traffic it attracted last year. The strongest positive numbers are the darkest green, while the biggest declines are the darkest red, and everything else falls somewhere in between.
Travel is an example of an industry shown as green or growing in each two-week snapshot but nevertheless flagged as “Falling” because that growth has slowed over the past four weeks. On the other hand, Travel’s gain for the last two weeks (23%) was stronger than for the previous two weeks. In the text to accompany the full report, our analysts talk about Travel potentially “stabilizing.”
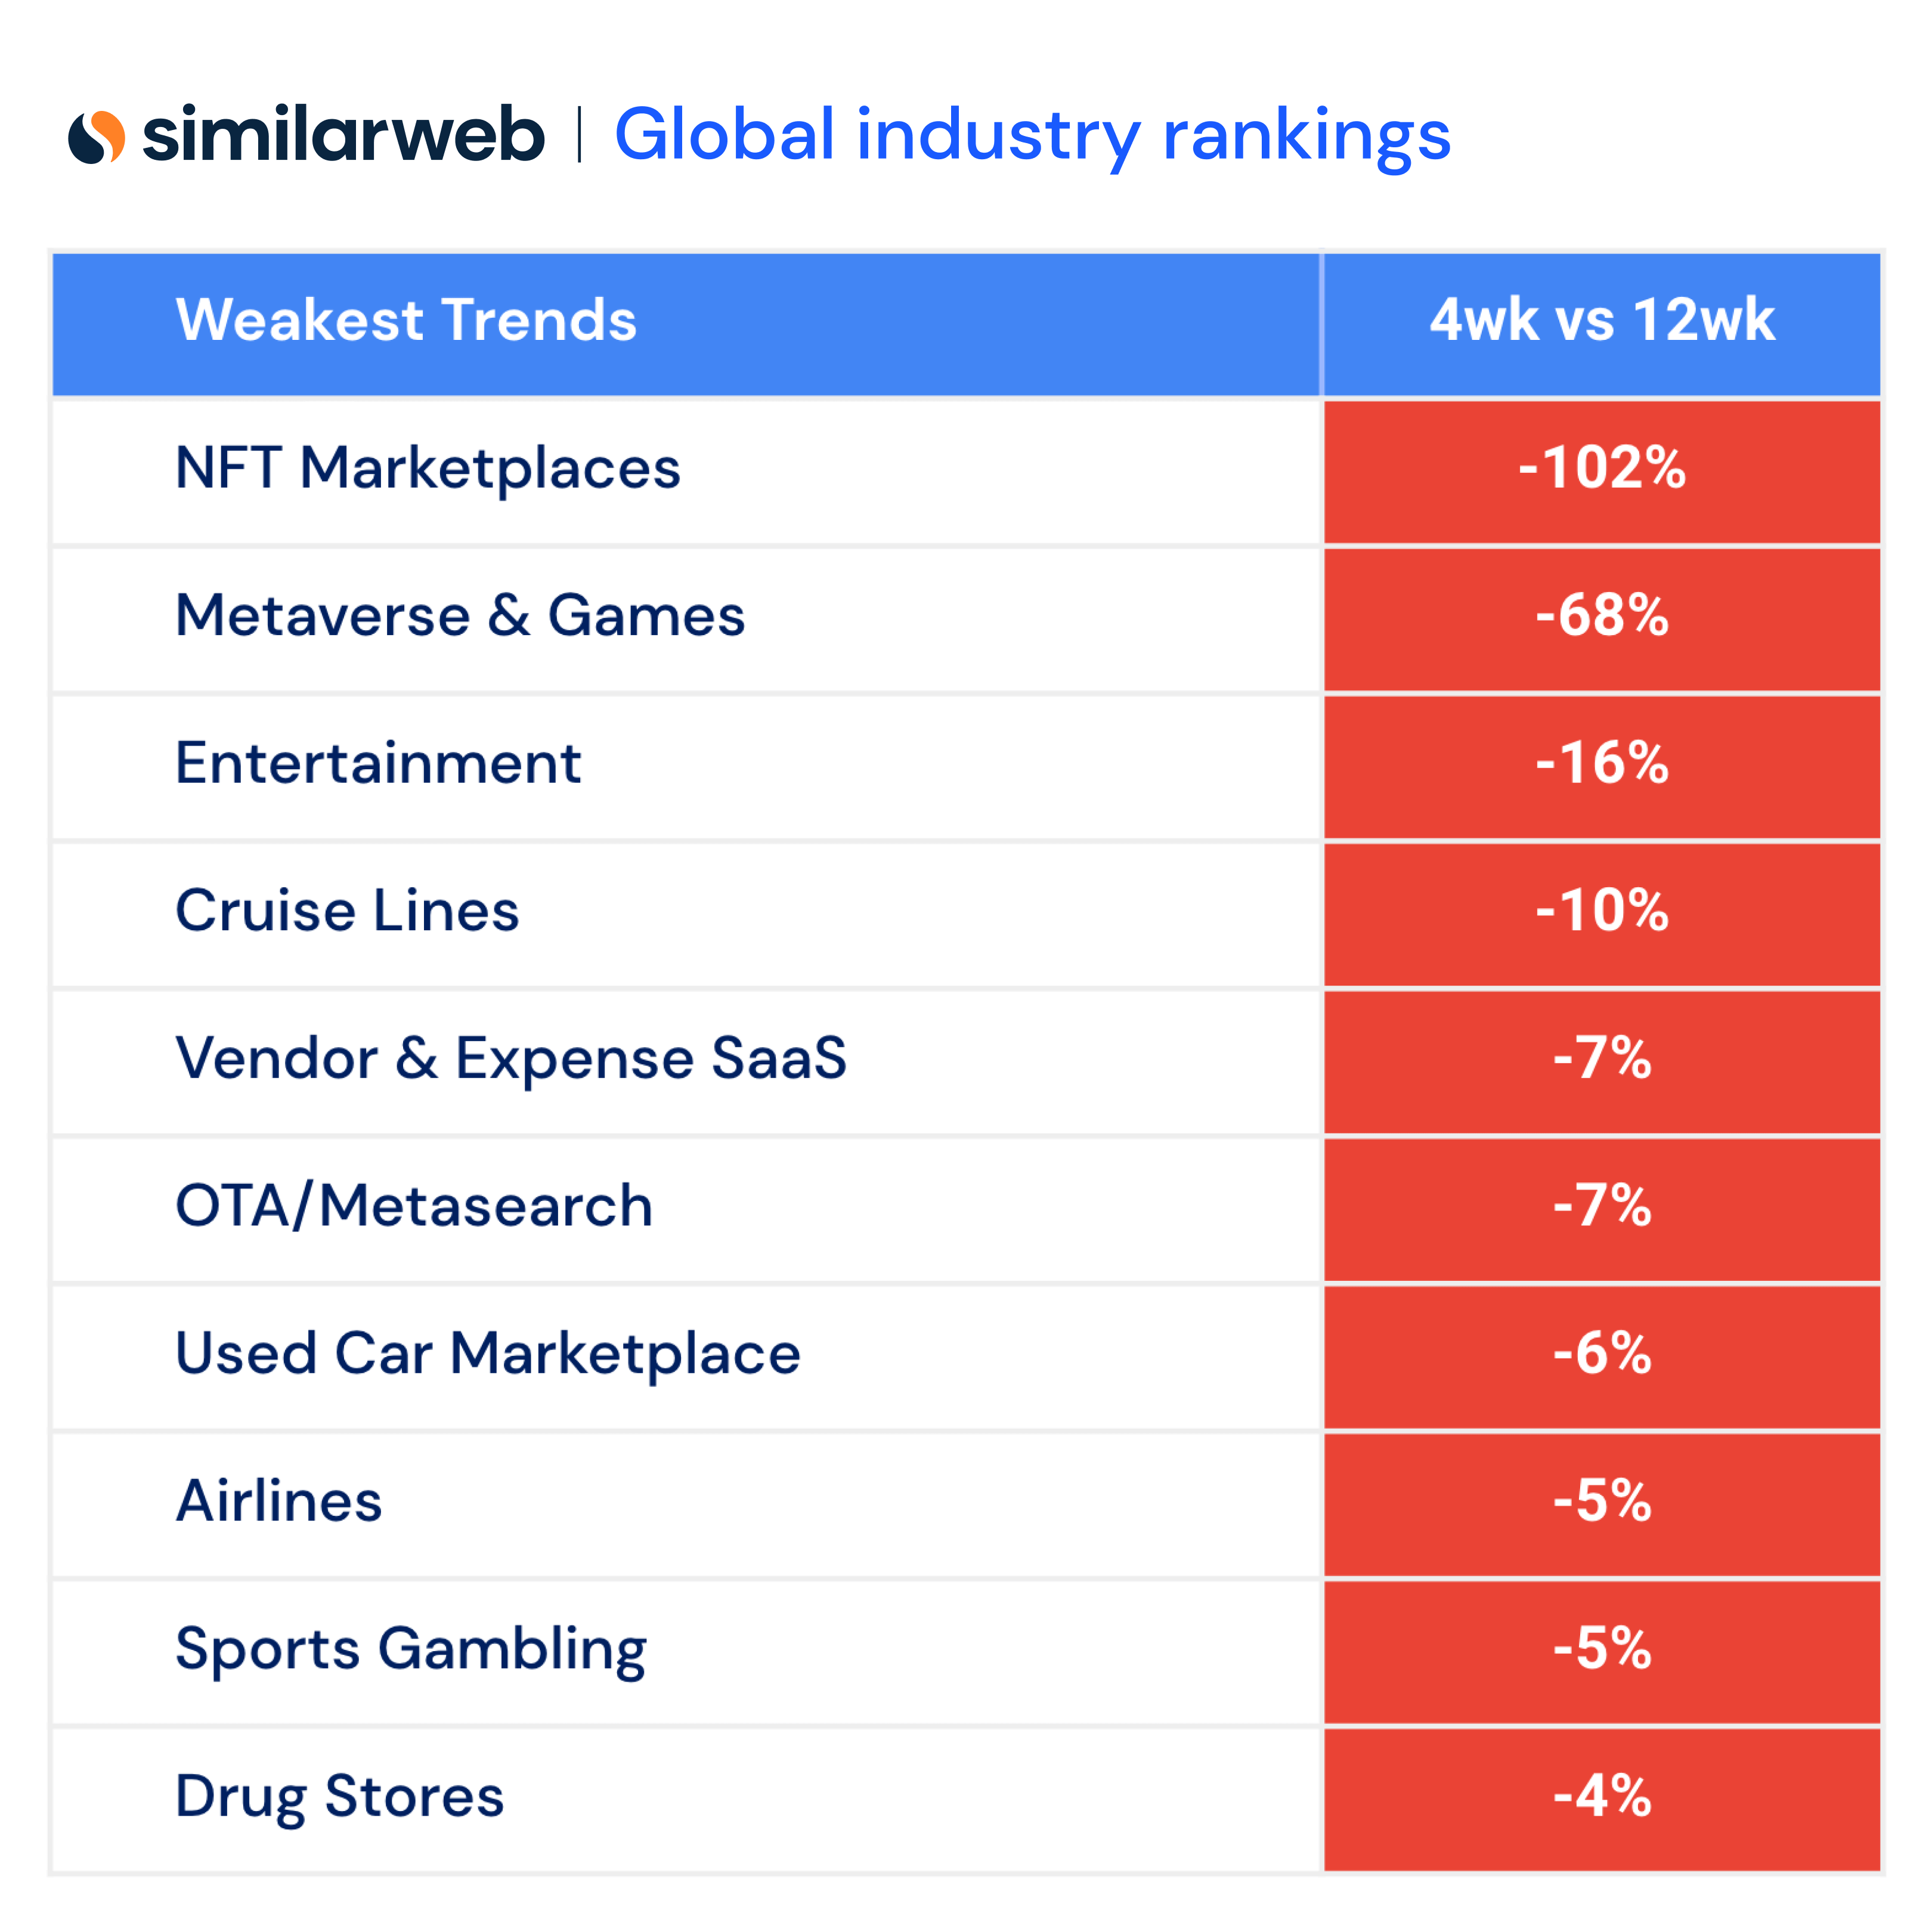
The overall Crypto market, on the other hand, has been negative most of the year and is still falling. Even though the decline in traffic to Crypto Exchanges is slowing, it was still down 24% in the most recent two weeks. The overall market including NFT Marketplaces and blockchain-based Metaverse & Games was down 28%, year over year.
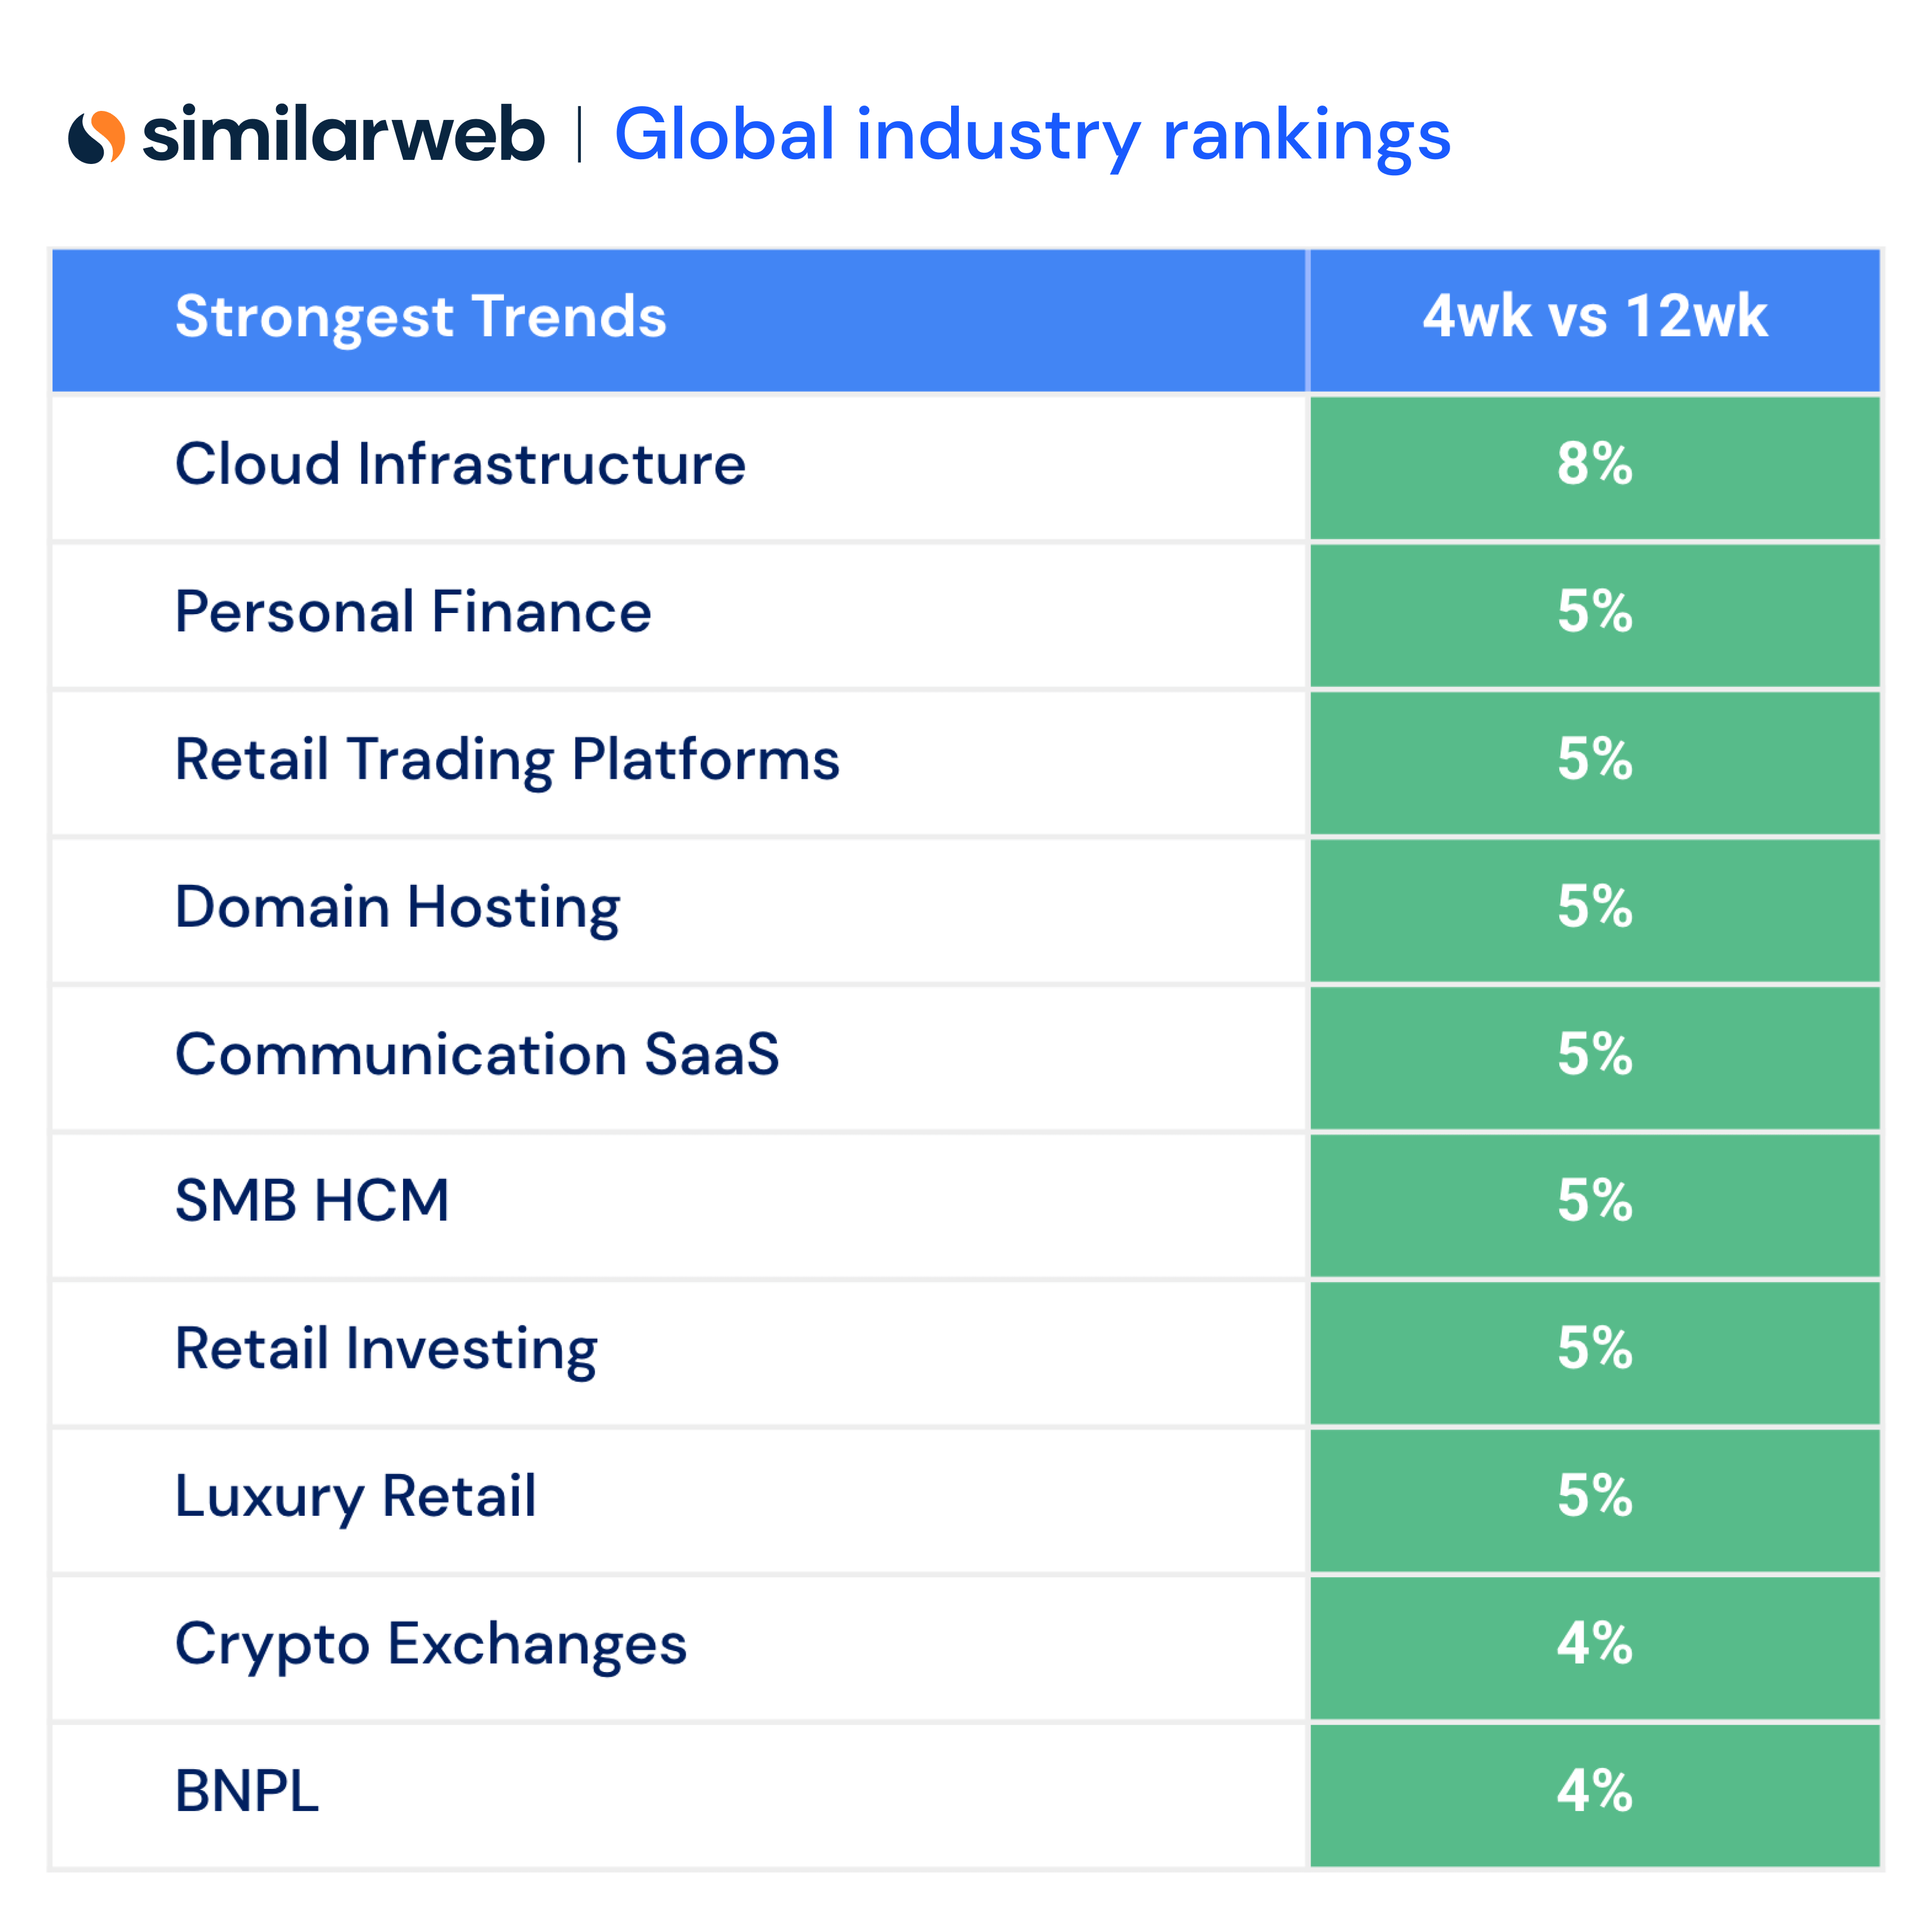
Within each sector, we’ve also identified the most positive trends…
…and the most negative.
So far in 2022, we’re seeing more red than green – traffic falling, rather than rising – across the digital economy. Even some bright spots like travel that have been growing are seeing their growth decelerate. On the other hand, note that EdTech, which has been in the red for the entire period covered by this report, shows signs of rebounding.
These are just a few highlights from the full Similarweb Heatmaps report, available as a free download..
The Similarweb Insights & Communications team is available to pull additional or updated data on request for the news media (journalists are invited to write to press@similarweb.com). When citing our data, please reference Similarweb as the source and link back to the most relevant blog post or similarweb.com/blog/insights/.
Disclaimer: All data, reports and other materials provided or made available by Similarweb are based on data obtained from third parties, including estimations and extrapolations based on such data. Similarweb shall not be responsible for the accuracy of the materials and shall have no liability for any decision by any third party based in whole or in part on the materials.

David covers social media, digital advertising, and generative AI. With a background in web trends since the 1990s, he’s also the author of "Social Collaboration for Dummies".
Give it a try or talk to our insights team — don’t worry, it’s free!