


5 Ways To Use Bing Webmaster Tools AI Performance for GEO
Microsoft launched what Google won’t: An AI measurement tool
For the past two years, we’ve been working on AI search measurement at Similarweb. We’ve built AI visibility tracking across ChatGPT, Perplexity, and other platforms. We’ve helped publishers understand their citation patterns and competitive positioning.
But there’s been a gap: no search engine was providing first-party data on how their own AI systems cite content.
On February 10, 2026, Microsoft changed that. They launched the AI Performance dashboard in Bing Webmaster Tools. The first time any major search platform has given publishers direct, first-party data on how AI systems cite their content.
While Google continues to treat AI Overviews as just another impression type buried in Search Console’s standard performance reporting, Microsoft has built a dedicated dashboard specifically for AI citation tracking.
It represents a fundamental shift: search engines are finally acknowledging that AI visibility needs its own measurement infrastructure.
Yes, Bing has a single-digit market share. Yes, most of your traffic probably comes from Google. And yes, you should still pay attention to this, because Microsoft is providing first-party citation data that the industry has needed.
This isn’t just about Bing citations. It’s about having first-party, quantifiable data directly from a search engine instead of relying solely on third-party measurement.
In this guide, I’ll walk you through everything: what Microsoft launched, what the metrics actually mean, and six practical ways to use this data for GEO.
Let’s get into it.
Understanding Bing’s AI performance tool
What Microsoft just launched and why it’s a big deal
On February 10, 2026, Microsoft officially launched AI Performance as a public preview feature in Bing Webmaster Tools. According to the product managers behind the release, this represents “an early step toward Generative Engine Optimization tooling in Bing Webmaster Tools.”
The dashboard tracks citation activity across Microsoft Copilot, AI-generated summaries in Bing, and select partner integrations. Using it, publishers can see how often their content is referenced in generative answers, which URLs are cited, and how citation activity changes over time.
Microsoft is framing this as an extension of traditional webmaster tools (indexing, crawl health, and search performance) into the new world of AI-generated answers.
They’re acknowledging the change: visibility isn’t only about blue links anymore. It’s also about whether AI systems reference you when generating answers.
For a deeper understanding of how GEO differs from traditional SEO and why both disciplines matter, see our comparison guide.
The competitive context makes this launch significant:
- Google includes AI Overviews data within standard Search Console performance reporting but offers no dedicated AI dashboard, no citation-style URL tracking, no grounding queries, and no separate AI trend visualizations.
- ChatGPT, Perplexity, Claude, and other AI platforms offer publishers exactly zero tools for visibility measurement.
- Bing is treating AI citations as a first-class metric with a dedicated reporting infrastructure. Everyone else is either ignoring publisher needs or treating AI visibility as an afterthought.
Which metrics does the dashboard track?
The AI Performance dashboard provides five distinct data views. Understanding what each metric actually measures (and what it doesn’t) is important for using the data effectively.
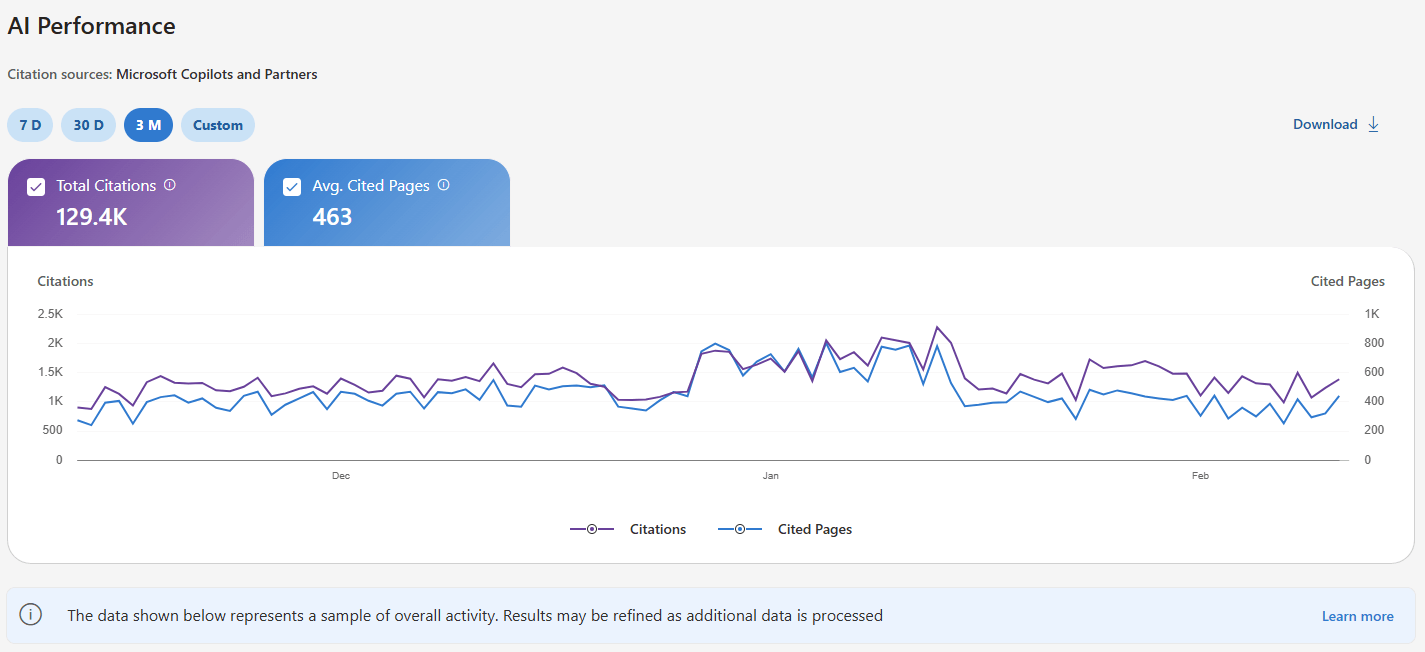
1. Total Citations
Definition: The total number of times your site appears as a source in AI-generated answers during the selected timeframe.
What it measures: Citation frequency. How often do AI systems across Microsoft’s ecosystem reference your content when generating answers?
What it DOESN’T measure: Placement position, prominence within specific answers, or the contribution quality of your citation. Being cited as “the definitive guide according to [YourSite]” counts the same as being listed as reference #12 in a footnote.
Example interpretation: If you have 2,450 citations in February 2026, it means your content was used as source material 2,450 times across Copilot, Bing Chat, and partner integrations.
Strategic value: This is your primary GEO KPI in Bing for tracking the overall AI visibility trend. Month-over-month changes in total citations indicate whether your efforts are working.
Critical limitation: All citations are weighted equally. The metric treats a primary source citation the same as a supplementary mention buried at the bottom of a response.
2. Average Cited Pages
Definition: The daily average number of unique URLs from your site that are displayed as sources in AI-generated answers over the selected time range.
Data aggregation: This metric combines data across all supported AI surfaces-Copilot, Bing Chat, and partner integrations.
What it measures: Citation diversity across your content. A high number indicates AI systems are drawing from many different pages on your site. A low number suggests concentrated authority in a few URLs.
What it DOESN’T measure: Ranking, authority within your niche (domain influence), or the role of any page within an individual answer.
Example interpretation: An average of 23 cited pages per day means AI systems are pulling from 23 unique URLs daily when generating answers.
Strategic value: This metric shows whether your AI visibility is concentrated or distributed. A site with 2,000 citations but only 5 average cited pages has a dependency problem-lose those 5 pages, and you lose all AI visibility. A site with 2,000 citations and 80 average cited pages has built broader topical authority.
Red flag signal: Low average cited pages, combined with high total citations, indicates over-reliance on a few cornerstone pieces of content. If those pages become outdated or competitors overtake them, your entire AI visibility collapses.
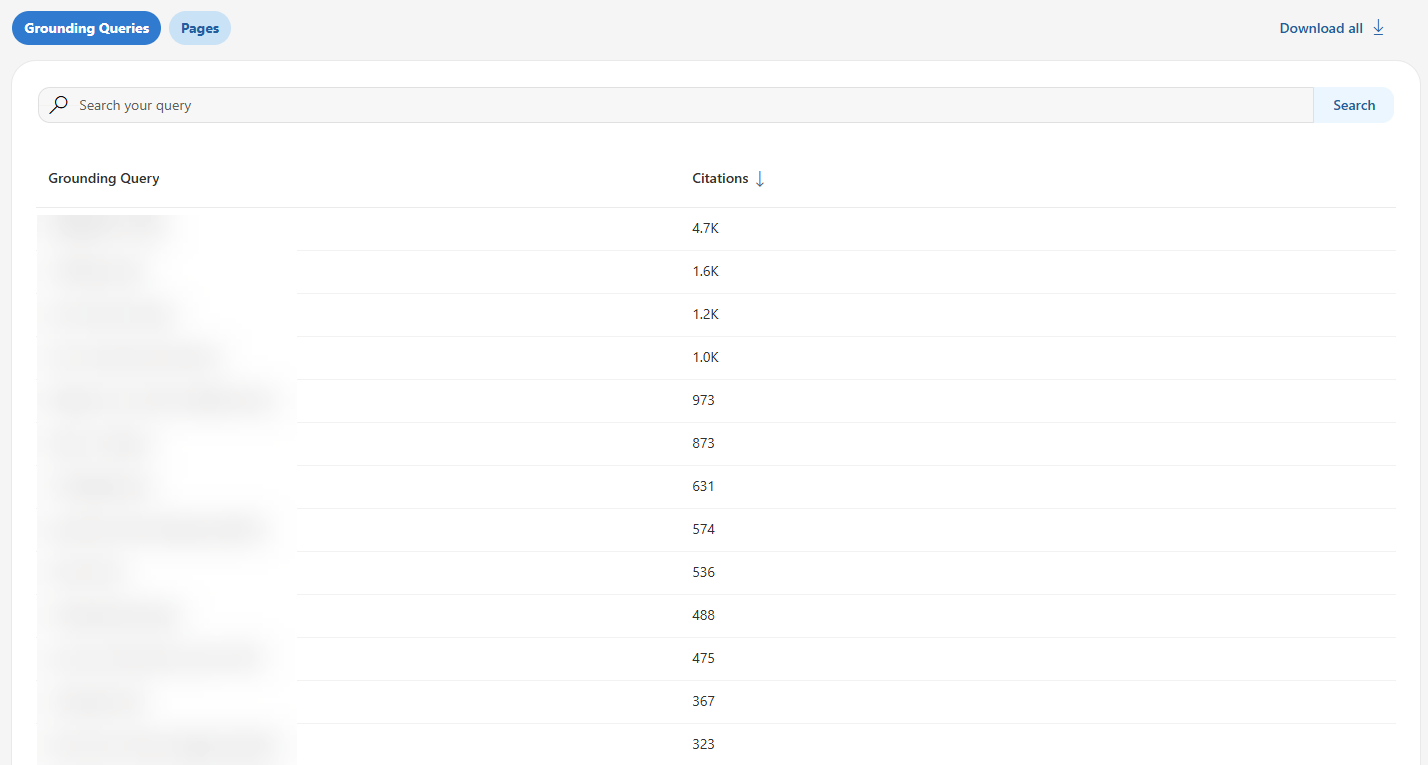
3. Grounding Queries
Definition: The key phrases AI systems use when retrieving content that was referenced in AI-generated answers.
CRITICAL CLARIFICATION: These are NOT user search queries or prompts.
This is one of the most misunderstood aspects of the dashboard: Grounding queries represent the internal retrieval phrases AI systems use to find your content, not the questions users actually asked.
Think of it this way: A user asks Copilot, “How do I secure my company’s API?” The AI system might then use internal retrieval queries like “API security best practices enterprise” or “OAuth implementation authentication” to find relevant content. Those internal queries are what you see in grounding queries.
Data limitation: Microsoft explicitly states this represents “a sample of overall citation activity.” They haven’t disclosed what percentage of grounding queries are shown or how the sample is selected. The product team notes they “will continue to refine this metric as additional data is processed.”
Example: If grounding queries show “OAuth implementation enterprise microservices,” the AI system used that phrase internally to retrieve your content, even if the user’s actual question was phrased completely differently.
Strategic value: Grounding queries reveal what AI systems think your content is topically about. They show you the AI’s perspective on your content positioning, which may differ significantly from your intended target audience.
User confusion point: SEOs can assume these are actual user queries and start optimizing for them directly. That’s not quite right. These are AI’s internal assessments of your content’s relevance, which are valuable but distinct from keyword targeting.
4. Page-Level Citation Activity
Definition: Citation counts for specific URLs from your site during the selected date range across all AI-generated answers.
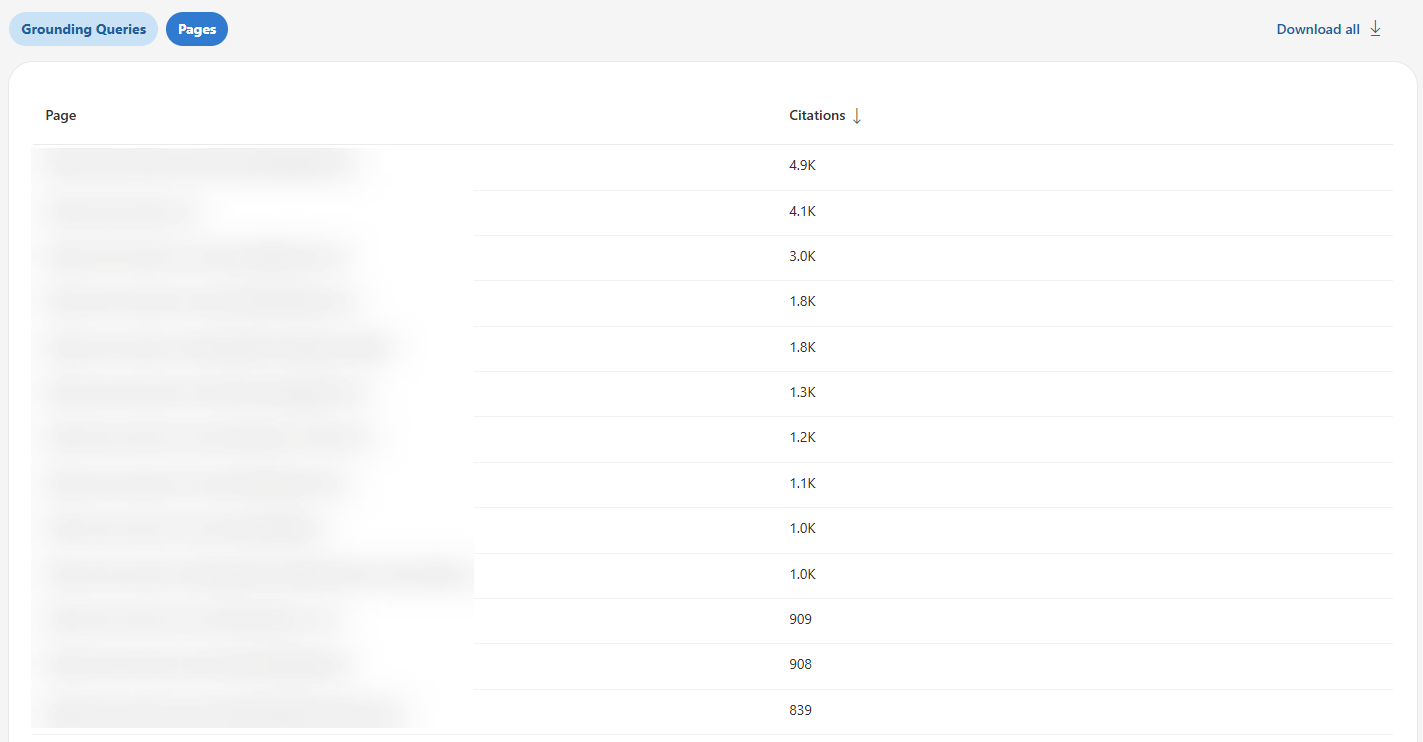
What it measures: Which individual pages AI systems reference most frequently. This is actionable data-you can see exactly which URLs are performing in AI citations and which aren’t.
What it DOESN’T measure: Page importance in absolute terms, competitive ranking, or placement within answers. A page with 347 citations might be dominating your niche or might be middle-of-the-pack compared to competitors-the dashboard doesn’t tell you which.
Example: Your /api-security-guide page shows 347 citations; your /oauth-tutorial page shows 189 citations, and your /authentication-methods page shows 67 citations. You now know which content AI systems consider most citation-worthy.
Strategic value: Identify your highest-performing content for AI systems, then reverse-engineer what makes those pages successful. Common patterns across top-cited pages reveal your “GEO content DNA” (the structural elements, content depth, and formatting that AI systems prefer from your site).
Optimization path: Pages with high historical citations but declining trends need immediate attention. Pages with zero citations despite being indexed are optimization opportunities.
5. Visibility Trends Over Time
Definition: A timeline showing how citation activity for your site changes over time across supported AI experiences.
Visualization: The dashboard displays trend lines, making it easy to spot patterns at a glance: upward trends (growing AI visibility), flat trends (stable performance), or downward trends (declining citations).
Strategic value: Trend data helps you identify the impact of optimization efforts, spot content decay, correlate citation changes with major content updates, and detect competitive displacement events.
Example use: You notice citations dropped 40% over six weeks starting in mid-January. Analysis reveals that a competitor published a comprehensive guide that overtook your content. Time to update and enhance your coverage.
Historical data limitation: As a public preview feature, you have limited baseline data, 30-90 days maximum initially. True trend analysis requires 12-18 months of data, which won’t be available for some time.
This, for the first time in many years, gives Bing an advantage over Google’s Search Console. They are the first search engine to break the AI data boundary and provide users with what they have been asking for in the past 2 years.
How Bing’s new features compare to Google Search Console
Here’s a short analysis of how Bing stacks up vs. Google Search Console (SEOs’ favorite), strictly in terms of features:
| Feature | Bing AI Performance | Google Search Console |
|---|---|---|
| Dedicated AI dashboard | ✅ Yes – separate section | ❌ No – mixed with standard performance |
| Citation-style tracking | ✅ Yes – counts by URL | ❌ No – only impressions/clicks |
| Grounding queries | ✅ Yes – sample provided | ❌ No |
| Page-level AI metrics | ✅ Yes – citations per URL | ⚠️ Limited – AI impressions aggregated |
| Trend visualization | ✅ Yes – dedicated timeline | ⚠️ Partial – within standard reports |
| AI surfaces covered | Microsoft ecosystem only | Google AI Overviews only |
| Click data from AI | ❌ No | ✅ Yes – AI Overview clicks tracked |
| API access | ❌ Not yet | ✅ Yes – via standard API |
Bing offers AI citation metrics (more GEO-oriented). Google offers AI overviews, impressions (AEO-oriented), and traffic attribution, but no AI-specific metrics. Neither gives you the complete picture.
Now it’s time to take Bing Webmaster Tools’ new dashboard for a ride. Let’s get started:
How to access
Access the AI Performance dashboard at bing.com/webmasters/aiperformance (requires verified site ownership in Bing Webmaster Tools).
- Tracked platforms: Microsoft Copilot, Bing Chat, select partner integrations
- NOT tracked: Google AI Overviews, ChatGPT, Perplexity, Gemini, Claude
The dashboard shows 30 days of data by default with adjustable ranges. During public preview, historical data is limited to 30-90 days.
Note: Bing respects robots.txt preferences, so any blocked content won’t appear in citation data.
5 ways to use Bing’s AI performance data for GEO
Now that you understand what the tool does, let’s get into the tactical applications. These are concrete, actionable ways to use AI Performance data for GEO.
1. Identify content patterns that get citations
What Bing shows: Page-level citation counts showing which URLs Microsoft’s AI systems reference most frequently.
Review your top-cited pages to see which content Copilot and Bing Chat prefer.
Quick pattern analysis: Look at your top 10-20 cited pages. Do they share common elements?
- Similar content types (guides, tutorials, documentation)?
- Specific topics or subject areas?
- Structural elements (tables, FAQs, code examples)?
- Content depth or format?
Example:
Top 5 cited pages:
- /api-security-guide (347 citations)
- /oauth-tutorial (189 citations)
- /authentication-methods (67 citations)
- /rest-api-best-practices (54 citations)
- /api-key-management (34 citations)
Pattern identified: Security-focused technical guides with implementation examples perform well. All 5 pages include code samples and comparison tables.
Actionable insight: Replicate this pattern. When creating new content, prioritize technical implementation guides with code examples and comparison tables (these formats are supported by Bing’s AI systems).
The limitation: You see patterns in what BING cites, with zero competitive context. You don’t know if these patterns work across all AI platforms or just Microsoft’s systems.
3. Research Grounding Queries for topic expansion opportunities
What makes this unique: Grounding queries are exclusive to Bing. No other AI platform reveals its internal retrieval phrases. This is genuinely valuable Microsoft-specific insight.
What to do: Use grounding queries to discover what AI systems THINK your content is about (which may differ from what you intended).
Grounding Query gap analysis framework:
- Export all grounding queries from the dashboard
- Look for unexpected phrases (queries you didn’t optimize for)
- Identify topic adjacencies (related subjects AI systems associate with your content)
- Find semantic gaps (related queries where you don’t appear)
Step 1: Export and categorize
Export all grounding queries from your AI Performance dashboard. Categorize each into one of three buckets:
Expected (queries you intentionally optimized for):
- “OAuth implementation” ✅ Content exists and performs
Unexpected (queries AI found you relevant for):
- “Enterprise SSO integration” ⚠️ No dedicated content – opportunity
- “Microservices authentication” ⚠️ Mentioned but not comprehensive – expand
Missing (related queries where you DON’T appear):
- “SAML authentication guide” ❌ Competitors dominate – create content
- “API gateway security” ❌ Zero visibility – opportunity gap
Step 2: Analyze unexpected citations
These represent opportunity. AI systems found your content relevant for queries you didn’t optimize for.
This reveals:
- Natural semantic associations you missed
- Content angles you haven’t fully explored
- Related topics where you have latent authority
- New content cluster opportunities
Step 3: Investigate missing topics
If you target “API security best practices” across 10 pages, but it never appears in grounding queries, AI systems don’t associate you with that topic despite your efforts.
This reveals:
- Content gaps (you lack the depth AI systems need)
- Optimization gaps (content exists but lacks citation-worthy structure)
- Positioning mismatches (your framing doesn’t match AI’s categorization)
- Competitive displacement (others dominate this topic in AI’s ranking)
Step 4: Find the gaps
- Unexpected opportunity:
- Grounding query appears: “enterprise OAuth implementation microservices architecture”. You never explicitly targeted “microservices architecture” in your OAuth content
- Investigation: Your OAuth guide includes one section mentioning microservices in passing
- Opportunity: AI systems found that section valuable; expand it into a full content cluster
- Action: Create dedicated content on “OAuth in Microservices,” “Service-to-Service Authentication,” “Zero-Trust Architecture for Microservices.”
- Missing target topic:
- You target “API security best practices” across 8 comprehensive pages. Query is completely absent from the grounding data
- Investigation: Competitors dominate this exact phrase in AI citations
- Diagnosis: Your content is strong but framed differently. AI systems associate competitors with this specific framing
- Action: Add sections explicitly titled “API Security Best Practices,” use this exact phrasing in H2s and introductions, and potentially create dedicated “best practices” checklist content
- Expansion signal:
- Grounding query: “OAuth vs SAML comparison enterprise authentication”.
- Your current content gets a brief mention of SAML in OAuth guide (2 paragraphs). AI systems are citing you for comparison content despite minimal coverage
- Opportunity: Create comprehensive OAuth vs SAML comparison content
- Action: Detailed comparison table, use case matrix, migration guide, decision framework
Strategic plays:
- Build content clusters around high-frequency unexpected grounding queries: If “enterprise implementation” appears in 15 different grounding queries, create an enterprise-focused content cluster
- Optimize existing pages for missing topics: Add sections explicitly addressing target queries that don’t appear in grounding data. Use AI’s preferred terminology
- Use grounding query language in your content: AI is showing you its semantic preferences-mirror that language in H2s, introductions, FAQ questions, and meta descriptions
- Identify semantic bridges: Grounding queries reveal how AI connects related concepts. Use these connections to build internal linking strategies and content pathways
Caveat reminder: Grounding queries are sampled, not comprehensive. Don’t over-index on absence-a missing query doesn’t definitively mean you’re not cited for it. But patterns across multiple related missing queries indicate genuine gaps.
Advanced application: Track grounding queries month-over-month to identify emerging topics early. New grounding queries appearing in your data represent trending topics where AI systems are starting to cite you-capitalize on these early signals before competitors do.
4. Track citation trends in Bing
What Bing shows: Citation volume over time for Microsoft platforms.
Use the visibility trends chart to spot pages gaining or losing citations in Copilot and Bing Chat.
What to do: Use the visibility trends over time to identify pages losing AI citation momentum, then prioritize them for updates.
Not all citation declines deserve immediate attention. A page dropping from 5 citations to 3 citations isn’t urgent. A page dropping from 145 citations to 34 citations is screaming for intervention.
The framework I recommend: Citation Decay Priority Matrix
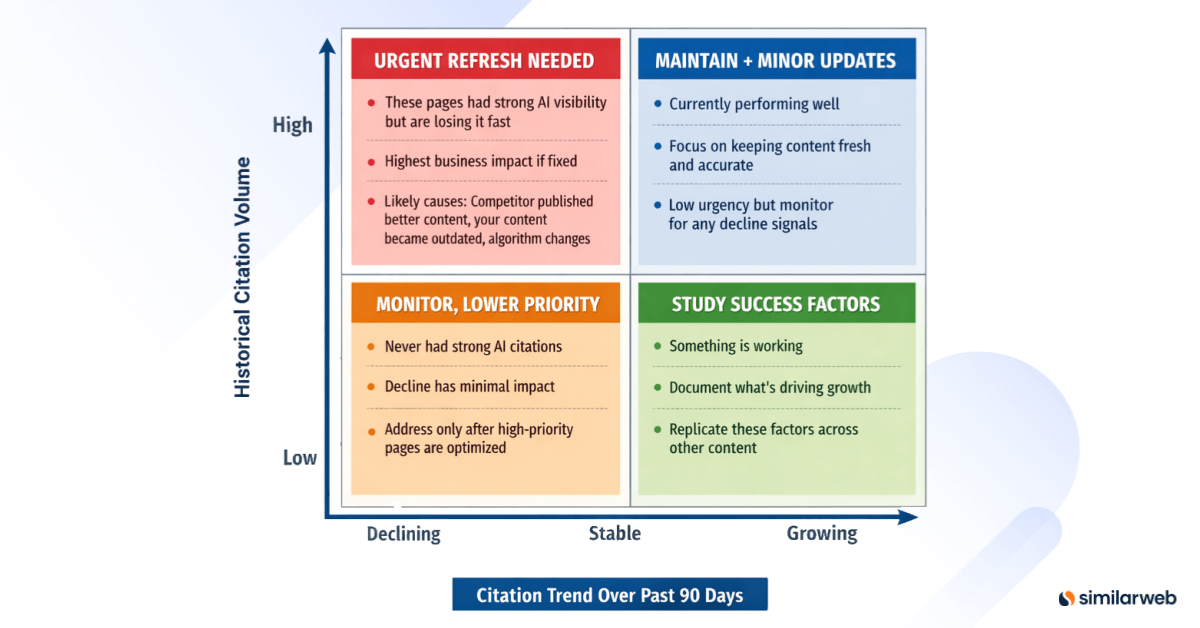
Create a 2×2 matrix: – Y-axis: Historical citation volume (High, Medium, Low) – X-axis: Citation trend over past 90 days (Declining, Stable, Growing)
Tracking methodology:
Track citation counts weekly over an 8-12 week rolling window. Calculate citation velocity:
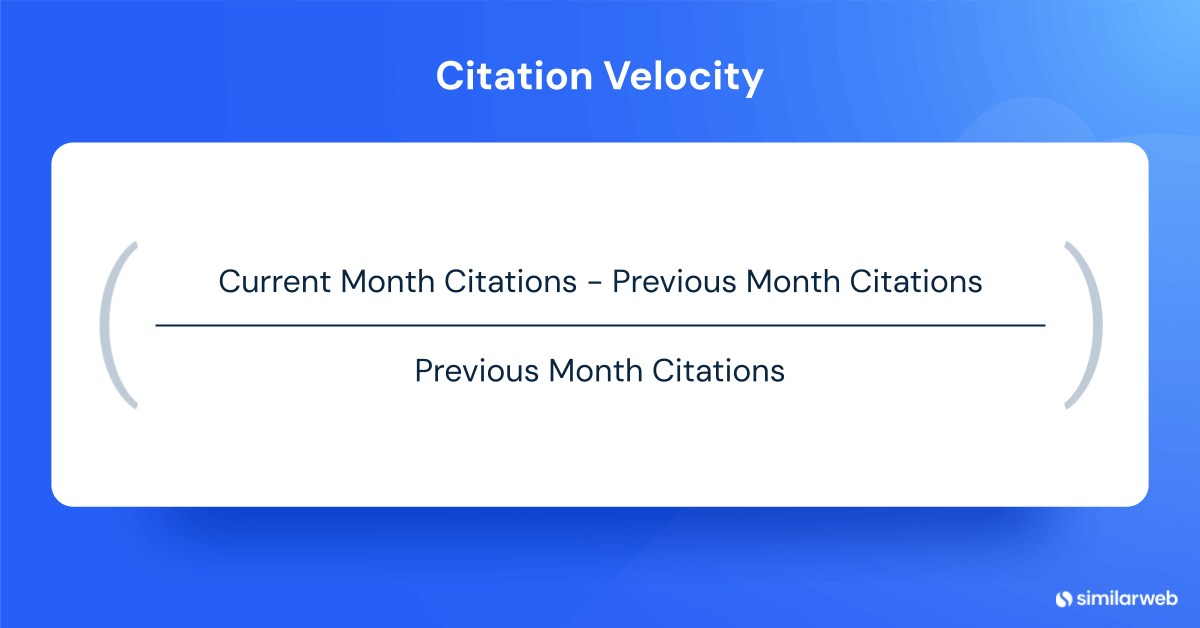
Citation Velocity = (Current Month Citations – Previous Month Citations) / Previous Month Citations
Flag pages with negative velocity greater than 15% as “citation decay.”
Example citation velocity analysis:
December: 145 citations
January: 89 citations (-39% vs. Dec)
February: 34 citations (-62% vs. Jan)
Overall trend: -77% decline over 3 months
Priority: URGENT – High historical volume with severe decline
Potential causes for investigation:
- A competitor published a more comprehensive guide (check manually)
- Content became technically outdated
- AI systems found better-structured sources (competitor has better FAQ schema, clearer tables)
- Freshness penalty (last updated 14 months ago)
- Entity ambiguity (conflicting information about OAuth implementations)
Refresh protocol for priority pages:
Phase 1: Competitive audit
- Manually query your topic in Copilot and ChatGPT
- Identify which competitors are cited (especially those that displaced you)
- Review competitor content structure, depth, and recency
- Note specific elements they have that you lack (tables, FAQs, code examples, data)
Phase 2: Content update
- Add current data, examples, and screenshots
- Update any outdated technical information
- Revise sections that are no longer accurate
- Add new developments or changes in the topic since the last update
Phase 3: Structural enhancement
- Add missing tables summarizing key information
- Implement or expand FAQ sections
- Add code examples if applicable
- Improve heading structure for better scannability
- Add schema markup if missing
Phase 4: Evidence strengthening
- Cite current authoritative sources
- Add specific data points and statistics
- Include expert quotes or references
- Provide concrete examples from 2025-2026
Phase 5: Resubmission
- Update the publish date to the current date
- Submit URL via IndexNow for expedited crawl
- Update internal links if the topic focus shifted
Phase 6: Monitor recovery
- Track citations weekly for 6-8 weeks
- Document what you changed (for replication if successful)
- If citations recover, apply a similar refresh to other declining pages
- If citations don’t recover, investigate further (competitor dominance, topic saturation)
Red flag signals requiring immediate attention:
- Sudden drops (>30% month-over-month): Likely competitor displacement or significant content quality issue
- Gradual decline over 3+ months: Content aging, freshness signals degrading, or slow competitive erosion
- Dropped to zero citations: Check for indexation issues, robots.txt blocks, technical problems, or complete AI exclusion
Success metrics: Citation recovery to 80%+ of peak within 8 weeks of refresh indicates successful optimization.
5. Find indexed-but-not-cited pages
What Bing shows: Page-level citation data revealing which indexed pages get zero citations from Microsoft’s AI systems.
Compare Bing’s cited pages against your indexed pages to identify content Microsoft AI ignores.
Simple check:
- Note which pages show citations in Bing’s dashboard
- Compare to your site’s total indexed pages
- Identify pages with zero Bing citations
Example: You have 347 indexed pages, but only 52 show citation activity in Bing = 295 pages that Microsoft’s AI systems ignore.
Common reasons for zero citations:
- No clear heading structure (walls of text)
- Missing data tables or FAQ sections
- Thin content (under 800 words)
- Outdated information (18+ months old)
- No schema markup (FAQ, HowTo, Article)
- Poor readability (complex sentences, jargon-heavy)
- No code examples (for technical content)
Quick diagnosis: Pick 5 zero-citation pages and check:
- Do they have H2/H3 headings?
- Do they include tables or structured data?
- Are they over 1,000 words?
- Have they been updated in the past year?
- Do they have an FAQ or a HowTo schema?
The limitation: This only shows which pages BING doesn’t cite. Massive blind spots:
- You don’t know which pages ChatGPT/Perplexity DO cite
- Can’t see why competitors get cited for topics you don’t
- No cross-platform citation pattern analysis
- No prioritization framework (which zero-citation pages matter most?)
Optimization priority: Start with high-traffic zero-citation pages. If a page gets 5,000 monthly organic visits but has zero AI citations, it shows strong topic relevance but lacks a citation-worthy structure. These pages offer the fastest optimization wins.
Action plan: Don’t create new content until you’ve optimized existing indexed but not cited pages. Adding structure to existing content is faster than building new authority from scratch.
The data gaps Bing doesn’t cover (And Similarweb does)
Bing’s AI Performance tool is a genuine breakthrough. It is the first time a major search engine has provided publishers with dedicated AI performance analytics.
However, it’s incomplete by design. These aren’t minor omissions. There are fundamental gaps that prevent you from measuring whether AI visibility actually matters for your business.
Let me be specific about what’s missing and how Similarweb fills these gaps.
I’m not being promotional here – I’m being practical. At Similarweb, we built these capabilities specifically because SEOs kept asking us questions that Bing’s data simply can’t answer.
Gap #1: No click or traffic data from AI citations
The problem: Bing shows you citations but not the downstream traffic, conversions, or revenue those citations generate.
You’ll see that AI systems cited you 2,450 times last month. Great. But how many people actually clicked through to your site? How many converted? How much revenue did AI citations drive? Bing doesn’t tell you.
Why this matters: Citations are a visibility metric, not a business outcome.
I’ve sat through this conversation more times than I’d like to admit:
- You: “We increased AI citations 147% quarter-over-quarter!”
- CMO: “Excellent. How much revenue did that generate?”
- You: “Well, Bing doesn’t track that…”
- CMO: “Then why are we investing resources in this?”
- You: “…”
Without traffic and conversion data, you can’t prove ROI. You can’t prioritize GEO investments against other marketing initiatives. You can’t even determine if AI citations have business value at all.
How Similarweb solves it:
For a complete guide on measuring and increasing AI-driven traffic, see our article on getting traffic from AI.
Similarweb provides traffic attribution from AI engines (actual visit data from ChatGPT, Perplexity, Gemini, and yes, Copilot). You’ll see:
- Referral traffic by AI platform: How many visits came from each AI engine
- Traffic trends over time: Is AI-referred traffic growing or declining?
- Engagement metrics: Bounce rate, pages per session, time on site from AI referrals
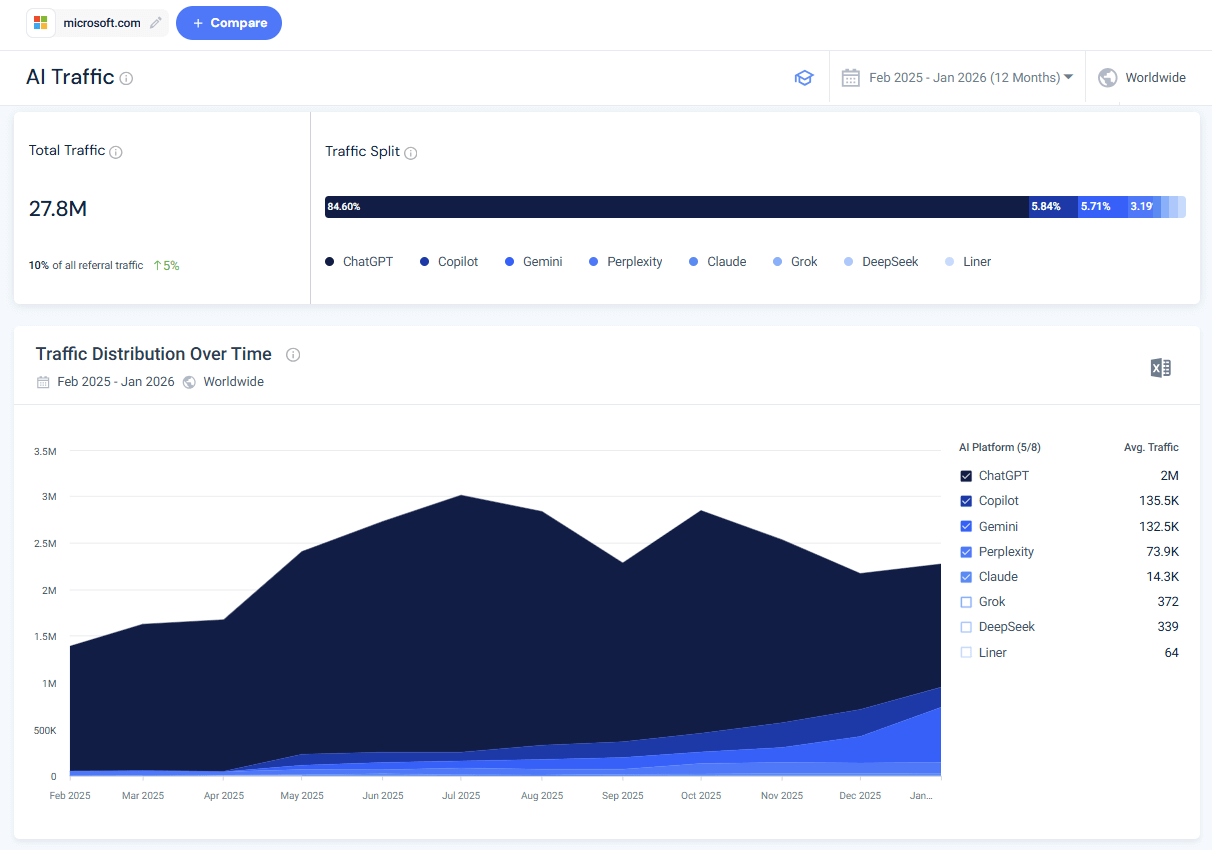
For example, here’s the AI traffic trend to microsoft.com:
Example use case:
- Bing AI Performance shows: 890 citations from Microsoft Copilot last month
- Similarweb shows:
- ChatGPT: 12,400 visits
- Perplexity: 3,200 visits
- Copilot: 1,100 visits
- Gemini: 890 visits
Insight: Your Bing citations represent about 6% of your total AI-referred traffic. ChatGPT drives 11x more traffic despite not being tracked in Bing AI Performance. You’re optimizing for the wrong platform.
Strategic application:
With Similarweb’s traffic data, you can:
- Calculate actual ROI of GEO investments (revenue per AI-referred visit)
- Identify which AI platforms drive qualified traffic (high engagement, low bounce)
- Prioritize optimization for platforms that drive traffic, not just citations
- Prove GEO value to stakeholders with conversion and revenue metrics
- Understand the relationship between citations and traffic (sometimes it’s not linear)
The complete picture requires: Mentions + Citations + Traffic + Conversions
Gap #2: No cross-platform AI performance visibility
The problem: Bing AI Performance only tracks Microsoft’s ecosystem-Copilot, Bing Chat, and unnamed “select partners.”
What’s missing?
Pretty much everything else:
- ChatGPT
- Perplexity
- Google AI Mode / AI Overviews
- Gemini
- Claude
- DeepSeek
- Future AI platforms that don’t exist yet
Why this matters: Microsoft’s AI market share is in the single digits. By focusing only on Bing’s ecosystem, you’re measuring a small minority of the total AI visibility opportunity.
According to Similarweb’s AI landscape research and Pew Research Center data:
- ChatGPT processes substantial query volume at scale
- Perplexity has shown aggressive growth in the search market share
- Google AI Overviews appear in the majority of searches
- Combined, non-Microsoft AI platforms likely drive 10-20x the volume of Microsoft platforms
The strategic blind spot: Optimizing exclusively for Bing citations is like optimizing only for Bing search in 2010 and ignoring Google because “search is search.” The platform matters enormously.
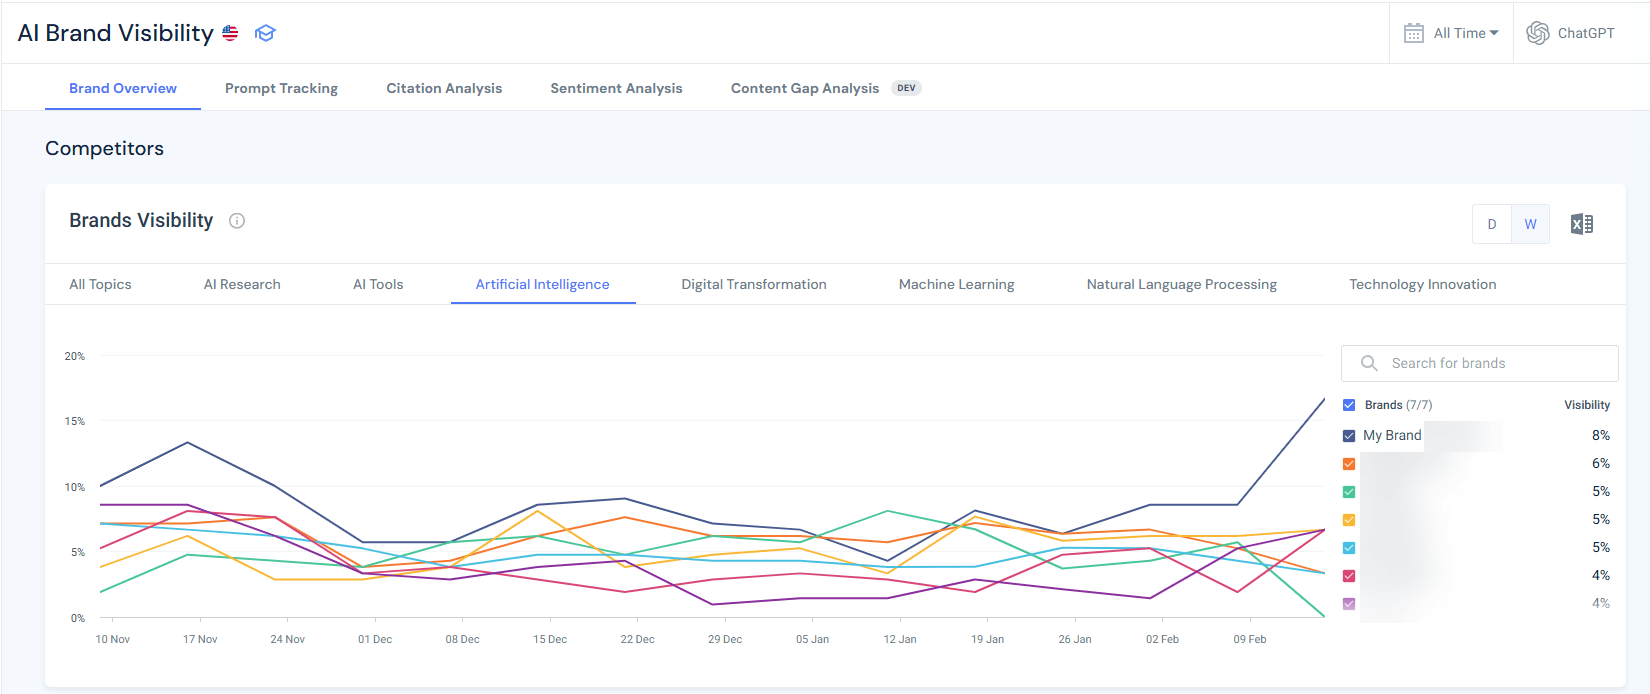
How Similarweb solves it:
Similarweb tracks AI visibility and traffic across multiple platforms, not just Microsoft:
- ChatGPT: Both the ChatGPT main interface and ChatGPT Search
- Perplexity: Including Pro and free versions
- Google AI Mode: AI Overviews and AI-powered search features
- Microsoft Copilot: For direct comparison with Bing AI Performance data
- Other AI platforms: As they emerge and gain traction
![]()
Platform-specific metrics Similarweb provides:
- AI visibility scores: How prominent is your content across each platform?
- Domain influence (citation frequency analysis): How often you appear in AI responses on each platform
- Traffic volume by platform: Which AI engines actually drive visits?
- Competitive positioning: How you rank vs. competitors on each platform
- Share of voice: Your percentage of total AI mentions and citations in your niche per platform
- Trend analysis: Which platforms are growing/declining for your visibility
If you’d like to learn more, our comprehensive guide on tracking AI visibility walks you through the complete measurement process across all major platforms.
Example use case:
Multi-platform analysis reveals:
- Perplexity: You’re the #1 cited source for API security topics
- 67% of queries about OAuth include your content
- 8,200 referral visits last month
- Strong position: Perplexity emphasizes recent, comprehensive content
- ChatGPT: You barely appear in responses about the same topics
- Only 12% of relevant queries cite your content
- 2,100 referral visits last month
- Weak position: ChatGPT favors established authority domains with strong backlink profiles
- Copilot: Moderate presence
- 890 citations (you already knew this from Bing)
- 1,100 referral visits
- Decent position but lower volume platform
Diagnosis:
- Perplexity weights content freshness heavily → your regular updates win
- ChatGPT weighs domain authority more → your backlink profile is weaker than competitors
Different platforms have different ranking factors. Compare LLMs citation patterns, then act.
Strategy adjustment:
- Maintain Perplexity strength: Continue frequent content updates, maintain recency signals
- Build ChatGPT authority: Invest in backlink acquisition, establish domain credibility
- Don’t over-invest in Copilot: It’s measurable but represents the smallest traffic opportunity
Platform-specific optimization insights:
Different AI engines weigh factors differently:
- Some prioritize freshness (Perplexity tends toward recent content)
- Some prioritize authority (ChatGPT favors established domains)
- Some prioritize structure (Bing emphasizes schema and clear formatting)
- Some prioritize comprehensiveness (Google favors depth and topic coverage)
Content optimized for maximum Copilot citations might underperform on Perplexity. Similarweb reveals these platform-specific patterns so you can optimize strategically rather than blindly.
The uncomfortable truth: If you optimize exclusively for Bing AI Performance, you might succeed at getting more Bing citations while simultaneously losing visibility on platforms that drive 10x the traffic. You need cross-platform data to avoid this trap.
Gap #3: No competitive intelligence
The problem: Bing shows only YOUR citation data. You have zero visibility into how competitors perform.
As I tell my team, this is like running a race blindfolded. You know you ran 2,450 meters, but you don’t know if that’s enough to win, places you in the middle of the pack, or leaves you dead last.
Critical questions you cannot answer with Bing alone:
- Are my 2,450 citations a good performance for my niche?
- How do my citations compare to competitor volumes?
- What’s my citation share in my market?
- Who dominates AI visibility for my target topics?
- Am I gaining or losing citation share over time?
- What content strategies are competitors using successfully?
- Which topics do competitors own that I’m missing?
The “no context” problem:
“2,450 citations last month” is a number without meaning. It could indicate:
- Scenario A: You’re the dominant #1 player (if competitors average 400 citations)
- Scenario B: You’re barely relevant (if competitors average 12,000 citations)
- Scenario C: You’re middle-of-the-pack (if competitors range 1,500-3,500)
Bing doesn’t tell you which scenario you’re in.
How Similarweb solves it:
This is one of the core capabilities we built at Similarweb specifically for this gap. We knew publishers needed competitive context, not just their own metrics.
Similarweb provides competitive AI visibility benchmarking, so you can perform AI citation gap analysis and measure your performance in context:
- Competitive citation analysis: Your citations vs. competitor citations
- Citation share metrics: Your percentage of total citations in your competitive set
- Competitive leaderboard: Rank competitors by AI visibility
- Topic-level competitive intelligence: Who dominates which specific topics
- Historical competitive trends: Are you gaining or losing ground over time?
- Content gap identification: Topics competitors get cited for that you don’t
- Format analysis: What content types competitors use successfully
Example use case:
Bing AI Performance shows that your site has 2,450 citations for enterprise SaaS security topics.
Similarweb AI Search Intelligence shows you:
- Competitor A: 8,300 citations (34% share)
- Competitor B: 6,100 citations (25% share)
- Your site: 2,450 citations (10% share) → #3 position
- Competitor C: 2,200 citations (9% share)
- Competitor D: 1,850 citations (8% share)
- Long tail: 3,600 citations (15% share) across 50+ other sites
- Total market: ~24,500 monthly citations across competitive set
Strategic insights from this data:
- You’re in the conversation: 10% share puts you in the top 3, so you have a meaningful presence
- Significant gap to leaders: Competitor A has 3.4x your citations despite you having similar organic rankings
- Vulnerable position: Only 250 citations ahead of #4. Losing ground would drop you out of top 3
- Market concentration: Top 3 players control 69% of citations, this is a concentrated market
Diagnosis questions to investigate:
- What do Competitors A and B have that you lack? (Better content structure? More comprehensive coverage? Stronger authority signals?)
- Why is your domain authority similar in traditional search but weaker in AI citations?
- Are there specific topics within “enterprise SaaS security” where competitors dominate?
Strategic applications of competitive intelligence:
- Budget allocation: Invest in topics where you can realistically compete, not where competitors have insurmountable leads
- Differentiation strategy: Identify topics competitors ignore, where you can dominate
- Defensive positioning: Monitor competitors gaining share rapidly, respond before they overtake you
- Acquisition targets: Identify competitors with strong AI visibility for potential acquisition
- Benchmark goals: Set realistic targets based on the competitive landscape, not arbitrary growth percentages
The critical insight: You cannot build an effective GEO strategy without understanding the competitive landscape. Similarweb transforms Bing’s single-player metrics into multi-player competitive intelligence.
Gap #4: No sentiment or citation quality analysis
The problem: Bing treats all citations equally. One citation = one citation, regardless of context, prominence, or sentiment.
In reality, citation context dramatically affects value:
- Positive authority framing: “According to the definitive guide by AuthorityBrand…”
- Neutral mention: “Sources including AuthorityBrand note that…”
- Questioning framing: “Some sources like AuthorityBrand claim…”
- Negative citation: “However, AuthorityBrand incorrectly states…”
- Footnote reference: “[15 sources listed including AuthorityBrand]”
All five examples above count as exactly one citation each in Bing AI Performance.
Why this matters:
Scenario A: High citations + negative sentiment = reputational damage
Your outdated content is cited frequently, but with qualifying phrases like “no longer recommended” or “outdated approach”. You’re visible but undermining your authority (brand damage compounds over time).
Scenario B: High citations + supplementary mentions = visibility without authority
You’re listed among 10 other sources consistently, you have presence but not prominence. Traffic potential is low because users don’t associate you with expertise.
Scenario C: Low citations + primary source framing = quality over quantity
Fewer citations, but you’re consistently framed as the authoritative expert. You have strong brand positioning, and get more traffic per citation because of the authority halo.
Bing can’t distinguish between these scenarios.
You might see 347 citations for a page and think it’s performing excellently when actually 40% of those citations include negative framing that damages your brand.
How Similarweb solves it:
Similarweb provides sentiment analysis for citations and mentions in AI:
- Citation sentiment classification: Positive, neutral, negative context for each citation
- Citation prominence scoring: Primary source vs. supplementary mention vs. footnote
- Brand mention context analysis: How your brand is framed within AI responses
- Authority signal detection: Are you cited as an expert, a generic example, or a questioned source?
- Sentiment trends over time: Is your brand sentiment improving or degrading?
- Quality-weighted citation metrics: Total citations adjusted for sentiment and prominence
Learn more about how to perform sentiment analysis in our dedicated guide.
Example use case:
Your /api-security-guide page has 347 citations in Bing AI Performance (the top-performing URL on your site). Looks great.
Similarweb sentiment analysis shows: 89 positive citations (26%), 203 neutral citations (59%), and 55 negative citations (16%)
16% negative sentiment is a red flag. Your high citation volume is partially undermining your authority.
Deep dive investigation:
You review sample negative citations and find common themes:
- Multiple references to “outdated OAuth 2.0 implementation” (your guide hasn’t been updated for OAuth 2.1)
- Criticism of security recommendations that are “no longer considered best practice.”
- Comparisons to competitor guides that include “more current 2025-2026 examples.”
Diagnosis: Content became technically outdated. AI systems still cite you (high citation count) but increasingly with negative framing (degrading sentiment).
Action required: Urgent content refresh, not optimization for more citations. You don’t need more visibility, you need to fix the quality issues causing negative sentiment.
Strategic applications of sentiment analysis:
- Reputation monitoring: Detect negative citation sentiment early, before brand damage compounds
- Content audit prioritization: Pages with negative sentiment need immediate updates, even if citation volume is high
- Quality vs. quantity decisions: Sometimes, fewer citations with positive sentiment are better than many citations with neutral/negative sentiment
- Competitive positioning: Compare your sentiment scores to competitors’ to understand relative brand strength
- Stakeholder reporting: Show CMO that citation quality (sentiment + prominence) matters as much as citation quantity
The strategic shift: Stop optimizing for maximum citations. Start optimizing for maximum high-quality, positive-sentiment, primary-source citations.
Similarweb’s sentiment analytics transforms Bing’s quantity metrics into quality-adjusted performance measurement.
Gap #5: No topic cluster visualization
The problem: Bing displays grounding queries as a linear list. You can’t see topical relationships, semantic connections, or authority distribution patterns.
When you export 200 grounding queries from Bing, you get an alphabetical or chronological list. You can manually read through, trying to identify patterns, but there’s no visualization of:
- Which topic clusters do you dominate
- Which topic clusters are you weak in
- How AI systems semantically group your content
- Topic authority distribution (concentrated vs. distributed)
Why this matters: Strategic content decisions require understanding topical authority at scale. You can’t manually analyze 200+ grounding queries and identify strategic patterns.
Strategic blind spots without topic clustering:
- Authority concentration: Are citations concentrated in 2-3 topics or distributed across 15+ topics?
- Competitive gaps: Are there major topic clusters where competitors dominate but you’re absent?
- Content cluster opportunities: Are there semantic relationships between grounding queries that suggest content cluster opportunities?
- Topical authority evolution: How is your topic coverage changing over time?
- Semantic bridges: How does AI connect related concepts in your content?
How Similarweb solves it:
This is one of my favorite Similarweb features because it transforms unusable lists into strategic territory maps.
Similarweb provides visual topic cluster mapping and semantic analysis:
- Automated topic clustering: AI groups grounding queries into semantic topic clusters
- Visual cluster mapping: See your citation authority organized by topic in an interactive visualization
- Authority distribution metrics: Understand concentration vs. distribution of topical coverage
- Competitive topic overlay: Compare your topic clusters against competitors’
- Semantic relationship graphs: Visualize how AI systems connect related concepts
- Cluster evolution tracking: Watch topical authority changes over time
- Gap analysis: Identify clusters where competitors dominate, but you’re weak
For step-by-step instructions on how this analysis works, see our AI citation analysis guide.
Strategic applications of topic clustering:
- Content roadmap planning: Build clusters where you have adjacent strengths and competitor demand signals
- Competitive defense: Shore up declining clusters before erosion accelerates
- Resource allocation: Focus on high-opportunity clusters rather than trying to expand everywhere
- Content cluster architecture: Use semantic bridges to build internal linking strategies connecting related clusters
- Executive communication: Visual cluster maps are far more effective for stakeholder communication than lists of grounding queries
The strategic shift: Stop thinking in individual keywords or queries. Think in topic clusters and semantic authority territories. Similarweb’s clustering turns Bing’s linear query list into strategic territory maps.
Gap #6: Limited historical data
The problem: As a public preview feature, AI Performance has limited historical data (30-90 days maximum). You can’t conduct meaningful trend analysis, identify seasonal patterns, or measure long-term strategic success.
Why this matters:
- Trend vs. noise: Is a 40% citation increase a sustainable trend or temporary variance? You need 6-12+ months of data to distinguish signal from noise.
- Seasonal patterns: Do your citations spike in Q4 and drop in Q1? You can’t know with only 90 days of data.
- Long-term strategy validation: Did your 12-month GEO investment pay off? You need 18+ months of data (12 months pre-investment + 6 months post) to measure impact.
- Algorithm change correlation: Did Microsoft change how Copilot selects sources in October 2025? Without historical data, you can’t correlate citation changes with platform changes.
- Competitive evolution: Are competitors gaining ground slowly over 18 months? Short-term data misses gradual competitive shifts.
The “short memory” problem:
With only 30-90 days of data:
- You can’t identify year-over-year growth
- You can’t detect quarterly seasonal patterns
- You can’t measure sustained optimization impact
- You can’t separate temporary spikes from lasting improvements
- You can’t benchmark against the pre-GEO investment baseline (if you started optimizing 9 months ago)
How Similarweb solves it:
Similarweb provides longer-term historical AI citation and visibility data:
![]()
- Extended historical tracking: Data going back 12-24+ months
- Year-over-year comparisons: Compare current performance to the same period last year
- Seasonal pattern identification: Detect cyclical trends across multiple years
- Long-term trend analysis: Distinguish sustained growth from temporary spikes
- Algorithm change correlation: Connect citation changes to platform updates or market events
- Multi-year competitive evolution: Track how the competitive landscape shifted over time
Example use case:
Historical citation analysis shows patterns that are invisible in Bing’s 90-day window:
Q1 2024: 890 citations
Q2 2024: 1,150 citations (+29%)
Q3 2024: 1,680 citations (+46%)
Q4 2024: 3,140 citations (+87%) ← Spike!
Q1 2025: 1,190 citations (-62%) ← Crash!
Q2 2025: 1,580 citations (+33%)
Q3 2025: 2,340 citations (+48%)
Q4 2025: 4,250 citations (+82%) ← Spike!
Q1 2026: 1,650 citations (-61%) ← Crash!
Pattern identified: Your AI citations spike dramatically every Q4 (October-December), then crash in Q1 (January-March).
Seasonal diagnosis: Investigate Q4 spike topics.
Insight: Your content is highly relevant for year-end planning, annual reviews, and Q4 budget decisions. Citations naturally spike during annual security assessments.
Strategic implications:
- Content calendar planning: Publish comprehensive annual guides in September to capture Q4 spike (not in January when it’s too late)
- Resource allocation: Expect 60% citation drop in Q1 as seasonal, don’t panic, and over-invest in Q1 recovery
- Year-over-year growth measurement: Compare Q4 2025 (4,250 citations) to Q4 2024 (3,140 citations) = +35% YoY growth (that’s the real growth trend, not the -61% Q1 drop)
- Competitive timing: If competitors don’t recognize the seasonal pattern, you can gain share by publishing earlier in Q3 while they’re dormant
Without historical data, you might misinterpret:
- January’s -61% drop as failed optimization (it’s seasonal)
- December’s spike as successful new strategy (it’s seasonal)
- March’s +30% recovery as proof of new tactics (it’s seasonal reversion)
Strategic applications of historical data:
- Seasonal planning: Align content production and optimization timing with seasonal demand patterns
- Investment validation: Prove GEO budget investments paid off with 12-18 month pre/post analysis
- Competitive intelligence: Track gradual competitive shifts that compound over time
- Algorithm adaptation: Quickly identify when platform changes affect your visibility
- Stakeholder reporting: Show sustained long-term growth rather than volatile short-term fluctuations
- Strategic patience: Recognize that GEO is a long-term investment (12-18 months to see impact)
The uncomfortable reality: Without 18+ months of data, you’re making strategic decisions based on incomplete information. Similarweb’s historical data provides the context that Bing’s public preview can’t yet offer.
Gap #7: No API access for automation
During public preview, there’s no API access to AI Performance data. Fabrice Canel from Microsoft confirmed on X that “enabling data in our API is on our backlog,” but provided no timeline.
Impact: You can’t automate reporting, integrate with other analytics tools, or build custom dashboards. Everything is manual.
How Similarweb solves it:
Similarweb provides an MCP server and full API access to AI Search Intelligence data, enabling automated reporting, analytics integration, and scalable measurement infrastructure.
API capabilities:
- Automated data extraction: Pull AI visibility metrics programmatically on any schedule (daily, weekly, monthly)
- Multi-platform aggregation: Single API call returns unified data across ChatGPT, Perplexity, Google AI Mode, Gemini, and Copilot
- Custom dashboard integration: Feed data into Looker Studio, Tableau, Power BI, or internal BI platforms
- Alerting and monitoring: Set automated alerts for citation drops, competitive shifts, or sentiment changes
- Historical data access: Programmatic access to 12-24+ months of trend data for longitudinal analysis
- Competitive intelligence automation: Automated competitor tracking without manual checking
- Data warehouse integration: Export to BigQuery, Snowflake, Redshift for advanced analysis and modeling
Example enterprise MCP/API integration:
Weekly Automated GEO Report Pipeline:
Monday 12:00 AM:
- Similarweb API pulls AI visibility data (all platforms)
- Citation counts, traffic attribution, sentiment scores, and competitive share
- Automated comparison to the previous week and month
Monday 12:30 AM:
- Data joined with 1st party traffic data via API
- Combined with CRM conversion data
- AI attribution calculated automatically
Monday 1:00 AM:
- Executive dashboard updates in Looker Studio
- Stakeholder email sent with key insights and alerts
- No human intervention required
Integration use cases:
- Executive dashboards: Weekly automated reports combining Similarweb AI data, web AI traffic, and revenue attribution. Stakeholders see updated metrics every Monday morning without manual work.
- Competitive monitoring: Daily automated checks of competitor citation share across 10-20 competitor domains. Alerts trigger when competitors gain 10%+ share in target topics.
- Attribution modeling:
- Connect AI citations (Similarweb) → traffic (Similarweb/GA4) → conversions (CRM) → revenue.
- Calculate AI-attributed revenue automatically. Build multi-touch models that include AI visibility as a channel.
- Content prioritization:
- Automated analysis identifying which content gaps cost you the most citations relative to competitors.
- Prioritized content calendar generated weekly based on opportunity scores.
- ROI forecasting: Historical API data feeds predictive models estimating citation lift from content investments. Forecast revenue impact before committing resources.
Strategic applications of API access:
- Replace manual reporting: Eliminate 5-10 hours weekly spent on data export, spreadsheet manipulation, and slide deck creation. API-driven dashboards update automatically.
- Enable sophisticated analysis: Run correlation analysis between AI citations and business metrics. Build regression models predicting which content types drive the highest conversion rates. Identify causal relationships vs. correlations.
- Scale monitoring: Track 50+ competitor domains simultaneously across all AI platforms. Monitor 200+ target keywords without manual checking. Automated competitive intelligence at scale.
- React faster: Automated alerts mean you detect competitive threats or algorithm changes within hours. Quick response preserves market position.
- Prove ROI systematically:
- Clean data pipelines connecting AI visibility → traffic → conversions → revenue.
- Calculate cost-per-citation, revenue-per-citation, and ROI for GEO investments.
- Build business cases with automated data collection.
The automation gap at scale:
Scenario: You manage 15 brand sites across 8 markets.
Bing’s manual approach:
- Log in to Bing Webmaster Tools 15 times
- Export data for each site manually
- Copy into spreadsheet
- Calculate trends manually
- Create charts manually
- Build the presentation manually
- Time required: 12-15 hours weekly
Similarweb’s API approach:
- One API call pulls all 15 sites across all platforms
- Data flows automatically into dashboards
- Trends calculated programmatically
- Alerts trigger automatically
- Reports are generated on schedule
- Time required: 30 minutes weekly (reviewing automated outputs)
The uncomfortable reality: At enterprise scale, Bing’s manual-only dashboard doesn’t scale.
Managing multiple sites, brands, or markets requires automation. Similarweb’s MCP server and API turn GEO measurement from unsustainable manual labor into a scalable intelligence infrastructure.
Gap # 8: Grounding Queries are sampled
Microsoft explicitly states that grounding queries represent “a sample of overall citation activity.” They haven’t disclosed what percentage of queries are shown or how complete the sample is.
This introduces risk: You might optimize based on incomplete query data and miss important grounding phrases that don’t appear in your sample.
How Similarweb solves it:
Similarweb provides comprehensive query and prompt analysis across all AI platforms.
What comprehensive prompts and query data includes:
- Complete prompt inventory: All prompts driving AI citations to your content across platforms
- Intent classification: Every query is categorized as informational, commercial, transactional, or navigational
- Topic clustering: Queries and prompts are organized into semantic groups, revealing content cluster structure
- Competitive coverage: Which prompts competitors capture that you don’t
- Gap identification: High-value queries in your niche where you have zero visibility
- Trend analysis: Which topics and prompts are growing/declining in citation activity over time
- Platform-specific prompt differences: Different prompts drive citations on ChatGPT vs. Perplexity vs. Google
Strategic implications:
- Query prioritization distortion: Bing’s sample might show low-value queries while hiding high-value opportunities. Optimizing based on samples wastes resources on wrong queries.
- Platform-blind optimization: The query you’re optimizing for might appear in Bing’s sample, but Similarweb shows this query drives 10x more citations on ChatGPT than Copilot. Without complete data, you’d over-invest in Copilot optimization.
- Competitive blind spots: Comprehensive data reveals that competitors dominate 23 high-volume queries you’re completely missing. Bing’s sample shows none of these gaps.
- Intent misallocation: The complete query data shows 58% informational and 11% transactional. If Bing’s sample over-represents transactional queries, you’d misallocate content production toward the wrong intent types.
Strategic applications of non-sampled data:
- True coverage measurement: Calculate your actual coverage rate. Bing’s sample hides this complete picture.
- Platform-specific strategy: Different platforms favor different queries. Optimize content for platform-specific patterns using complete data, not a sample.
- ChatGPT: comprehensive “how to” queries.
- Perplexity: specific technical implementation queries.
- Google: definitional and best practice queries.
- Copilot: enterprise-focused variations.
- Competitive displacement targeting:
- Identify topics where competitors are vulnerable.
- Build superior content targeting that topic’s specific prompts.
- Track month-over-month progress in displacing competitors with complete visibility.
- Topic cluster gap analysis: Complete prompt data reveals topic clusters and helps you better prioritize investments by topic, based on your strengths and weaknesses relative to your competitors.
- Intent-based content calendar:
- Your intent analysis shows: 203 informational, 92 commercial, 38 transactional queries.
- Your content distribution is: 60% informational, 15% commercial, 25% transactional.
- Conclusion: You’re over-producing informational content and under-producing commercial comparison content.
- Action: Rebalance content mix to match actual query intent distribution for maximum citation capture.
The sampling risk in action:
Example scenario: Competitor analyzed Bing’s sample (12 queries), saw “API security best practices” mentioned, invested $50K in comprehensive content targeting that phrase.
Similarweb shows that the prompt drives only 34 citations/month across all platforms. Meanwhile, “API security implementation checklist” drives 340 citations/month (10x more opportunity), and the competitor had zero visibility there.
Outcome: Competitor optimized for low-value query based on incomplete sample. You used comprehensive data, captured a high-value query, and gained 340 monthly citations, while the competitor gained 34. Market share shifted in your favor because you had complete information.
The uncomfortable truth: Sampling creates false confidence. You think you understand the query landscape because Bing showed you 12 queries. In reality, you’re seeing 3-5% of the total opportunity and making strategic decisions based on potentially unrepresentative samples.
Similarweb’s comprehensive prompt analytics eliminates that risk and reveals the complete opportunity space for accurate prioritization.
Now let’s see all features and gaps side by side:
Tracking AI performance: Bing vs. Google vs. Similarweb
Now that you understand all seven gaps, here’s how the three platforms stack up against each other. This is the honest assessment of what each tool provides:
| Feature | Bing AI Performance | Google Search Console | Similarweb |
|---|---|---|---|
| Dedicated AI dashboard | ✅ Yes – separate section | ❌ No – mixed with standard performance | ✅ Yes – Gen AI Intelligence suite |
| Citation-style tracking | ✅ Yes – counts by URL | ❌ No – only impressions/clicks | ✅ Yes – citation frequency + prominence |
| Grounding queries | ✅ Yes – sample provided | ❌ No | ✅ Yes – full query analysis |
| Page-level AI metrics | ✅ Yes – citations per URL | ⚠️ Limited – AI impressions aggregated | ✅ Yes – URL-level citations |
| Trend visualization | ✅ Yes – dedicated timeline | ⚠️ Partial – within standard reports | ✅ Yes – historical trends |
| AI surfaces covered | Microsoft ecosystem only | Google AI Overviews only | ChatGPT, Perplexity, Gemini, Copilot, Google |
| Click data from AI | ❌ No | ✅ Yes – AI Overview clicks tracked | ✅ Yes – traffic by AI platform |
| API access | ❌ Not yet | ✅ Yes – via standard API | ✅ Yes – full API access |
| Competitive intelligence | ❌ No | ❌ No | ✅ Yes – competitor benchmarking |
| Citation sentiment | ❌ No | ❌ No | ✅ Yes – positive/neutral/negative |
| Citation prominence | ❌ No | ❌ No | ✅ Yes – primary vs supplementary |
| Intent classification | ❌ No | ❌ No | ✅ Yes |
| Topic clustering | ❌ No | ❌ No | ✅ Yes – visual cluster maps |
| Historical data | ⚠️ Limited (90 days) | ✅ Yes (16 months) | ✅ Yes (12-36+ months) |
| Cross-platform view | ❌ No | ❌ No | ✅ Yes – unified dashboard |
| Traffic attribution | ❌ No | ✅ Yes (Google only) | ✅ Yes – all AI platforms |
| Cost | Free | Free | Free Trial, 99$/month after |
Conclusion: The first first-party GEO tool, and why it’s still not enough
I’ll give Microsoft credit for shipping what Google hasn’t: dedicated AI citation analytics. The AI Performance dashboard in Bing Webmaster Tools is the first time any major platform has acknowledged that AI visibility needs first-class measurement infrastructure.
What’s still missing (and as someone working in this space daily, I notice these gaps constantly):
- No click or traffic data from AI citations
- Microsoft ecosystem only (missing 90%+ of AI visibility)
- No competitive intelligence whatsoever
- Limited historical data for trend analysis
- No sentiment or quality analysis
- No API access yet
Bing AI Performance gives you visibility into what AI systems are doing with your content. But it can’t tell you if that matters for your business.
That’s where Similarweb becomes essential. Similarweb shows you:
- Whether citations actually drive traffic
- How do you compare to competitors
- Whether your AI visibility translates to revenue
- Which platforms matter most for YOUR business
- What topics should you invest in strategically
Similarweb’s AI optimization tools are becoming critical for strategic positioning: Measure cross-platform performance, benchmark against competitors, prove ROI to stakeholders, and identify opportunity gaps.
Use Bing for an added layer of tactical optimization: Discover new queries, validate page-level improvements, and track Microsoft ecosystem citations.
The future of search is increasingly AI-mediated. The tools to measure and optimize for that future are available.
Don’t theorize. Measure.
FAQ
What is Bing AI Performance in Webmaster Tools?
Bing AI Performance is a dedicated dashboard in Bing Webmaster Tools that shows how often your content is cited in AI-generated answers across Microsoft Copilot, Bing Chat, and partner integrations.
It tracks 5 core metrics: total citations, average cited pages, grounding queries, page-level citation activity, and visibility trends, providing the first measurable data for Generative Engine Optimization.
What are grounding queries, and why do they matter?
Grounding queries are the internal retrieval phrases AI systems use to find your content, NOT the actual questions users ask. These queries reveal what AI systems think your content is about, helping you identify topic expansion opportunities and semantic positioning gaps.
How is Bing AI Performance different from Google Search Console?
Bing provides a dedicated AI Performance dashboard with citation-style tracking, grounding queries, and page-level citation counts, while Google mixes AI Overviews data with standard search performance reporting.
Bing focuses on citation frequency without click data, whereas Google tracks AI Overview clicks but lacks grounding queries or dedicated AI trend visualizations. Neither provides complete AI visibility, making both valuable for comprehensive measurement.
Does Bing AI Performance show click-through data from AI citations?
No. Bing AI Performance currently shows citation frequency but not clicks or traffic from AI answers to your site. This is the dashboard’s most significant limitation. Microsoft has not announced official plans to add click data.
Should I use Bing AI Performance if most of my traffic comes from Google?
Yes. While Bing has single-digit market share, it’s establishing the measurement baseline for GEO that will likely become industry standard. The tool provides free metrics, helps you understand what makes content citation-worthy, and reveals optimization patterns applicable across all AI platforms.
Why are my pages indexed but not getting any AI citations?
Pages indexed but not cited typically lack citation-worthy structure. no clear headings, missing data tables or FAQ sections, thin content under 800 words, no evidence or examples, outdated information, or missing schema markup.
AI systems need scannable structure, authoritative data, and semantic clarity to cite content confidently. Optimize these elements first before creating new content.
What does “average cited pages” mean in Bing AI Performance?
Average cited pages shows the daily average number of unique URLs from your site that Microsoft’s AI systems reference. If the metric shows 23, it means AI cited 23 different pages daily on average. High numbers indicate broad topical authority across your content; low numbers suggest concentrated authority in a few pages.
How do I access the Bing AI Performance dashboard?
Navigate to bing.com/webmasters/aiperformance and verify your site ownership via XML file upload, meta tag, or DNS verification. Once verified, the AI Performance section appears in the left navigation menu. The default view shows 30 days of citation data with adjustable date ranges.
How often should I check Bing AI Performance data?
Export citation data monthly to track long-term trends, as the dashboard only retains 30-90 days of history during public preview. Review the dashboard weekly for quick trend checks (are citations growing or declining). For urgent content refresh decisions, check specific pages daily when actively optimizing to validate impact within the 10-14 day update window.
How long does it take to see results from GEO optimization in Bing?
With IndexNow implementation, expect initial crawl within 3-7 days and AI Performance data updates within 10-14 days after optimization. Without IndexNow, the timeline extends to 1-4 weeks for crawling plus 2-3 weeks for AI re-evaluation. Full optimization impact typically takes 2-4 weeks minimum, potentially 6-8 weeks for complete visibility.
What if I have zero citations in Bing AI Performance?
Zero citations typically indicate that your site is unverified or blocked, that your pages are not indexed, or that your content is poorly structured for AI. Verify site ownership, check robots.txt settings, then audit content structure and schema markup.

Related Posts


The Inevitable Convergence: Why AI is Rewriting the Economics of Advertising
![The Growth Leader's GEO Decision Framework [+Free Template]](https://www.similarweb.com/blog/wp-content/uploads/2026/02/attachment-growth-leader-geo-decision-framework-768x429.png)

GEO for Small Businesses: How Small Businesses Can Win the AI Search Game

Beyond the Blame Game: Why AI Visibility Demands Cross-Functional Ownership (Not a Turf War)


Wondering what Similarweb can do for your business?
Give it a try or talk to our insights team — don’t worry, it’s free!