


7 Social Media Metrics You Need to Track in 2025

Social media has evolved far beyond likes and follows.
In 2025, marketers are being asked tougher questions. What’s working? What’s not? And more importantly: how do we prove it?
With a flood of platform analytics and third-party tools at your fingertips, you need to know which metrics actually matter. In this guide, we’ll break down the seven most important social media metrics every serious marketer should be tracking: Metrics that tie your content to real outcomes, from awareness and engagement to conversions and retention.
Because in 2025, real data drives real growth.
What are social media metrics?
Think of social media metrics as the scoreboard for your online presence.
They’re the hard numbers: Follower counts, engagement rates, reach, impressions – that show how your brand is performing. Used right, they’re your go-to signals for what’s working, what’s not, and where to double down.
Whether you’re running a campaign on Instagram or launching a brand push across multiple platforms, metrics help you answer one question: Is this landing with your audience?
That’s where data steps in.
Social media metrics pull insights from every click, share, and story. They help you assess your strategy, optimize in real time, and stay aligned with business goals.
And yes, automation is the new standard.
Using APIs and smart reporting templates now keeps everything streamlined, so you can skip the manual exports and focus on what matters: performance.
Why is tracking social media metrics important?
Social metrics are the backbone of smart marketing. Here’s why you need to keep a close eye:
1. Data-backed decision making
When you’ve got clean data on reach, impressions, and engagement, you can ditch the vanity metrics and build strategies that actually work.
Want to know which posts are converting? The numbers will tell you.
That’s what makes tracking the right metrics so powerful, especially when you’re figuring out what KPIs really reflect growth.
2. Audience insights
Social media metrics are your best window into how people actually interact with your brand.
What posts do they interact with? What do they ignore?
These patterns help you speak your audience’s language, crucial for marketers fine-tuning their KPI and metrics training programs or launching new content strategies.
3. Campaign optimization and ROI
Here’s the part the C-suite cares about: results.
Metrics like conversion rate and CTR tell you whether your campaign is delivering or just burning budget. When paired with a reliable API and a consistent reporting template, you’ve got a streamlined setup for proving ROI, and scaling across channels only what works.
4. Benchmarking and competitor analysis
Tracking important social media KPIs also helps you analyze your social media competitors. Are you ahead of the curve or falling behind?
Benchmarking provides context for your performance and helps you make changes before competitors pull away.
5. Content strategy refinement
Think of your metrics as feedback loops. They show you, in a clear way, what formats and messaging styles your audience responds to. Use that data to fine-tune your content strategy and double down on what resonates.
6. Quick adaptability
Things move fast. One underperforming campaign can throw off your monthly numbers.
But with access to accurate metrics, your team can react quickly by adjusting budgets, creative, or audience targets on the fly. That kind of adaptability is what separates high-performing teams from the rest.
Top social media metrics by type
Want a clearer picture of how your social content is actually performing?
These are the metrics that matter. Categorized, clarified, and ready to track – so you can see what’s working, spot what’s not, and fine-tune your strategy accordingly.
Let’s break them down by type:

1. Awareness metrics
Think of awareness metrics as your digital billboard stats. They tell you how visible your content is, who’s seeing it, and how often it’s popping up on someone’s feed. Great for getting a pulse on brand exposure.
Reach
Reach measures how many individual users saw your post at least once. Not likes. Not clicks. Just eyeballs.
It’s your go-to stat for determining how far your message is traveling and how big your potential audience really is.
Want to get more precise? Track it with a social media metrics API. That’ll let you compare reach across platforms and campaigns, and refine what’s underperforming. If you’re wondering which metrics best capture social media growth, start here.
Impressions
Impressions tell you how many times your content was displayed. Doesn’t matter if it’s the same person seeing it five times, it all counts.
High impressions = strong visibility. But impressions alone don’t give the full story. You need to pair them with reach to understand frequency (are people seeing your post once… or 17 times?).
That way, you’ve got the data to back your next move – and the trends to spot what’s getting traction.
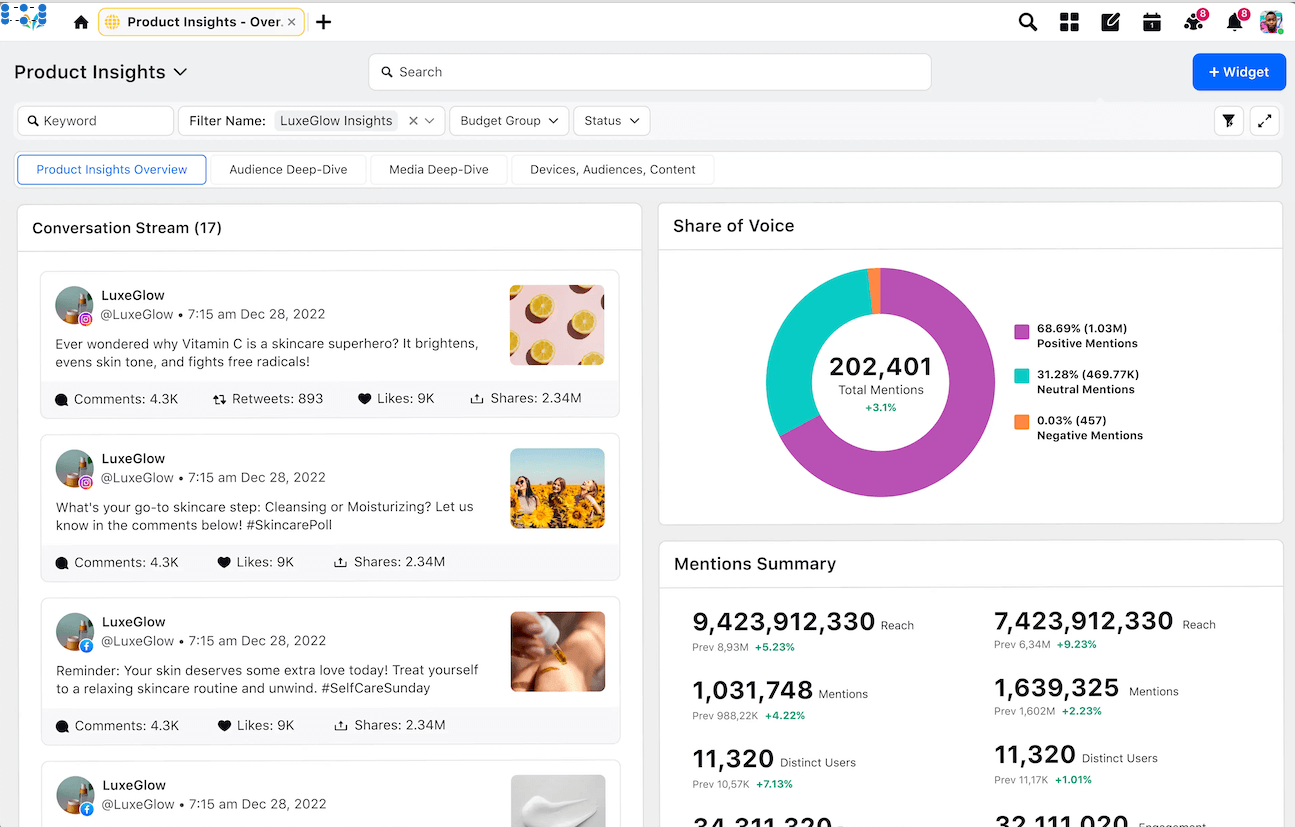
Share of voice (SOV)
This one’s all about conversation dominance. Share of voice shows what percentage of the online chatter around your niche belongs to you, compared to everyone else.
It’s how you measure brand clout in context. Who’s being talked about more? Who’s leading the narrative?
If you’re doing KPI and metrics training for social media marketing, keep an eye on share of voice. Paired with reach and impressions, it gives a three-dimensional view of brand awareness and positioning.
2. Brand health metrics
Want to know how people really feel about your brand? Brand health metrics pull back the curtain. They show whether your audience sees you as a trusted name, or just more noise in the feed.
Sentiment analysis
It’s how people say it. Sentiment analysis tracks the emotional tone behind every mention-positive, neutral, or negative. Are people excited? Indifferent? Annoyed?
This matters. Sentiment data tells you where your content lands with your audience and what needs adjusting. Think of it as your early-warning system for content misfires, or a spotlight on what’s resonating.
Brand mentions
Every time someone tags you or even drops your name in passing, that’s a brand mention. And yes, it counts.
Mentions measure how often your brand is part of the online conversation, tagged or not. The more mentions, the bigger your share of voice. Tracking this gives you accurate insight into reach, interest, and momentum. This makes it one of the clearest indicators of brand exposure in your toolkit.
3. Engagement metrics
Engagement metrics show how people actually responded to your content. Think of them as your “stickiness” indicators: the more people interact, the more your content is working.
Likes and reactions
Likes and reactions are the simplest signals, quick, low-effort ways for users to say, “Yep, I’m into this.”
Are they vanity metrics? Sometimes. But they still give you a fast read on what’s catching attention. High numbers here often translate into an increase in organic reach. And if a post’s getting liked, chances are it’s resonating.
Comments
Now we’re getting into more meaningful territory. Comments mean someone cared enough to stop scrolling and say something.
Whether it’s praise, a question, or user critique, comments deliver real feedback and open the door to conversation. They help decode audience sentiment, and that’s gold when you’re trying to refine your strategy or double down on what works.
Shares and retweets
Think of shares as the virtual version of word-of-mouth. If someone shares your content, they’re essentially vouching for it. That’s powerful.
It widens your reach and signals that what you’re saying is relevant beyond your immediate audience. Want to know if your post has viral potential? Start with this number.
Click-through rate (CTR)
CTR is your “action metric.” It tells you how many people saw your post and decided it was worth clicking through.
Doesn’t matter if you’re driving traffic to a product page, a blog, or a sign-up form, CTR is where you track results. A strong CTR shows your messaging, format, and CTA are all on point.
Post-engagement rate
This one gives you the fuller picture. It rolls up likes, comments, and shares, then compares them against total impressions or followers.
In other words, it normalizes the data so you can measure performance across posts of all sizes.
High engagement rate? That’s your signal you’re doing something right, regardless of your follower count.
4. Audience growth metrics
Audience growth metrics tell you whether more people are discovering, following, and interacting with your brand over time. It’s about momentum. These metrics give you the pulse on how fast your community is growing and where your efforts are paying off.
Total follower count
Think of this as your digital headcount. It’s the most basic growth signal – how many people are following your brand? Sure, some call it a vanity metric.
A growing follower base means your message is reaching more people, and that sets the stage for everything else.
Why it matters: It’s your baseline. Track it to see where you’re starting and how far you go.
Follower growth rate
This is the “speedometer” for your social media engine. Follower Growth Rate shows how fast your audience is expanding, day by day, week by week, month by month, year by year. It’s expressed as a percentage and tells you whether your content, campaigns, or promotions are actually bringing in fresh followers.
Marketers love this metric because it answers an important question: Are we gaining traction, or just treading water?
Overall brand audience size
Here’s where it all comes together. When you combine your followers across all platforms – LinkedIn, Instagram, TikTok, X (Twitter), wherever your brand shows up – you get a clearer view of total brand reach. That’s your overall brand audience size.
Tracking this metric helps you see which platforms are pulling their weight and where to double down. It’s also useful when presenting growth across campaigns and justifying budget allocations across teams.
5. Customer retention & satisfaction metrics
Want to know if your audience is sticking around-or quietly slipping out the back door?
These metrics give you the answer. From response times to customer loyalty, they help you understand whether your social strategy is actually making people happy or just making noise.
Here’s what you want to track:
Response time
How fast do you respond to DMs, comments, or mentions? It’s a small detail with big consequences.
A speedy response shows your support team is on it, and it keeps customers happy. For marketers, this is an important metric to determine the effectiveness of social media support.
Slow replies kill user interest. Fast ones build trust.
Customer satisfaction score (CSAT)
A quick post-purchase survey. A pop-up after a support chat. CSAT asks customers to rate their experience, and their answers say a lot.
High CSAT scores mean your content or service is hitting the mark. Low ones? Time to dig in and fix what’s broken.
It’s one of the clearest signals you’ll get that your team is delivering the experience your audience wants.
Net promoter score (NPS)
Will your customer recommend your brand to someone else? That’s what NPS tracks. It’s a reliable barometer for long-term loyalty, and an early warning system if satisfaction starts slipping.
High NPS scores usually mean strong retention. If your audience would vouch for you, they’ll likely stick around.
Review ratings
Your audience is already talking: ratings on Google, Trustpilot, or product reviews on social are public proof of what they think.
These reviews help you identify what’s working and what’s not, straight from the source. It’s real-circle feedback that validates (or contradicts) your internal metrics.
Customer retention rate
Are you keeping customers over time, or losing them after the first click? This metric measures how many stick around.
A high retention rate shows your content and engagement strategies are working. Retention is the ultimate measure of whether people actually like being part of your brand’s circle.
6. Paid conversion metrics
These are the metrics that tell you if your paid social campaigns are working. They show you whether your budget is actually driving results.
Cost per click (CPC)
CPC shows how much you’re paying for each click on your ad. Simple, right? But it’s also one of the quickest ways to tell if your campaign is efficient.
Cost per mille (CPM)
This metric looks at cost per 1,000 impressions. CPM is all about visibility. It tells you how much it costs to get your ad in front of eyeballs, even if they don’t click.
It’s useful when you want brand awareness or are comparing performance across platforms. High CPM? You might be overpaying for reach.
A lower CPC means your ad is grabbing attention and doing it cheaply. If you’re seeing CPCs rise, it’s time to tweak your creative or audience targeting.
Conversion rate
Here’s where it gets interesting. Conversion rate is the percentage of people who take action after clicking, whether that’s buying, signing up, or downloading.
If your clicks aren’t converting, your landing page or offer might be the problem. A high conversion rate is a sign your message is landing with the right people.
Return on ad spend (ROAS)
ROAS tells you how much revenue you’re making for every dollar you spend on ads. It’s the ultimate measure of profitability.
If you spend $1 and earn $4 back, your ROAS is 4x. Monitor it religiously. A falling ROAS could signal wasted spend. A rising ROAS means it’s time to scale.
7. Social media ROI metrics
ROI metrics tell you whether your campaigns are actually delivering dollars and value.
Conversion value
Want to prove your social content drives sales? Start here. Conversion value tracks the revenue tied directly to conversions from your social channels.
It connects engagement to earnings. This metric lets you put a price tag on your campaigns and see exactly how much return you’re generating.
Revenue per post
Not all posts are created equal, and this metric proves it. Revenue per post tells you how much income a single piece of content brings in. It’s especially useful for brands running frequent promotions or flash sales on social.
By measuring this, you can determine what content converts and what is just filling up your feed. Use it to focus more on what’s working.
Customer acquisition cost (CAC)
Every customer costs you something. The trick is knowing how much, and making sure it’s worth the effort.
CAC measures the total spend required to bring in a new customer via social. Lower is better, obviously. But more than that, tracking CAC alongside your revenue and conversion data helps you fine-tune your budget for maximum payoff.
Overall return on investment (ROI)
This is the big one. Overall ROI weighs the total profit from your social media activities against the costs to run them. It rolls up everything:
- Ad spend
- Content creation
- Engagement
- Conversions
And it tells you if you’re making more than you’re spending. If the number’s high, your strategy’s working. If not, time to dig in and make changes.
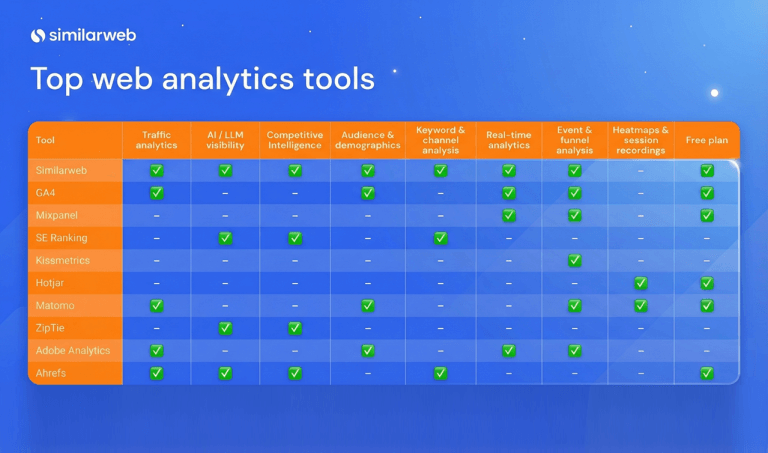
Tools to track social media metrics
Tracking social media metrics can get complicated, fast. Multiple platforms, different KPIs, and shifting priorities mean it’s easy to get lost in the data. That’s where the right tools make all the difference.
Here’s a roundup of the top picks to help you cut through the noise and focus on what matters:
Similarweb
If you want to connect social activity to actual business outcomes (in near real time), Similarweb’s your go-to. It tracks traffic coming in from social channels and shows how those visits stack up against overall website performance, so you can tie engagement to results, not just reach.

Head over to the Social Overview report inside the Website Analysis tool.

Here’s what you’ll find:
- Total Social Visits: Your top-line number. It counts all (non-unique) visits from social within the selected time period
- Social Distribution: Breaks down which platforms are pulling their weight. You’ll see the percentage share each social network contributes to your overall social traffic
- Social Traffic Over Time: See the trends as they happen – monthly spikes, dips, and seasonality patterns that tell the real story
You’ll also get a full breakdown of the social media sources sending traffic your way, so you know who’s bringing the heat and who’s falling flat.
Sprout Social
Sprout Social is a favorite among social media managers for a reason. It gives you a clean, unified view of everything from engagement and reach to follower growth and content performance.

The real kicker? Its reports are both powerful and presentation-ready.
Compare platforms side by side, track KPI movement over time, and generate reports that even the C-suite will love.
Bonus: The custom dashboards let you keep your most important metrics front and center, no digging required.
Hootsuite
Known for scheduling, but don’t sleep on its reporting. Hootsuite pulls all your channels into one tidy dashboard, letting you track performance metrics like reach, impressions, and engagement, without the chaos of tab-hopping.

It’s clean, it’s fast, and it’s made for teams that want to act on insights quickly. Perfect for spotting trends mid-campaign and pivoting on the fly.
Buffer
Buffer keeps it simple, and that’s part of the charm. It handles publishing and analytics with equal ease, offering clear reports by post, channel, or campaign.
Want to see which kind of content gets more engagement on LinkedIn vs. X (formerly Twitter)? Buffer lays it out clearly. The interface is clutter-free, the metrics are intuitive, and it’s great for making quick content tweaks that move the needle.

Brandwatch
Need to check your brand sentiment – or how you stack up to the competition? Brandwatch brings next-level analytics to the table. With customizable templates and in-depth tracking, it helps you zero in on the metrics that actually matter to your brand.
From benchmarking content performance to analyzing audience mood swings, Brandwatch is like a pulse check for your messaging and brand perception. A solid pick for teams serious about reputation management.

Sprinklr
Sprinklr is built for scale. It connects the dots across your entire social ecosystem, pulling in data from every channel and delivering a big-picture view grounded in granular insights.
Think advanced monitoring, smart dashboards, and unified data that make campaign planning more science than guesswork. It’s especially useful for large teams juggling multiple channels and customer touchpoints.
Google Analytics
Pair your social dashboards with Google Analytics (GA), and you’ve got the full story.
While social tools show engagement on-platform, GA reveals what happens after the click-traffic, bounce rates, conversions, and more. It’s the link between your content calendar and your conversion funnel.
Together, they give you end-to-end visibility, from scroll to sale.

Time to get social
Tracking the right social media metrics is how you identify what’s working, catch new trends before they peak, and double down on what drives real growth.
Whether you’re focused on awareness, engagement, or ROI, understanding these signals gives you a serious edge. Because once you’ve got the data, you can stop guessing and start optimizing.
Similarweb adds that extra layer of insight.
Think referral traffic breakdowns, audience behavior patterns, and performance benchmarks that go beyond the surface. All the data you need to turn solid campaigns into standout ones.
Bottom line? If you want to stay ahead in 2025, your social strategy needs to be grounded in real numbers.
So keep tracking. Keep testing. Let the data guide your next big win.
FAQs
How can social media metrics inform content strategy?
Think of social media metrics as your content compass. They tell you what’s working, what’s not, and where to go next. By tracking engagement and audience behavior, you’ll quickly spot which topics spark interest, and which fall flat. That means you can tweak your posting schedule, fine-tune your message, and test new formats that resonate.
What part does a social media metrics API play in data analysis?
APIs take the heavy lifting out of tracking social performance. Instead of pulling reports manually, a social media metrics API pipes in data from every platform you care about, automatically. It connects the dots across channels, cuts reporting time, and delivers information you can act on fast. That kind of automation lets you refine your strategy on the fly and drive stronger outcomes without the spreadsheet slog.
How does using a standardized social media metrics template benefit marketing teams?
Templates might not sound exciting, but they’re useful for growing teams. A consistent format keeps everyone informed, whether you’re reviewing performance across channels or building your next campaign report. It also makes onboarding and training smoother since everyone’s tracking the same KPIs, the same way. And the real win? Easier cross-team collaboration, faster insights, and a clearer view of what’s driving success, or holding you back.

Related Posts


Why Your Competitors Dominate AI Search Results, and You Don’t

10 Best Competitor Analysis Tools for 2026 (Ranked & Reviewed)
Top Web Analytics Tools: Prepare Your Performance Measurement For 2026


Your full marketing toolkit for a winning strategy
The ultimate solution to help you build the best digital strategy