


Competitors’ Audience Analysis in Apps: Guide and Examples

It’s costing more and more to attract new app users, and even when you do, retention is fragile and the competition isn’t letting up. That’s why competitor app analysis is becoming essential for sustainable app growth.
Most app marketing and growth teams know a fair amount about their own users based on downloads, sessions, retention and revenue data.
What they often can’t see is:
- Who their competitors are attracting, and whether their audience looks different
- Which demographics they’re missing entirely
- What other apps their users rely on daily
- Where their audience is exclusive
- Where audience overlap points to a partnership opportunity or a battle for acquisition.
That’s when audience insights become a true game changer.
We’re talking detailed demographic breakdowns, cross-app usage data that shows key behavioral patterns, audience overlap analysis and much more.
This isn’t just interesting data. It can influence everything from acquisition strategy and product positioning to your partnership planning and long-term expansion goals.
In this guide, we’ll walk through four ways of using Similarweb’s App Audience Analytics, including App Demographic Analytics that can help you analyze competitors’ audience, uncover new target segments, identify partnership opportunities, and make more confident decisions about your app growth strategy.
1) Analyzing competitor demographics
You may know your target audience, but is that the same audience your competitors are currently winning over?
Many product teams assume they compete for the same users, but demographic data often tells a different story.
Let’s say you manage the app growth for Prime Video, competing with Netflix and Disney+.
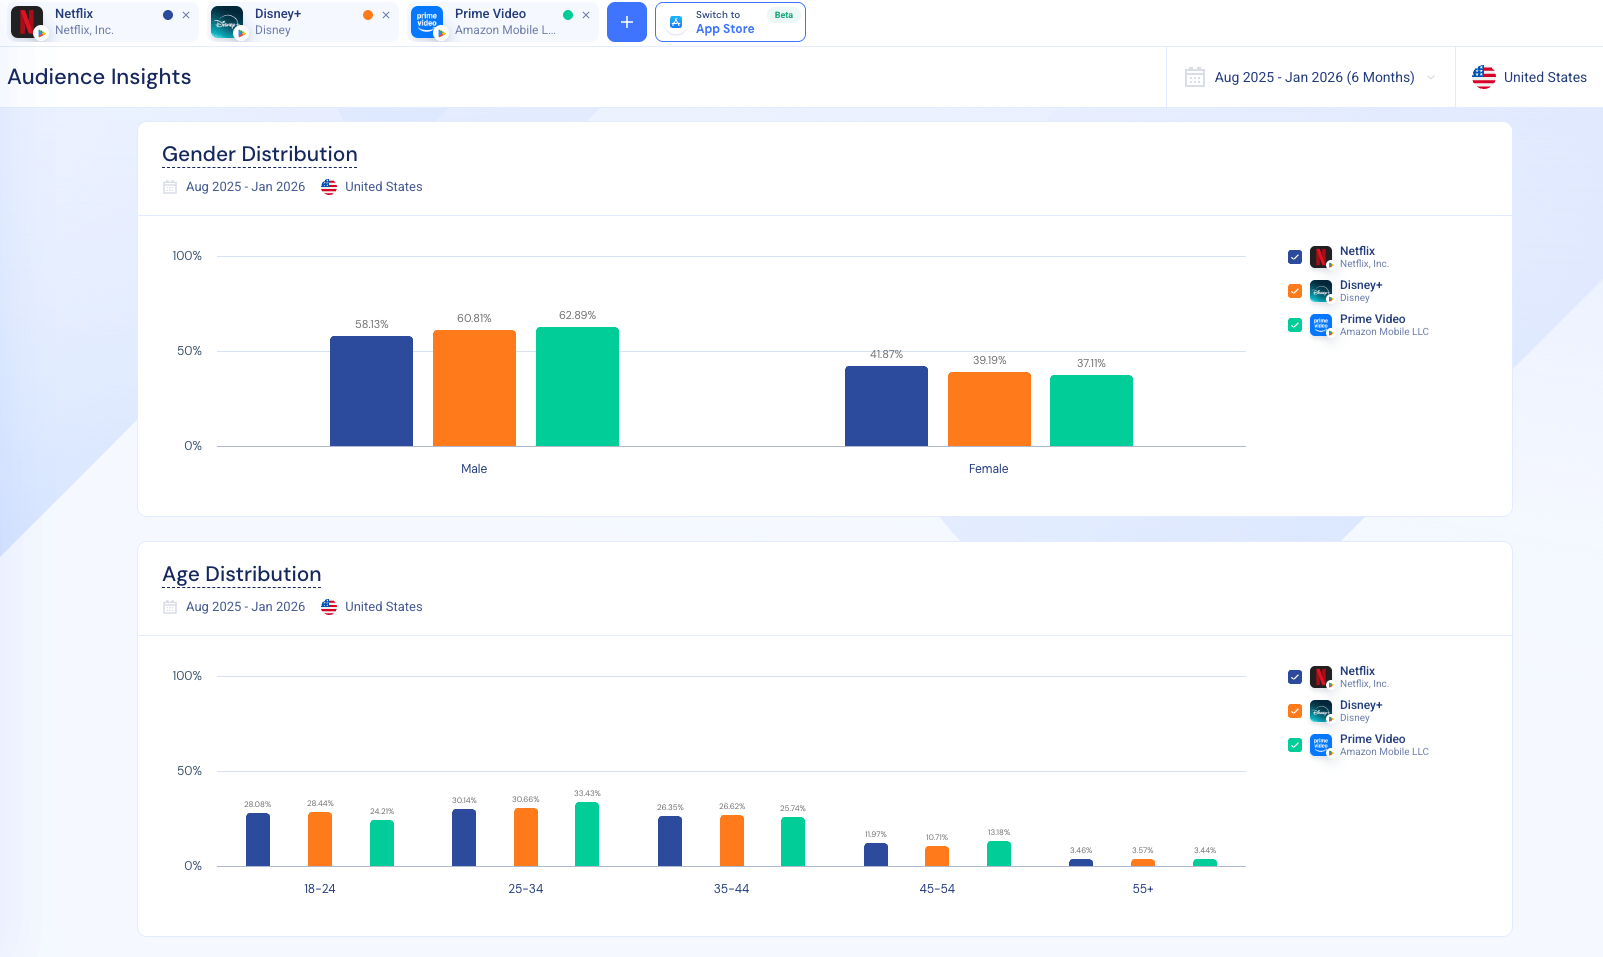
Firstly, we see that:
- Prime Video: 62.89% male and 37.11% female
- Disney+: 60.81% male and 39.19% female
Netflix: 58.13% male and 41.87% female
While all three platforms skew male, Prime Video does so the most strongly. This gap actually tells us something, it suggests:
- Prime Video’s content mix or positioning resonates more with male audiences
- There’s an opportunity to expand with female viewers
- Netflix holds a slight advantage in gender balance
This sort of insight can inform Prime Video’s content acquisition, creative strategy and audience targeting.
Age distribution data can give even more direction:
For example, Prime Video’s has a strong appeal to 25–34 year olds, where it slightly outperforms both Netflix and Disney+. However, it under-performs in the 18–24 bracket, showing that Gen Z audiences are gravitating more toward Netflix and Disney+.
This could change how you think about Prime Video’s app strategy, as the demographic data here helps you decide whether to invest in younger-focused content, rebalance your acquisition targeting, or double down on your strengths.
2) Finding new target segments
Sometimes growth doesn’t come from fighting harder for users, but discovering who else is already choosing your app.
Let’s say you’re on the Chime app team, benchmarking against Cash App and SoFi in the U.S.
You may assume fintech apps appeal to the young and male. But our data says otherwise.
Chime is actually the only one of the three with a female majority audience, with over 52% female users. Cash App and SoFi both appeal more to men, especially SoFi. That alone changes how to think about positioning. If your competitors are winning with male investors, Chime appears to resonate more with women managing everyday finances.
The age distribution adds even more insight. While 25–34 is the dominant segment across all three apps, Chime holds a particularly strong share there with over 43%. At the same time, it’s got a strong hold among 45–54 and 55+ users compared to Cash App, which appeals to the younger crew, especially the 18–24 range.

Over at Chime, this data can reframe who you think your core audience is. Chime isn’t just competing for Gen Z users, it has strong appeal with older millennials and an aging generation of users likely thinking about stability, budgeting and household finances.
Looking beyond demographics, the category affinity data shows that Chime users engage not just with finance apps but also with communication, entertainment and gaming categories. SoFi users, in contrast, overlap heavily within finance and investing, while Cash App users show stronger lifestyle and shopping overlap.

It’s clear that each app shows a different behavioral pattern.
For Chime, the opportunity isn’t necessarily to chase younger users where Cash App is strongest. It may be to lean into the overlapping segments where it already has traction and build messaging, features and partnerships that support existing browsing and usage patterns.
3) Spotting partnerships and rev-share opportunities
This is where cross usage data starts acting more like a business development tool.
In Similarweb’s Audience Interest module, you’re no longer analyzing demographics, instead you’re able to see the broader behavior of your users: what other apps they rely on, which brands they trust and how they move through the travel journey.
Let’s assume you’re on the Airbnb team analyzing U.S. users over the past six months.
The cross-app data immediately shows that Airbnb users are highly active across the wider travel sector. For example, there’s strong overlap with Vrbo, showing a lot of active comparison behavior within the vacation rental category. But the overlap doesn’t stop at direct competitors.
There’s also interesting cross-usage with United Airlines, Alaska Airlines, and other airline apps. They go to the Turo app for car rentals, the Marriott Bonvoy app to manage loyalty points, and also use major travel comparison apps like KAYAK and Hotels.com:

Airbnb users aren’t just booking accommodation, they’re building their entire trip at the same time.
The category affinity doubles down on this. Airbnb’s audience massively over-indexes in Travel & Local, as you’d expected, but also shows strong affinity in Finance, Productivity, and Lifestyle. That suggests these users are planners. They’re managing budgets, tracking itineraries, coordinating logistics, and optimizing travel experiences across multiple apps:

In terms of building partnerships and other business development strategies, this opens a lot of doors.
For instance, strong Airline overlap creates an opportunity for bundled offers or loyalty programs. Car rental overlap points toward rev-share partnerships with mobility platforms. Loyalty program engagement suggests co-branded rewards or point redemption integrations would resonate well with your audience. Even travel comparison apps offer some affiliate and sponsored placement potential.
Audience Insights doesn’t just show you overlap. It shows you where collaboration can naturally fit into behaviour that is already in motion.
4) Understanding audience overlap vs. exclusivity
Not all audience overlap is a problem, and not all exclusivity is a weakness.
Using Similarweb’s overlap app data, you can see exactly how much of your audience is shared with competitors, and how much is uniquely yours.
This time we will be analyzing the Netflix app, comparing it to Disney+ and Prime Video.
The cross-app data shows what you’d expect in streaming: Netflix users also use other entertainment apps at very high rates. For example, cross-usage with Prime Video sits at 26.94%, and with Disney+ at 20.48%. That’s a huge shared audience:
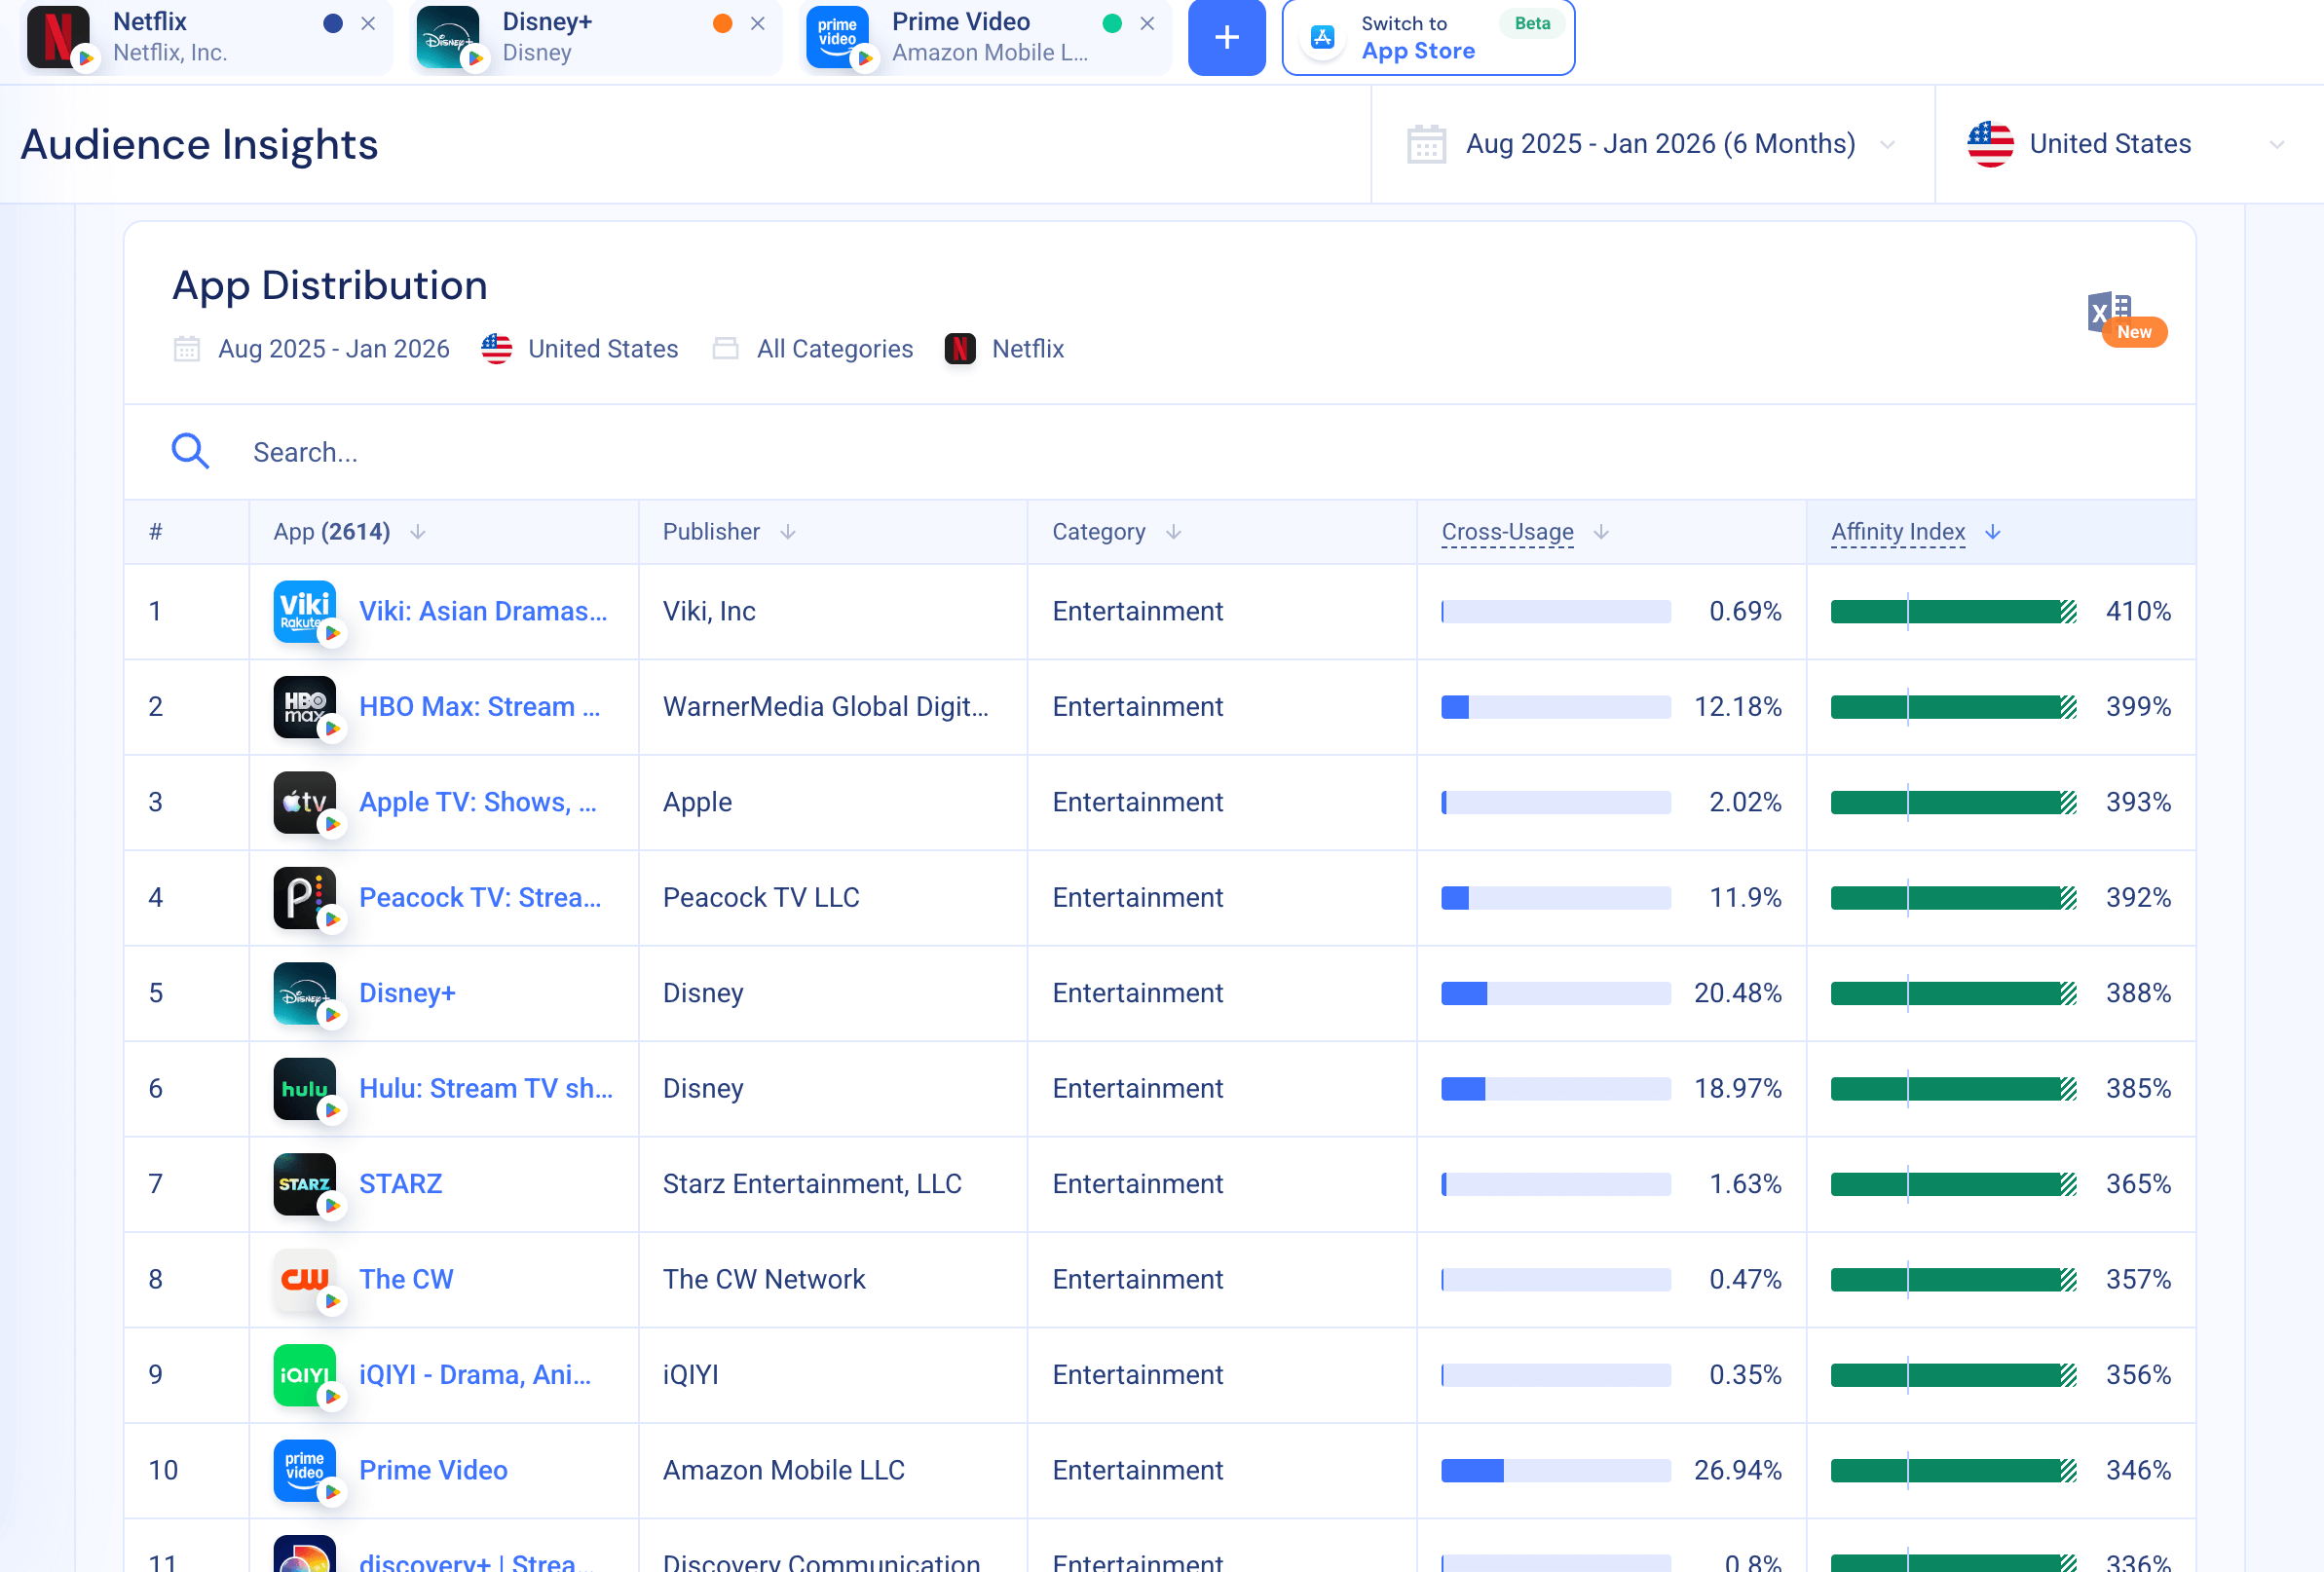
At first glance, that might look like a big competitive threat, but for streaming apps, this kind of overlap is normal. Many households subscribe to multiple streaming services at once.
The more important question is actually: how much of your audience is exclusive?
Looking beyond Disney+ and Prime Video, Netflix shows strong affinity with a wide range of other entertainment apps like HBO Max, Peacock, Hulu and Apple TV, but none match Netflix’s total reach. The high cross-usage with Prime Video suggests shared, price-sensitive or bundle-driven households, while the Disney+ overlap likely points to overlap with family households.
But exclusivity is where the real advantage lies.
If about a quarter of Netflix users also use Prime Video, most of them don’t. That remaining audience represents viewers who choose Netflix as their main streaming app.
Now let’s compare Disney+:
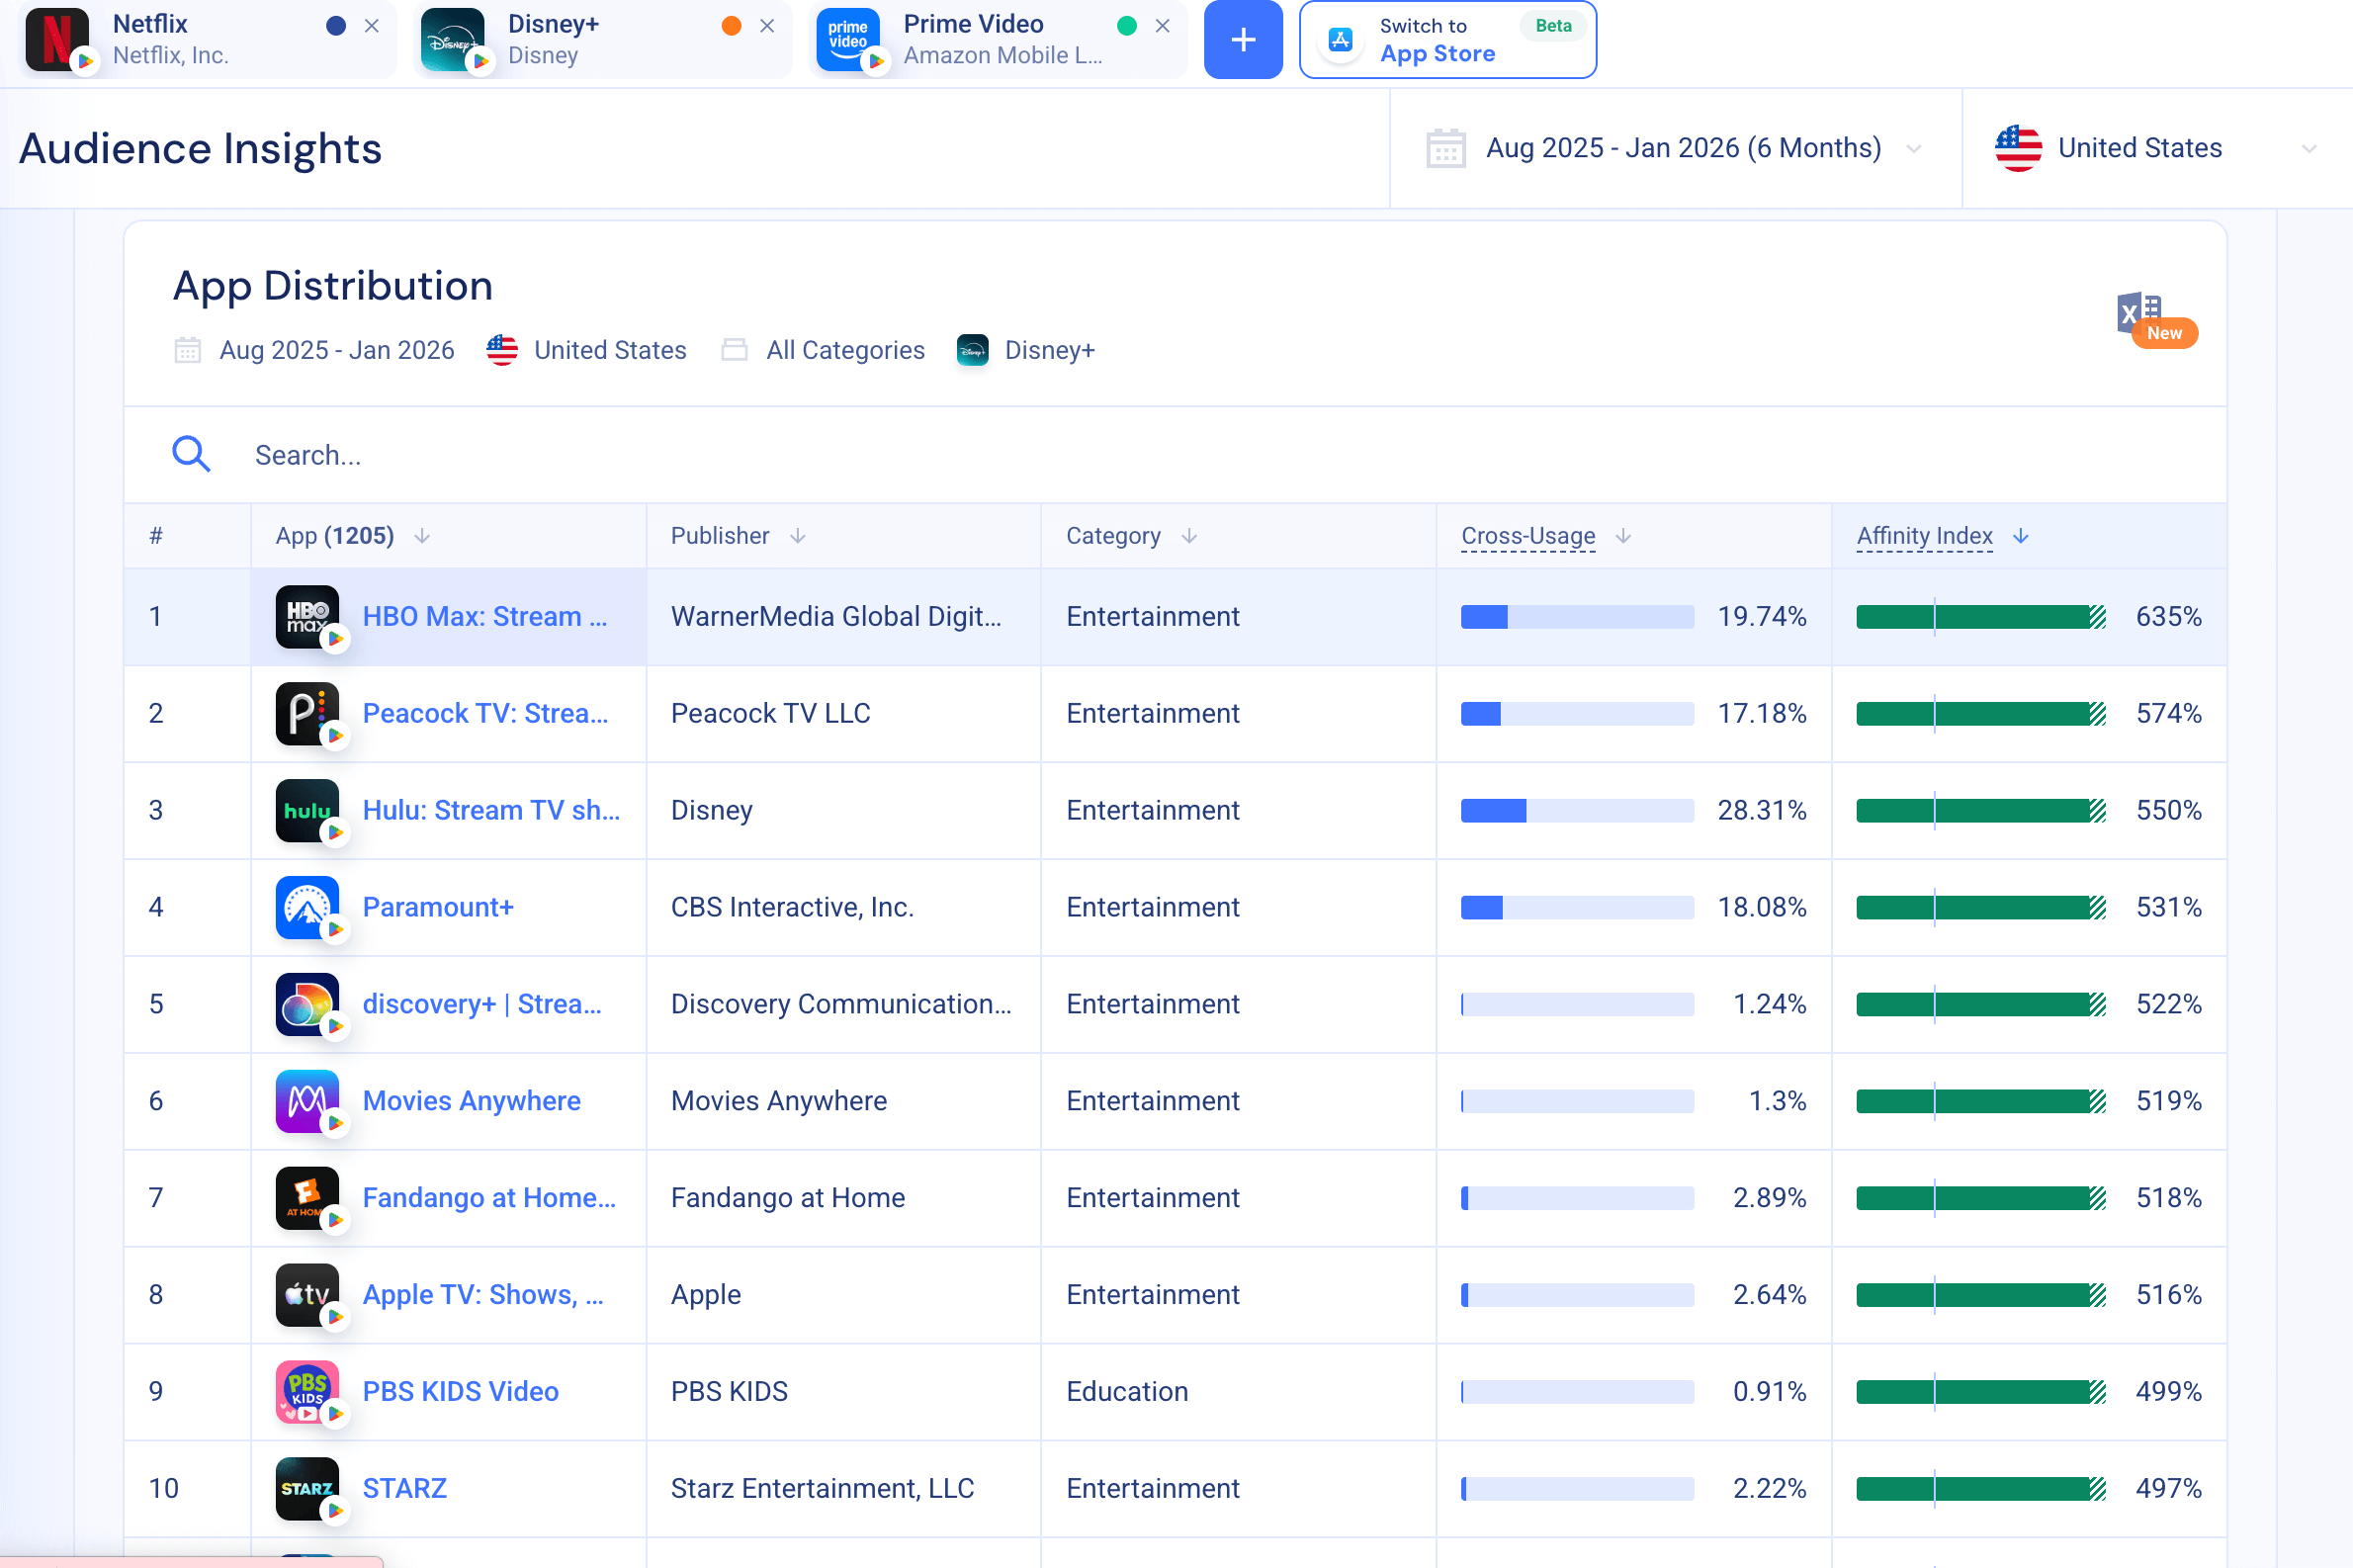
Disney+ shows high cross-usage with Hulu (28.31%) and HBO Max (19.74%), suggesting it lives strongly within family and franchise-driven entertainment. Prime Video, meanwhile, overlaps meaningfully with both Disney+ (22.66%) and Hulu (22.71%), securing its role as part of bundled or add-on viewing behavior.
High overlap identifies the level of competition, making things like content release timing, exclusives and pricing strategies really important.
Meanwhile, exclusivity shows where your app has strength. A large exclusive audience suggests strong brand loyalty, differentiated content, or structural advantages like original programming depth.
For Netflix, Disney+ isn’t actually ‘stealing’ their users, but instead shows that streaming behavior is layered. Some use multiple apps but others choose to stick to one platform.
Turning audience insights into action
When audience insights become part of your regular analysis, it stops being just data and starts influencing your day to day strategy:
1) Monthly competitor benchmarking
Make audience comparison a habit: track demographic shifts, cross-usage changes, and overlap trends every month to spot movement early, before it shows up in downloads or drop offs.
2) Quarterly segment expansion
Identify one new audience segment to test each quarter. That could mean focusing on an age group, addressing an underrepresented demographic, or refining messaging for a segment competitors are currently winning over.
3) Partnership mapping
Use cross-app usage data to shortlist some high-fit partnership targets. Focus on brands your users already engage with, whether that’s airlines, fintech apps, loyalty programs, or entertainment platforms.
4) Media buying optimization
Match your paid acquisition with real audience data. If your app appeals to an older, younger, more female or more niche user base than expected, your targeting and messaging should reflect that reality.
FAQS
- What is competitors’ audience analysis in apps?
Competitors’ audience analysis is the process of examining who your competitors are attracting, including their demographics, behavioral patterns, cross-app usage, and audience overlap. It helps you understand how your audience compares to theirs and where opportunities exist for growth, differentiation, or partnerships. - Why is analyzing competitors’ app audiences important?
As user acquisition costs rise and retention becomes more fragile, understanding competitor audiences gives you strategic visibility beyond your own internal data. It helps you identify underserved demographics, refine positioning, discover new growth segments, and anticipate competitive pressure before it impacts performance. - What kind of data is included in app audience insights?
App audience insights typically include gender and age distribution, category affinity, cross-app usage data, audience overlap percentages, and exclusivity metrics. Together, these data points provide a detailed view of who users are and how they behave across the broader app ecosystem. - How can demographic analysis improve acquisition strategy?
Demographic analysis reveals whether competitors are attracting different age groups or gender segments than you are. For example, if a competitor over-indexes with Gen Z while your app performs better with millennials, you can decide whether to invest in expanding into younger audiences or double down on your current strengths. - How do you identify new target segments using audience data?
By benchmarking your audience against competitors, you may uncover unexpected strengths. For instance, if your app has a stronger female audience while competitors skew male, that insight can reshape your messaging, feature development, and targeting strategy. Growth often comes from leaning into segments where you already resonate. - What is cross-app usage analysis and why does it matter?
Cross-app usage analysis shows which other apps your users actively engage with. This reveals broader behavioral patterns, such as whether users are planners, comparison shoppers, investors, or entertainment-focused consumers. Understanding these patterns helps you refine product strategy and identify complementary opportunities. - How can audience insights help identify partnership opportunities?
When your users consistently overlap with specific complementary apps, such as airlines, loyalty programs, fintech platforms, or comparison tools, it signals natural alignment. These overlaps can inform bundled offers, co-branded rewards, affiliate opportunities, and rev-share partnerships that fit into existing user behavior. - Is high audience overlap with competitors always a threat?
High overlap is not always a negative signal. In many categories, such as streaming or fintech, users commonly use multiple apps simultaneously. Overlap helps measure the level of competitive intensity, while exclusivity reveals where your app has deeper loyalty or differentiation. - What does audience exclusivity reveal about an app?
Audience exclusivity shows how much of your user base does not actively use competing apps within the same category. A strong exclusive audience can indicate brand loyalty, differentiated content or features, or structural advantages such as pricing or ecosystem integration. - How often should teams analyze competitor audience data?
Competitor audience analysis should be an ongoing process rather than a one-time exercise. Reviewing demographic shifts, cross-usage patterns, and overlap trends on a monthly basis allows teams to detect movement early, while quarterly reviews help identify new segments and strategic opportunities for expansion.

Related Posts


Wondering what Similarweb can do for your business?
Give it a try or talk to our insights team — don’t worry, it’s free!