





Top Ecommerce Companies in the USA: The 100 Brands Winning the Traffic Race in 2026
by Inbar Eytan6 Min.
Aug 30, 2026

As researchers, we know how powerful quantitative research data can be in helping answer strategic questions. Here, I’ve detailed 23 use cases and curated 98 quantitative market research questions with examples – making this a post you should add to your bookmark list , so you can quickly refer back.
I’ve formatted this post to show you 10-15 questions for each use case. At the end of each section, I also share a quicker way to get similar insights using modern market research tools like Similarweb.
Quantitative market research questions tell you the what, how, when, and where of a subject. From trendspotting to identifying patterns or establishing averages–using quantitative data is a clear and effective way to start solving business problems.
Quantitative market research questions are divided into two main types: descriptive and causal.
Get clear explanations of the different applications and approaches to quantitative research–with the added bonus of seeing what questions to ask and how they can impact your business.
A powerful example of quantitative research in play is when it’s used to inform a competitive analysis. A process that’s used to analyze and understand how industry leaders and companies of interest are performing.
Pro Tip: Collect data systematically, and use a competitive analysis framework to record your findings. You can refer back to it when you repeat the process later in the year.
With this data, you can determine your position in the market and benchmark your performance against rival companies. It can then be used to improve offerings, service standards, pricing, positioning, and operational effectiveness. Notice that all questions can be answered with a numerical response, a key component of all successful examples of quantitative market research questions.
♀️ Question: What is the market share of our major competitors?
Insight sought: Industry market share of leaders and key competitors.
Challenges with traditional quantitative research methods: Outdated data is a major consideration; data freshness remains critical, yet is often tricky to obtain using traditional research methods. Markets shift fast, so being able to obtain and track market share in real time is a challenge many face.
A new approach: Similarweb enables you to track this key business KPI in real-time using digital data directly from the platform. On any day, you can see what your market share is, along with any players in your market. Plus, you get to see rising stars showing significant growth, who may pose a threat through market disruption or new tactics.
⏰ Time to insight: 30 seconds
✅ How it’s done: Using Similarweb’s Web Industry Analysis, two digital metrics give you the intel needed to decipher the market share in any industry. I’m using the Banking, Credit, and Lending market throughout these examples. I’ve selected the US market, analyzing the performance of the previous 3 months.
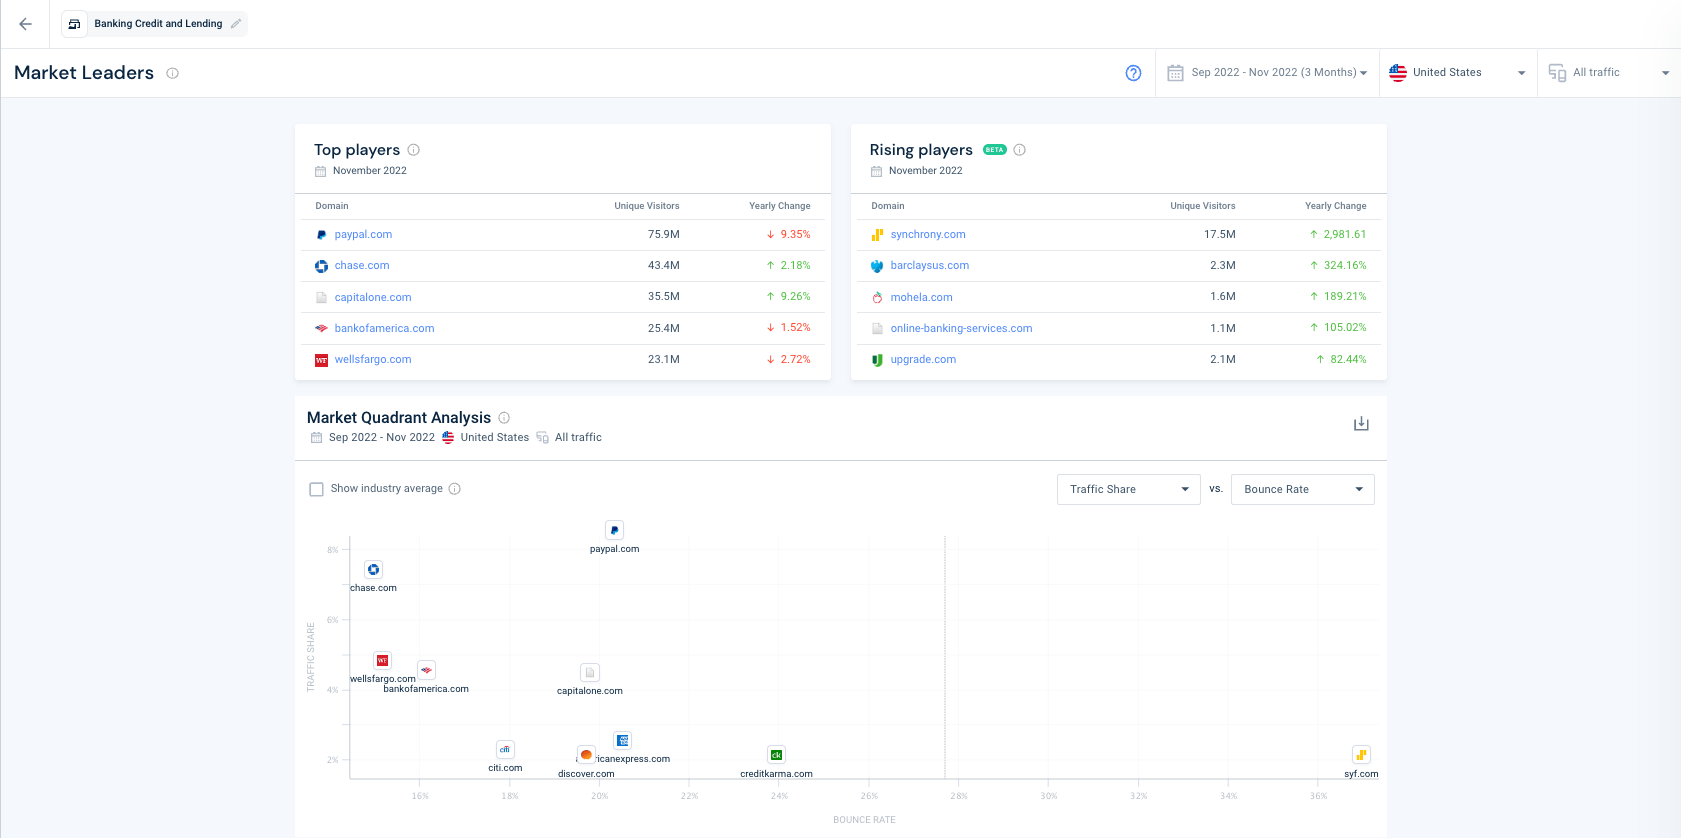
Here, I can see the top players in my market based on the number of unique visitors to their sites. On top of the raw data that shows me the volume of visitors as a figure, I can quickly see the two players (Capital One and Chase) that have grown and by what percentage. On the side, you can see rising players in the industry. Now, while my initial question was to establish the market share of my major competitors, I can see there are a few disruptive players in my market who I’d want to track too; Synchrony.com being one of particular interest, given their substantial growth and traffic numbers.
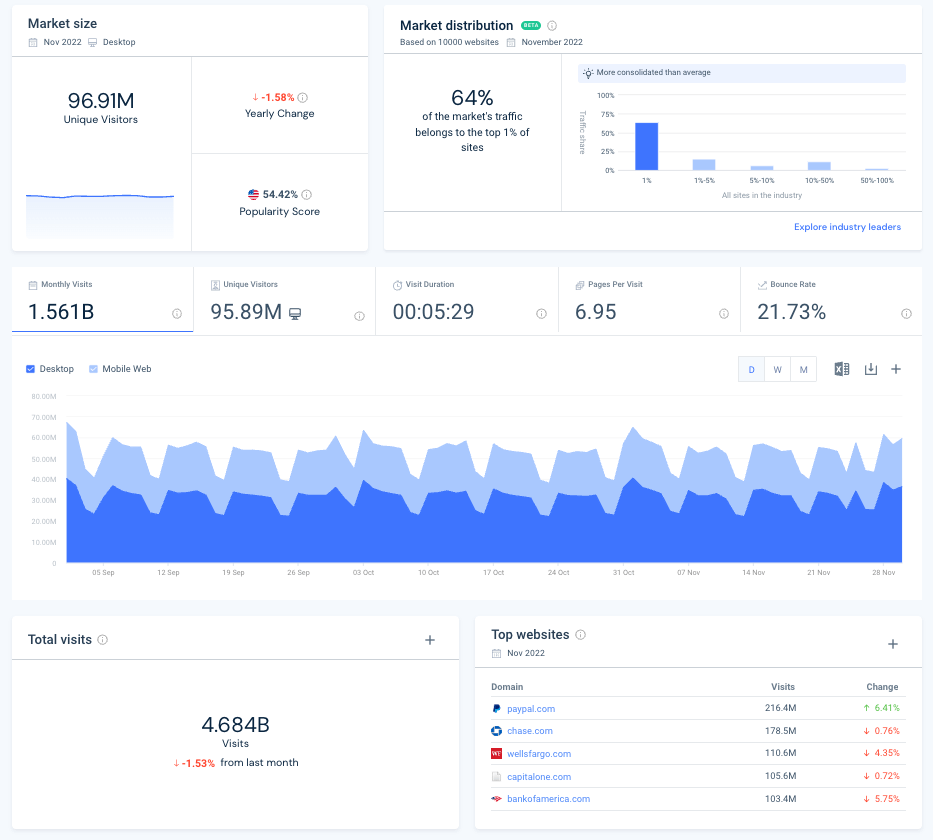
Viewing the overall market size based on total search volumes, you can explore industry leaders in more detail. The top websites are the top five players, ranking by traffic share. You can also view the month-over-month change in visits, which shows you who is performing best at any given time. It’s the same five names, with Paypal and Chase leading the pack. However, I see Wells Fargo is better at attracting repeat visitors, while Capital One and Bank of America perform better at drawing in unique visitors.
In answer to my question, what is the market share of my major competitors, I can quickly use Similarweb’s quantitative data to get my answer.
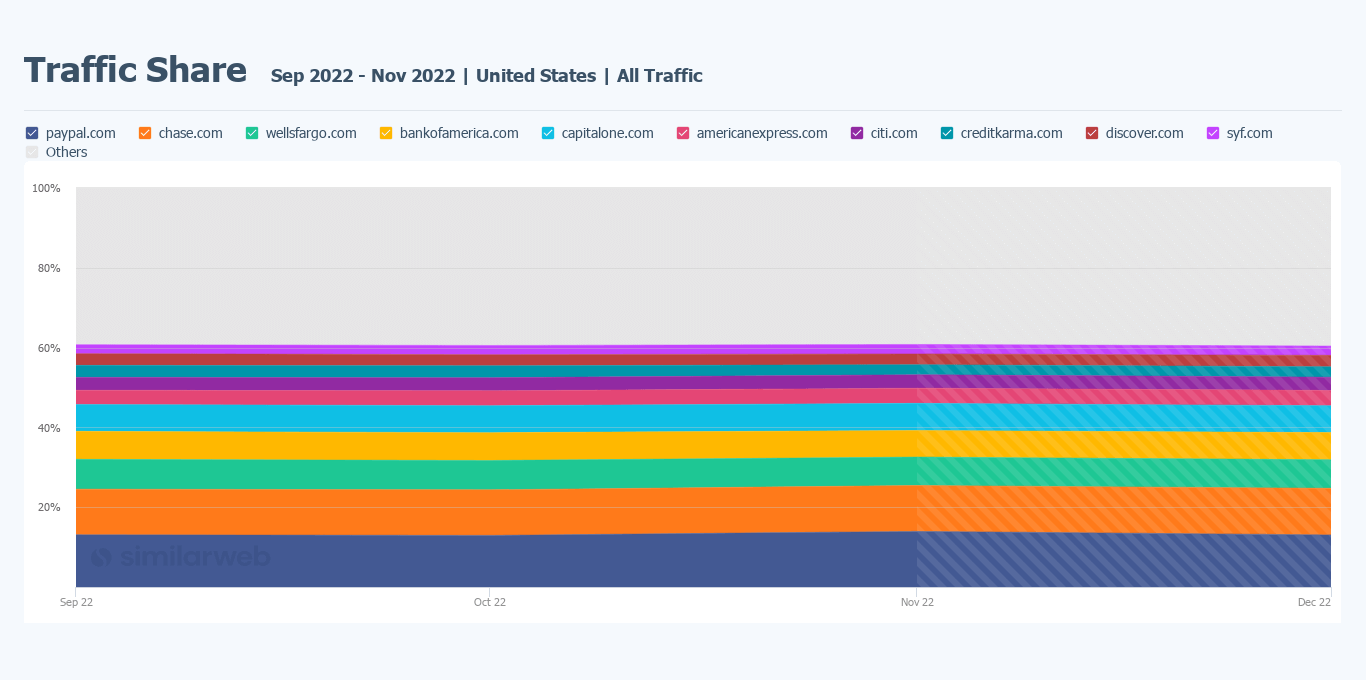
This traffic share visual can be downloaded from the platform. It plots the ten industry leader’s market share and allocates the remaining share to the rest of the market.
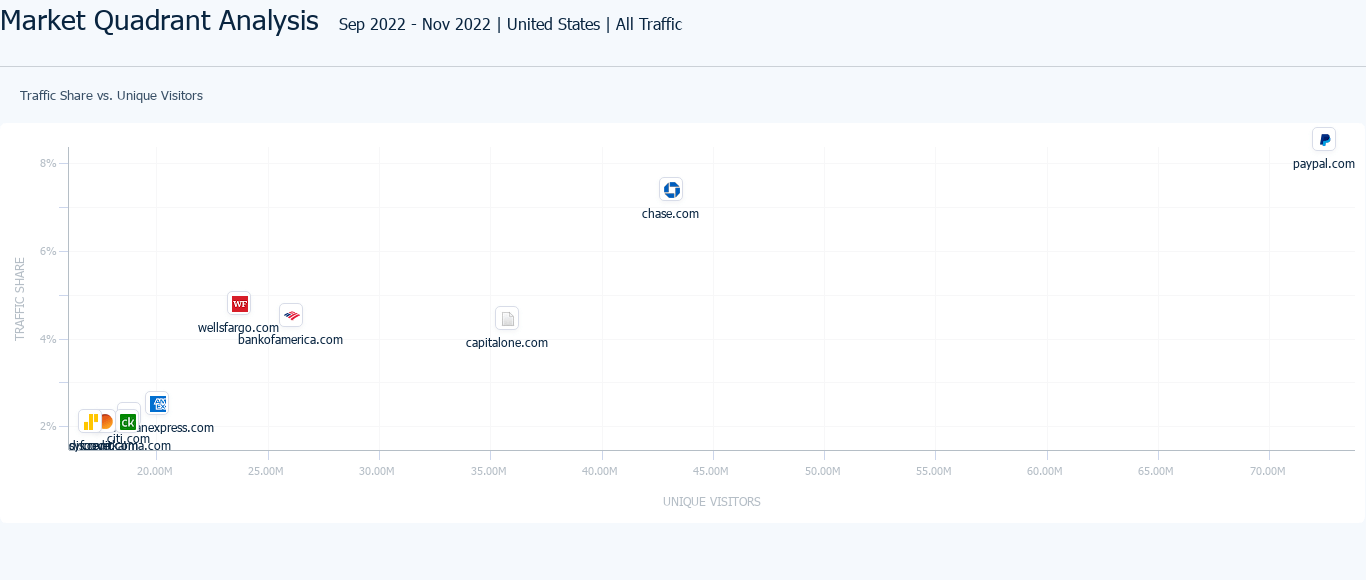
I can also download a market quadrant analysis, which takes two key data points, traffic share and unique visitors, and plots the industry leaders. All supporting raw data can be downloaded in .xls format or connected to other business intelligence platforms via the API.
These studies measure and analyze consumer behavior, preferences, and habits. Any type of audience analysis helps companies better understand customer intent, and adjust offerings, messaging, campaigns, SEO, and ultimately offer more relevant products and services within a market.
While applying a qualitative approach to such studies is also possible, it’s a great example of quantitative market research in action. For larger corporations, studies that involve a large, relevant sample size of a target market deliver vital consumer insights at scale.
Read More: 83 Qualitative Research Questions & Examples
♀️ Question: What type of content performed best in the market this past month?
Insight sought: Establish high-performing campaigns and promotions in a market.
Challenges with traditional quantitative research methods: Whether you consider putting together a panel yourself, or paying a company to do it for you, quantitative research at scale is costly and time-consuming. What’s more, you have to ensure that sampling is done right and represents your target audience.
A new approach: Data analysis is the foundation of our entire business. For over 10 years, Similarweb has developed a unique, multi-dimensional approach to understanding the digital world. To see the specific campaigns that resonate most with a target audience, use Similarweb’s Popular Pages feature. Key metrics show which campaigns achieve the best results for any site (including rival firms), campaign take-up, and periodic changes in performance and interest.
⏰ Time to insight: 30 seconds
✅ How it’s done: I’ve chosen Capital One and Wells Fargo to review. Using the Popular Pages campaign filter, I can view all pages identified by a URL parameter UTM. For clarity, I’ve highlighted specific campaigns showing high-growth and increasing popularity. I can view any site’s trending, new, or best-performing pages using a different filter.
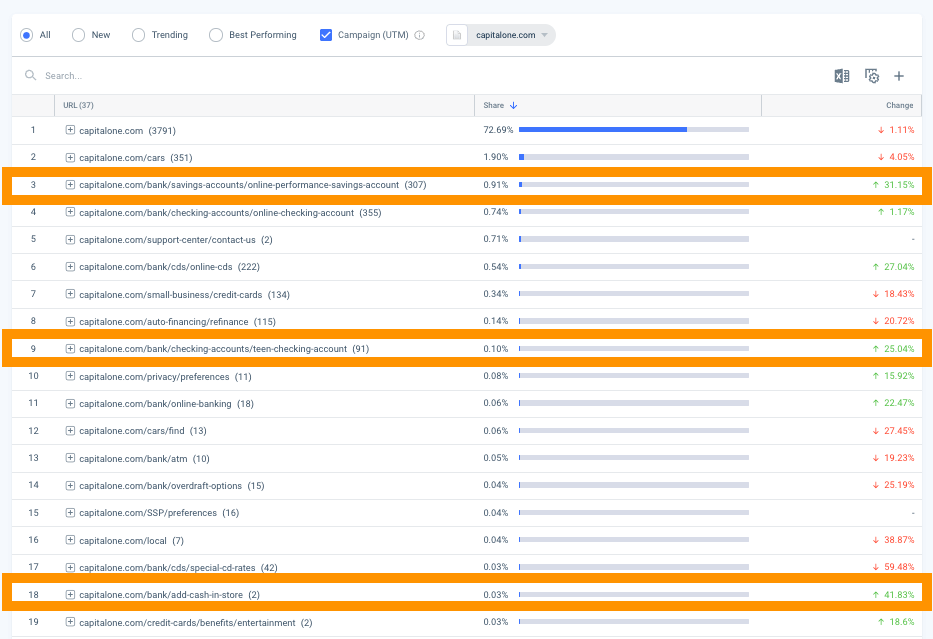
In this example, I have highlighted three campaigns showing healthy growth, covering teen checking accounts, performance savings accounts, and add-cash-in-store. Next, I will perform the same check for another key competitor in my market.
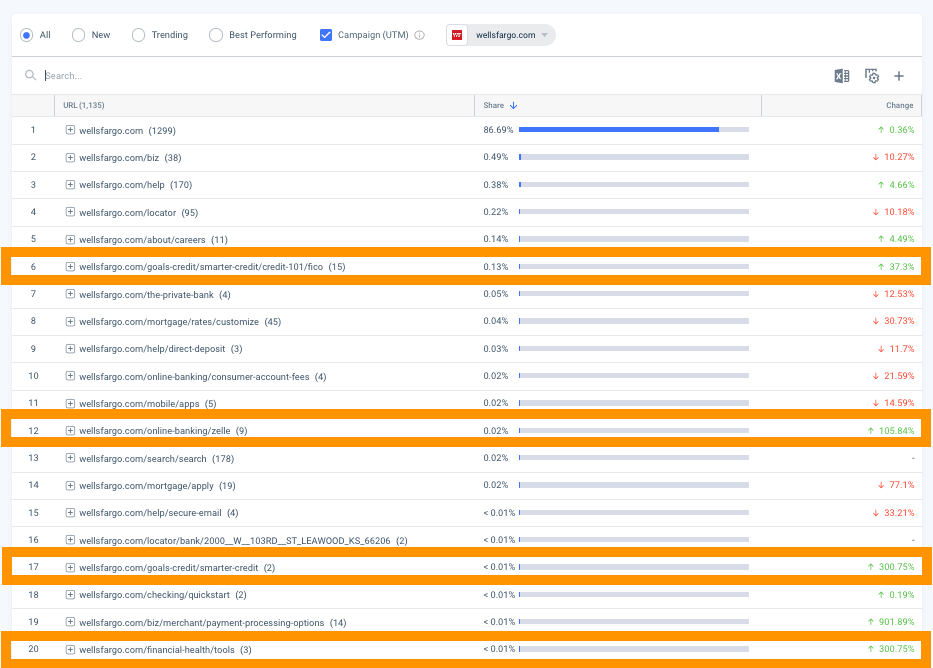
Here, I can see financial health tools campaigns with over 300% month-over-month growth and smarter credit and FICO campaigns showing strong performance. This tells me that campaigns focussing on education and tools are growing in popularity within this market.
These studies are designed to measure customers’ awareness, perceptions, behaviors, and attitudes toward a brand over time. Different applications include measuring brand awareness, brand equity, customer satisfaction, and purchase or usage intent.

These types of research surveys ask questions about brand knowledge, brand attributes, brand perceptions, and brand loyalty. The data collected can then be used to understand the current state of a brand’s performance, identify improvements, and track the success of marketing initiatives.
♀️ Question: How has the awareness of Brand Z changed over the past 6 months?
Insight sought: How has brand awareness changed for my business and competitors over time.
⏰ Time to insight: 2 minutes
✅ How it’s done: Using Similarweb’s search overview, I can quickly identify which brands in my chosen market have the highest brand awareness over any time period or location. I can view these stats as a custom market or examine brands individually.
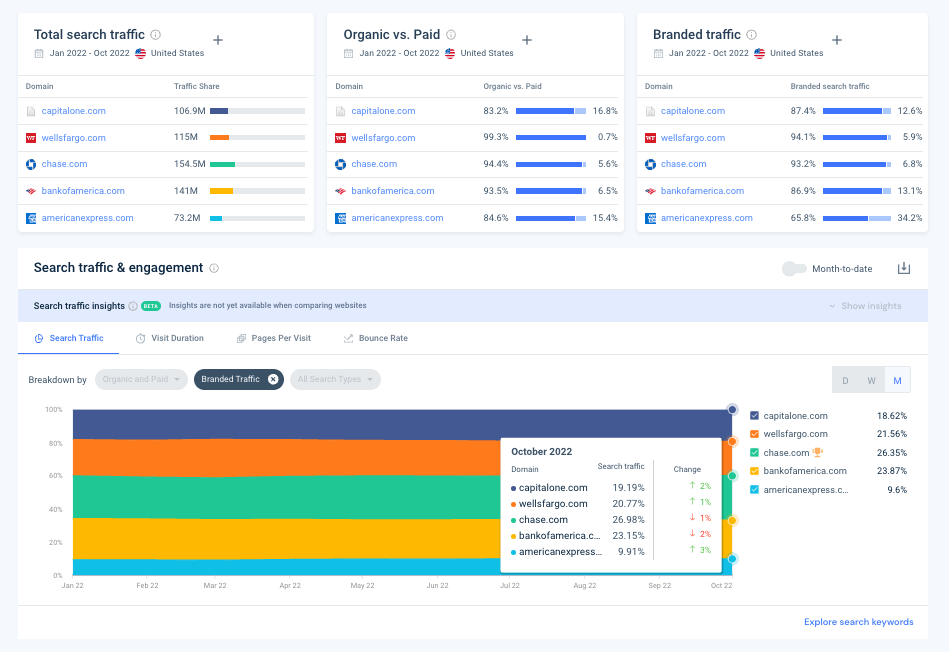
Here, I’ve chosen a custom view that shows me five companies side-by-side. In the top right-hand corner, under branded traffic, you get a quick snapshot of the share of website visits that were generated by branded keywords. A branded keyword is when a consumer types the brand name + a search term.
Below that, you will see the search traffic and engagement section. Here, I’ve filtered the results to show me branded traffic as a percentage of total traffic. Similarweb shows me how branded search volumes grow or decline monthly. Helping me answer the question of how brand awareness has changed over time.
Another example of using quantitative research to impact change and improve results is ad testing. It measures the effectiveness of different advertising campaigns. It’s often known as A/B testing, where different visuals, content, calls-to-action, and design elements are experimented with to see which works best. It can show the impact of different ads on engagement and conversions.
A range of quantitative market research questions can be asked and analyzed to determine the optimal approach.
Quantitative market research can be applied to measure and analyze the impact of social media on a brand’s awareness, engagement, and reputation. By tracking key metrics such as the number of followers, impressions, and shares, brands can:
♀️ Question: How does our brand compare to our competitors in terms of reach and engagement on social media?
Insight sought: The social channels that most effectively drive traffic and engagement in my market
⏰ Time to insight: 30 seconds
✅ How it’s done: Similarweb Web Intelligence shows you a marketing channels overview at both an industry and market level. With it, you can view the most effective social media channels in any industry and drill down to compare social performance across a custom group of competitors or an individual company.
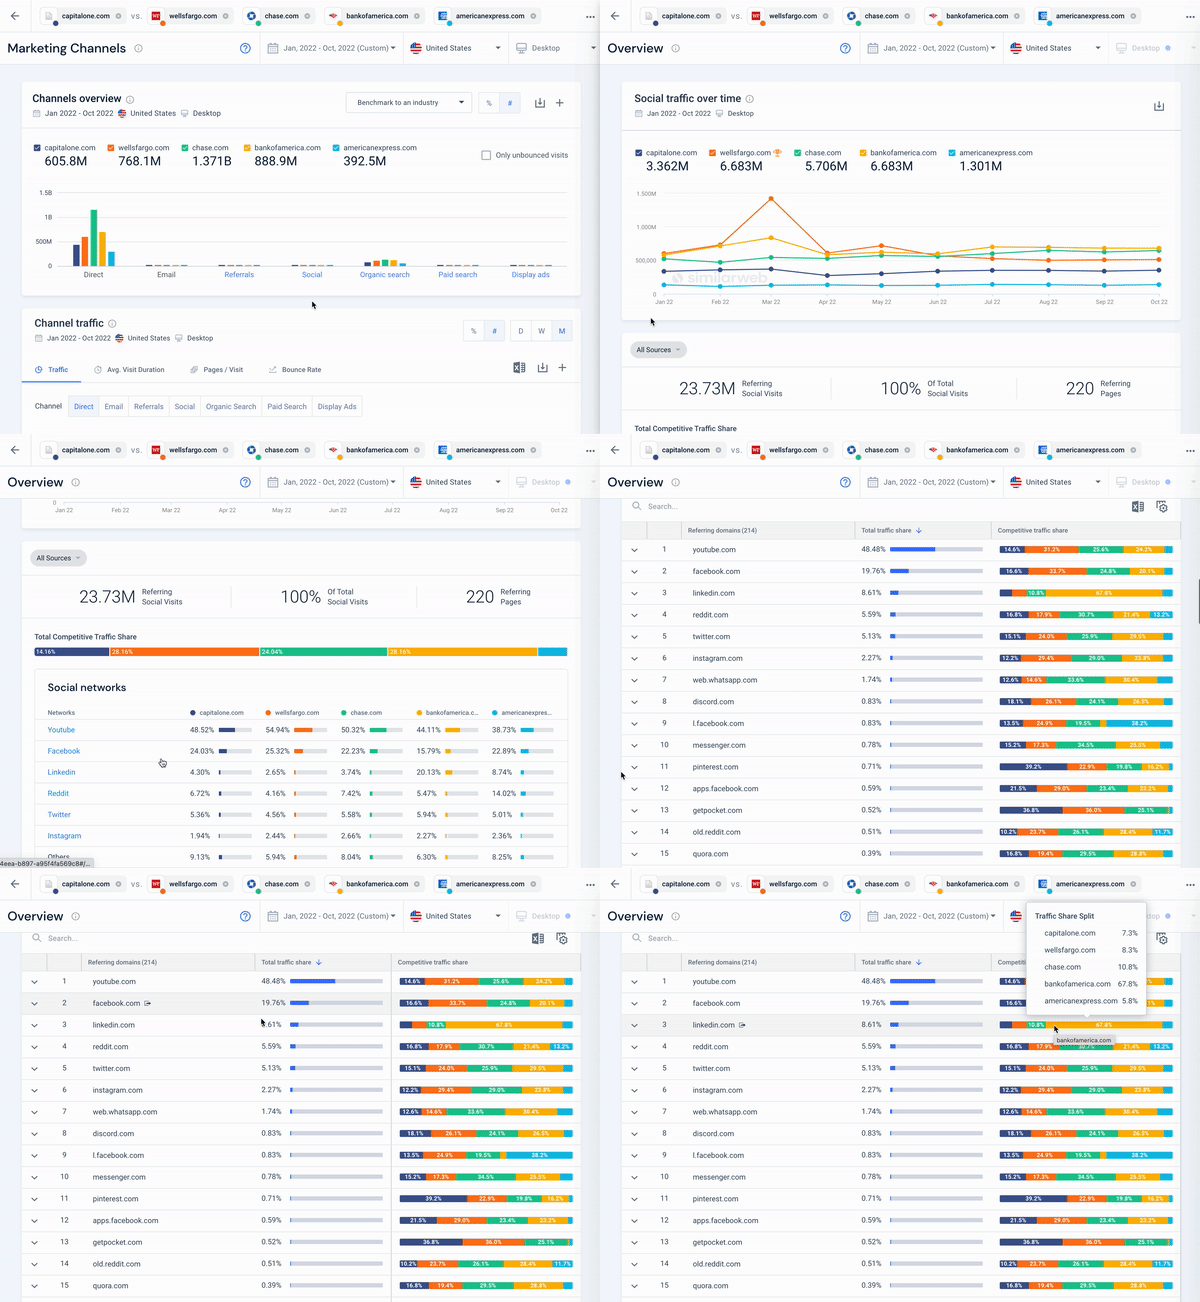
Here, I’ve taken the five closest rivals in my market and clicked to expand social media channel data. Wells Fargo and Bank of America have generated the highest traffic volume from social media, with over 6.6 million referrals this year. Next, I can see the exact percentage of traffic generated by each channel and its relative share of traffic for each competitor. This shows me the most effective channels are YouTube, Facebook, LinkedIn, and Reddit – in that order.
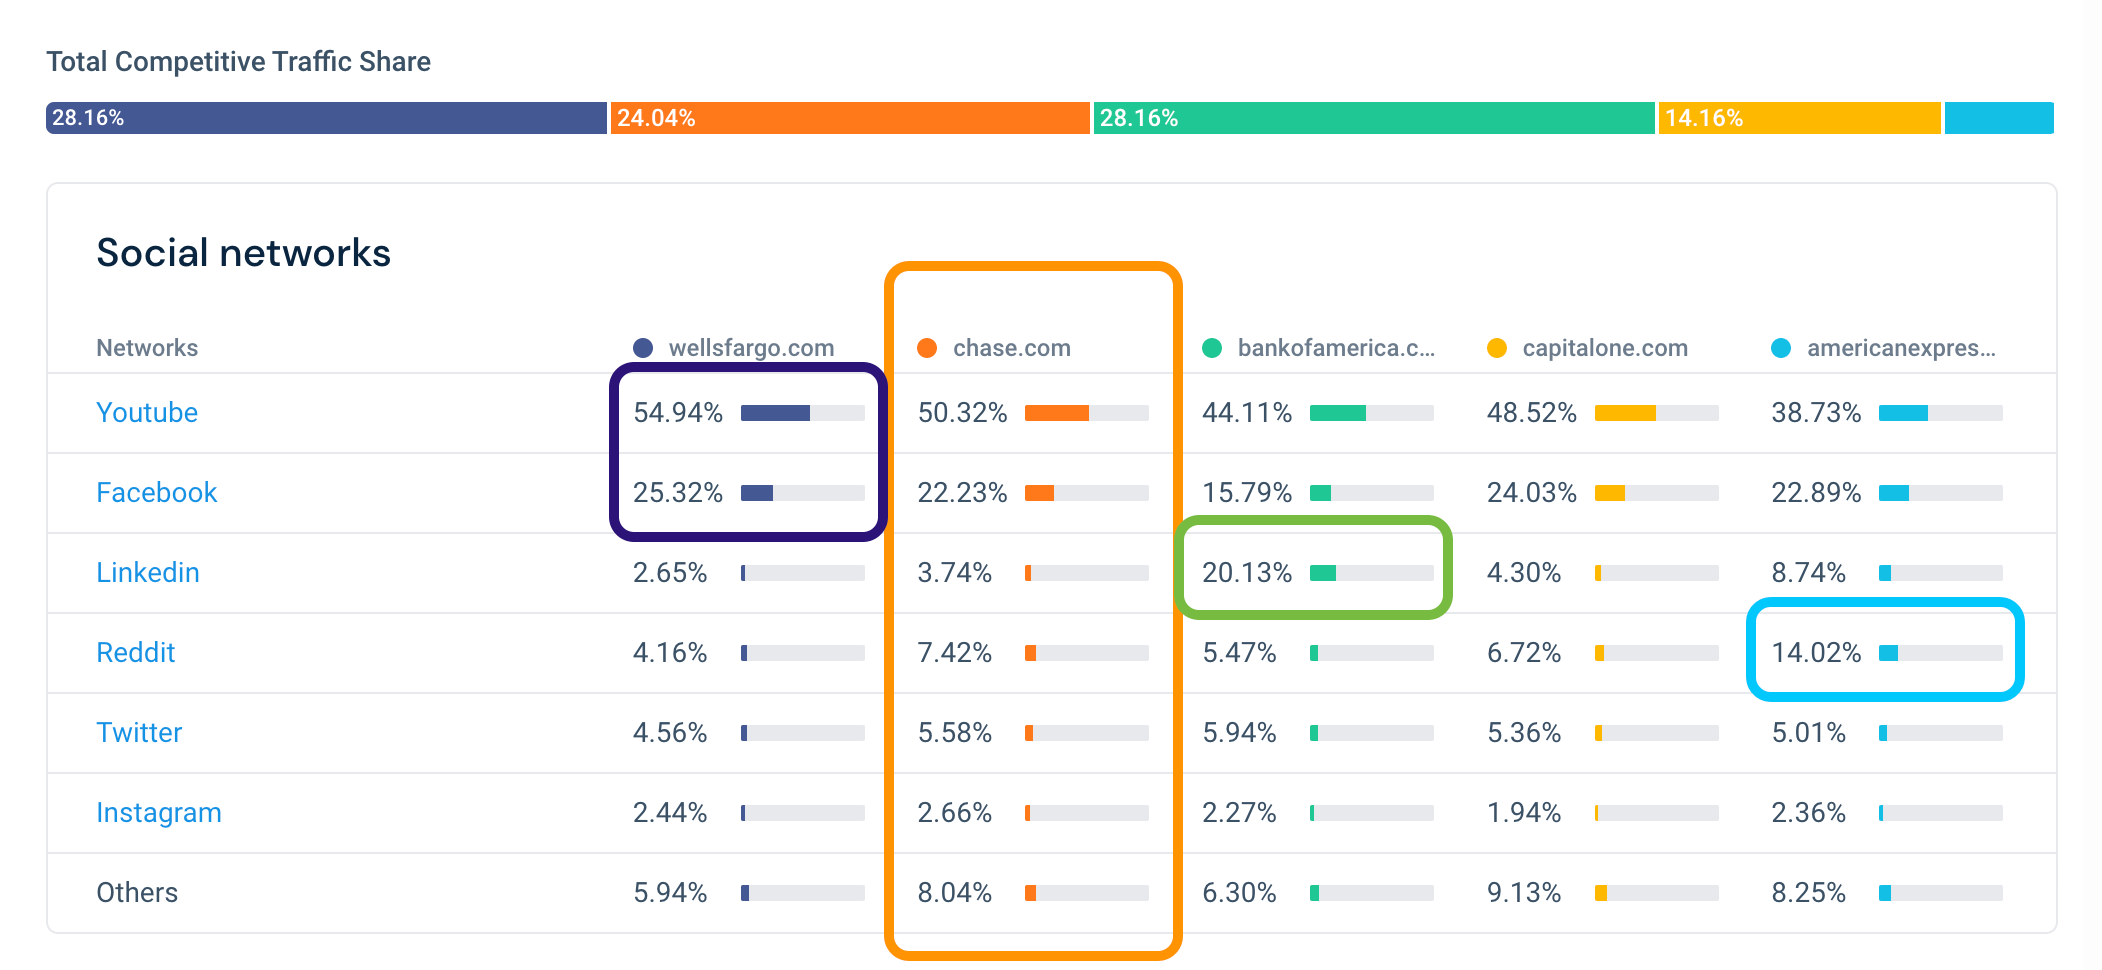
I can see four clear opportunities to review in more detail using this data. Wells Fargo is doing more business via Youtube and Facebook. Bank of America is attracting around 16% more traffic via LinkedIn, and American Express is getting 7% more traffic via Reddit.
In 30-seconds, I’ve discovered the following:
This is one of the oldest known uses of quantitative market research. It dates back to the 19th century when they were first used in America to try and predict the outcome of the presidential elections.

Polls are just short versions of surveys but provide a point-in-time perspective across a large group of people. You can add a poll to your website as a widget, to an email, or if you’ve got a budget to spend, you might use a company like YouGov to add questions to one of their online polls and distribute it to an audience en-masse.
These research studies measure how people look and respond to different websites or ad elements. It’s traditionally an example of quantitative research used by enterprise firms but is becoming more common in the SMB space due to easier access to such technologies.
Segmentation is becoming more important as organizations large and small seek to offer more personalized experiences. Effective segmentation helps businesses understand their customer’s needs–which can result in more targeted marketing, increased conversions, higher levels of loyalty, and better brand awareness.

If you’re just starting to segment your market, and want to know the best quantitative research questions to ask to help you do this, here are 20 to choose from.
These questions are ideal to ask once you’ve already defined your segments. We’ve written a useful post that covers the ins and outs of what market segmentation is and how to do it.
I’ve covered ten use cases for quantitative questions in detail. Still, there are other instances where you can put quantitative research to good use.
Product usage studies: Measure how customers use a product or service.
Preference testing: Testing of customer preferences for different products or services.
Sales analysis: Analysis of sales data to identify trends and patterns.
Distribution analysis: Analyzing distribution channels to determine the most efficient and effective way to reach customers.
Focus groups: Groups of consumers brought together to discuss and provide feedback on a particular product, service, or marketing campaign.
Consumer interviews: Conducted with customers to understand their behavior and preferences better.
Mystery shopping: Mystery shoppers are sent to stores to measure customer service levels and product availability.
Conjoint analysis: Analysis of how consumers value different attributes of a product or service.
Regression analysis: Statistical analysis used to identify relationships between different variables.
A/B testing: Testing two or more different versions of a product or service to determine which one performs better.
Brand equity studies: Measure, compare and analyze brand recognition, loyalty, and consumer perception.
Exit surveys: Collect numerical data to analyze employee experience and reasons for leaving, providing insight into how to improve the work environment and retain employees.
Price sensitivity testing: Measuring responses to different pricing models to find the optimal pricing model, and identify areas if and where discounts or incentives might be beneficial.
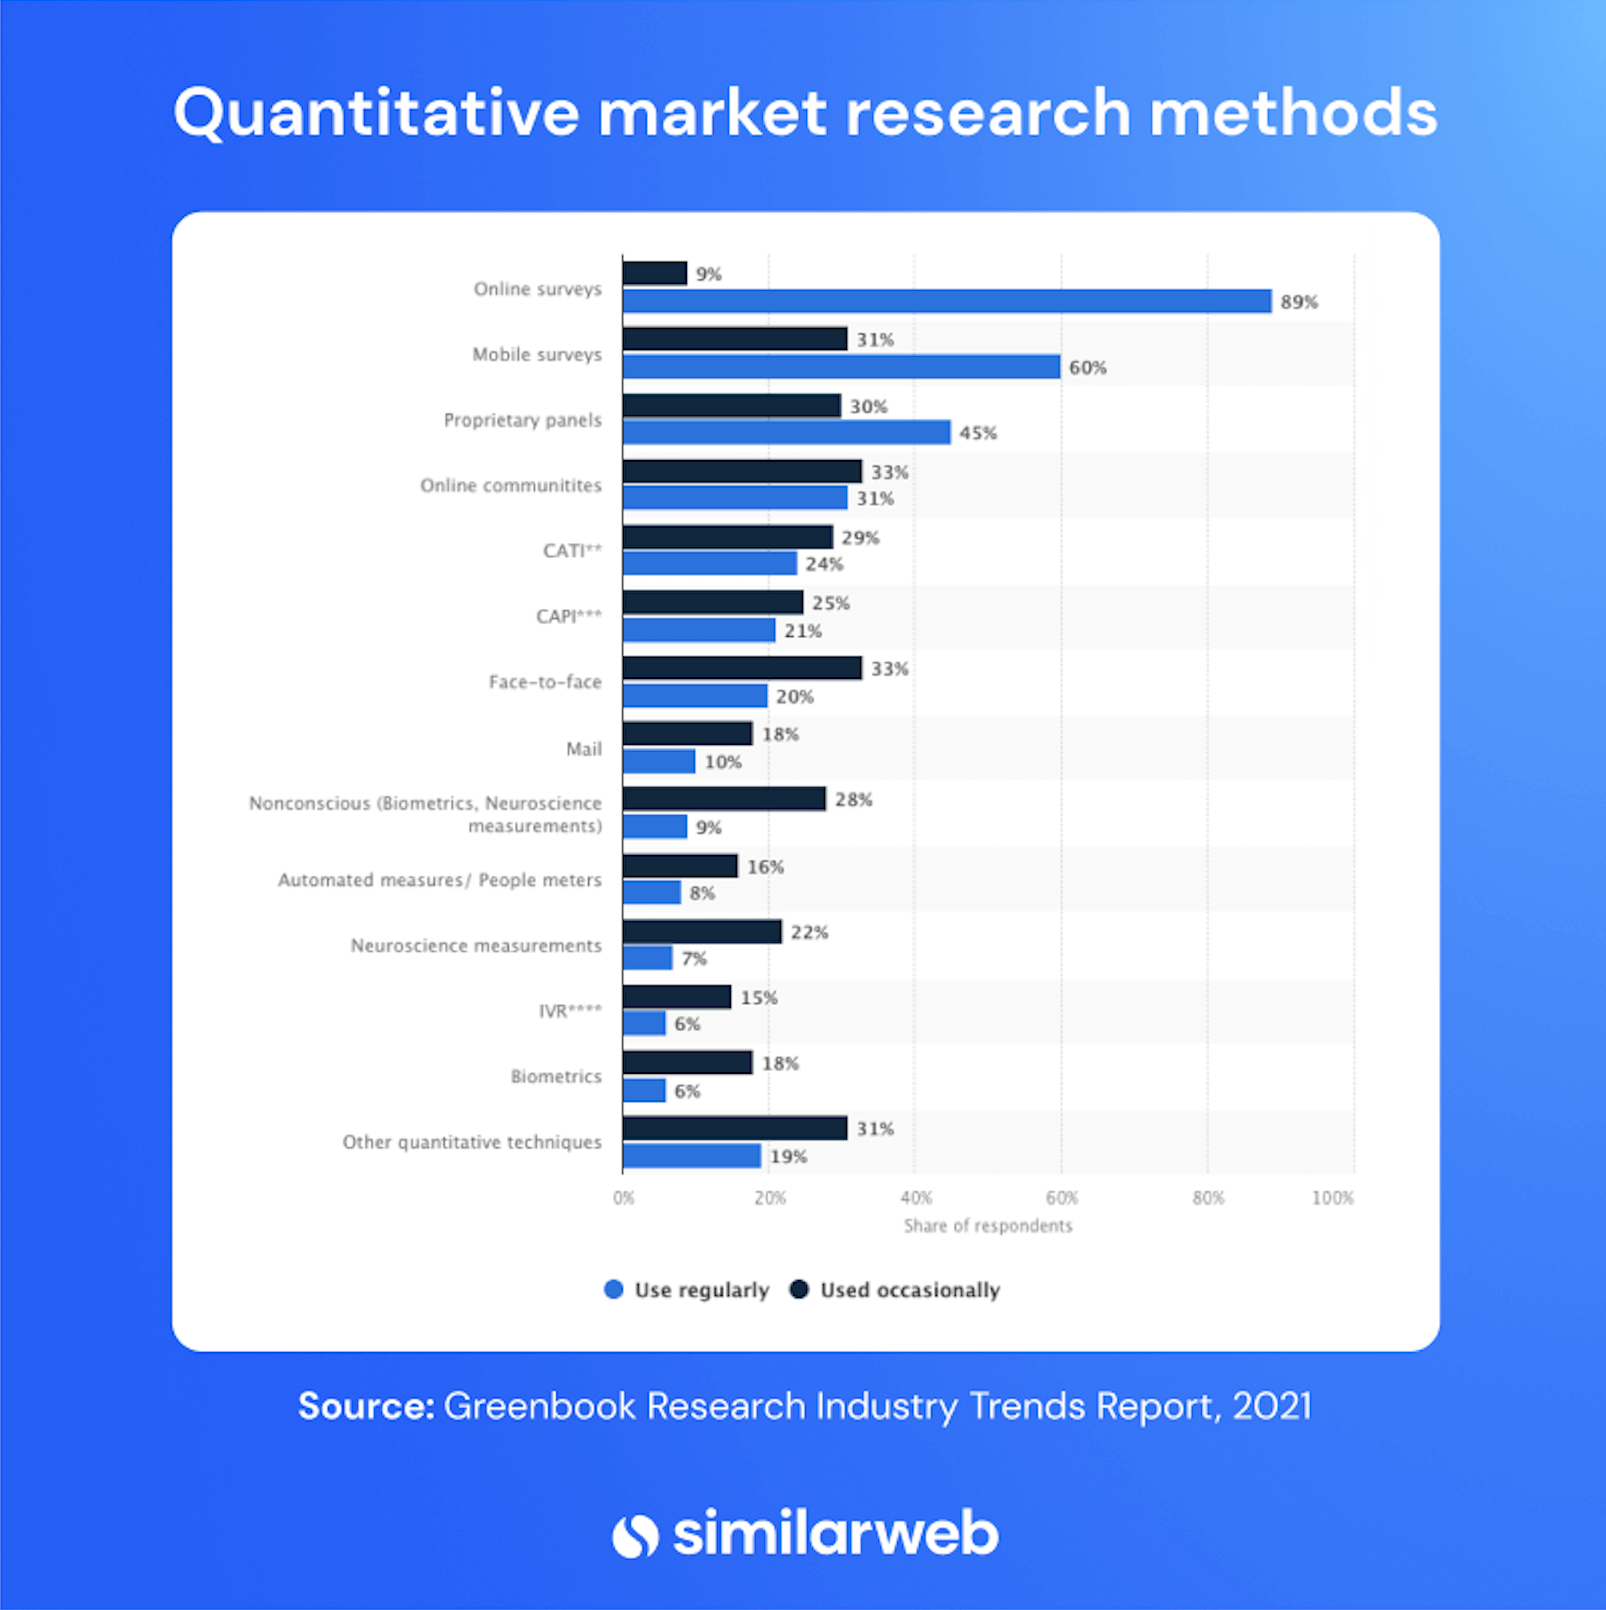
A recent GreenBook study shows that 89% of people in the market research industry use online surveys frequently–and for good reason. They’re quick and easy to set up, the cost is minimal, and they’re highly scalable too.
Questions are always formatted to provide close-ended answers that can be quantified. If you wish to collect free-text responses, this ventures into the realm of qualitative research. Here are a few examples.
Brand Loyalty Surveys: Companies use online surveys to measure customers’ loyalty to their brand. They include questions about how long an individual has been a customer, their overall satisfaction with the service or product, and the likelihood of them recommending the brand to others.
Customer Satisfaction Surveys: These surveys may include questions about the customer’s experience, their overall satisfaction, and the likelihood they will recommend a product or service to others.
Pricing Studies: This type of research reveals how customers value their products or services. These surveys may include questions about the customer’s willingness to pay for the product, the customer’s perception of the price and value, and their comparison of the price to other similar items.
Product/Service Usage Studies: These surveys measure how customers use their products or services. They can include questions about how often customers use a product, their preferred features, and overall satisfaction.
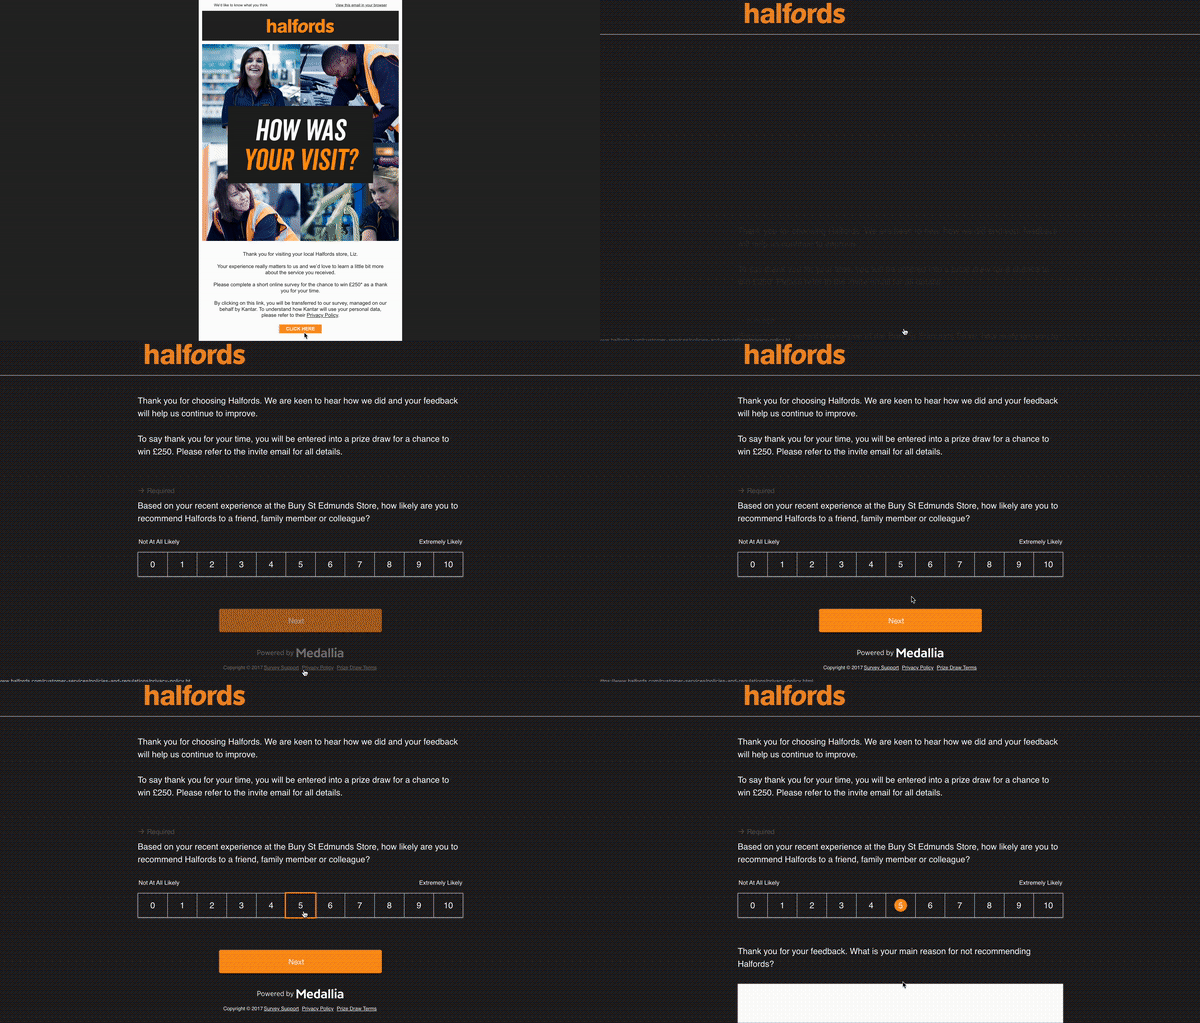
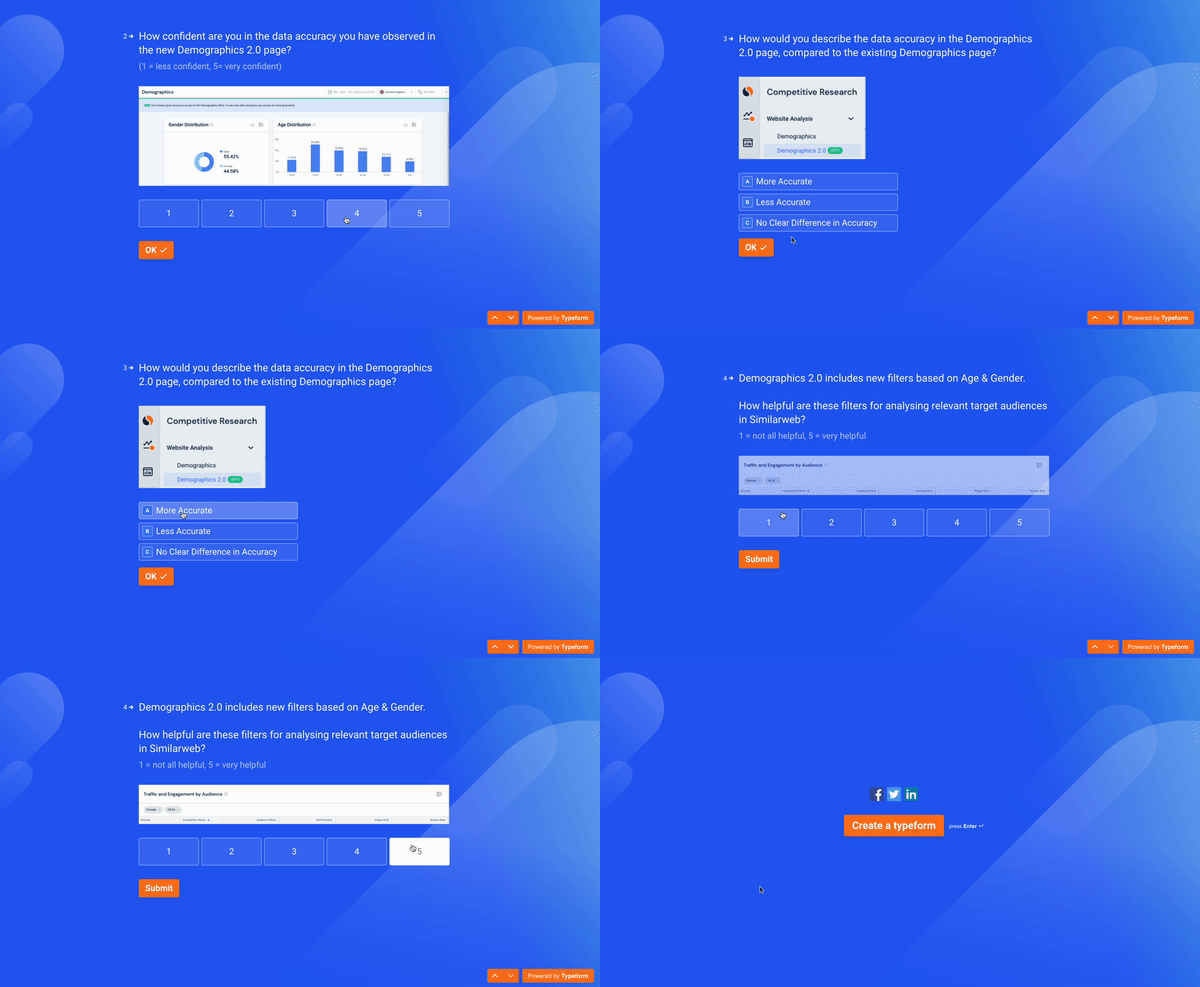
Here’s an example of a typical survey we’ve used when testing out potential features with groups of clients. After they’ve had the chance to use the feature for a period, we send a short survey, then use the feedback to determine the viability of the feature for future release.
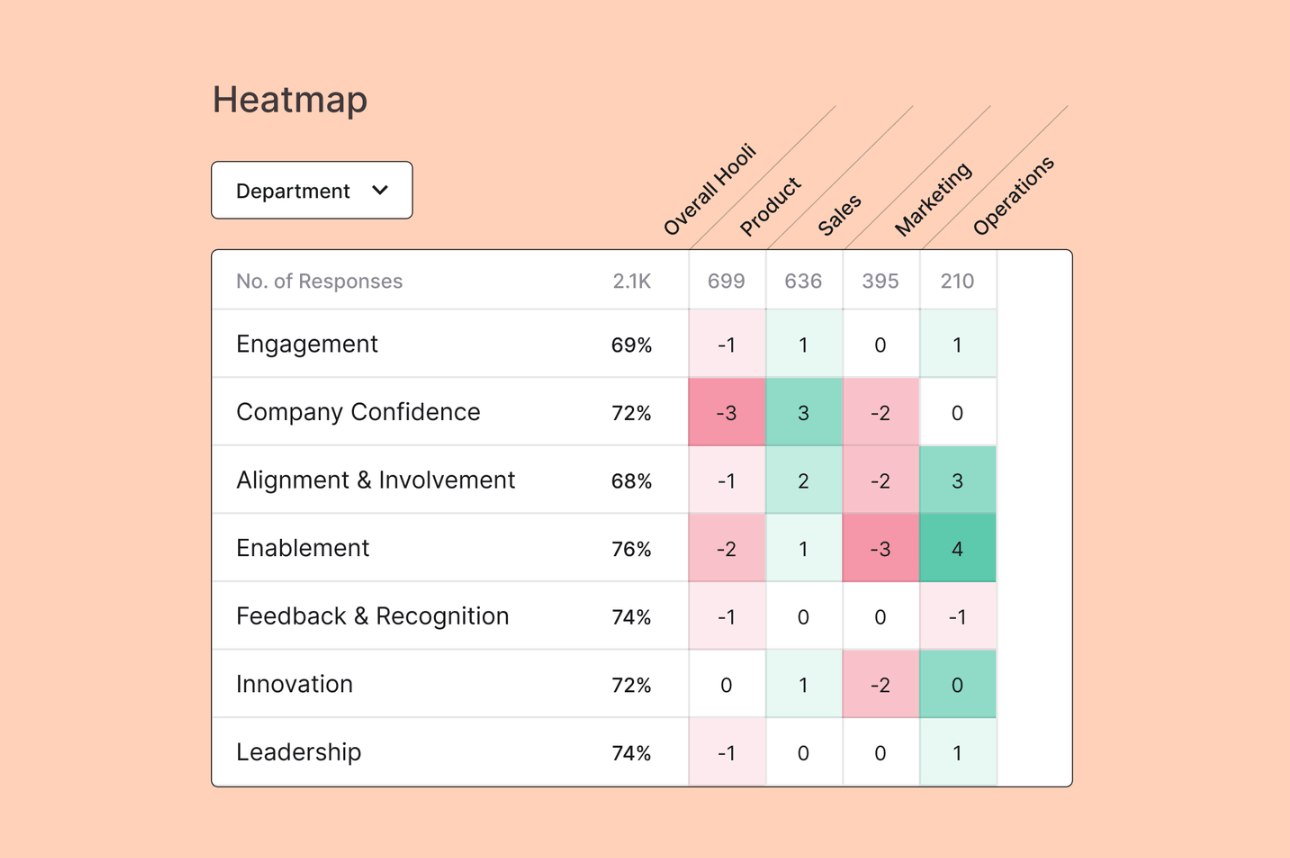
Employee Experience Surveys: Another great example of quantitative data in action, and one we use at Similarweb to measure employee satisfaction. Many online platforms are available to help you conduct them; here, we use Culture AMP. The ability to manipulate the data, spot patterns or trends, then identify the core successes and development areas are astounding.
For the vast majority of applications I’ve covered in this post, there’s a more modern, quicker, and more efficient way to obtain similar insights online. Gone are the days when companies need to use expensive outdated data or pay hefty sums of money to market research firms to conduct broad studies to get the answers they need.
By this point, I hope you’ve seen how quick and easy it is to use Similarweb to do market research the modern way. But I’ve only scratched the surface of its capabilities.
Take two to watch this introductory video and see what else you can uncover.
Added bonus: Similarweb API
If you need to crunch large volumes of data and already use tools like Tableau or PowerBI, you can seamlessly connect Similarweb via the API and pipe in the data. So for faster analysis of big data, you can leverage Similarweb data to use alongside the visualization tools you already know and love.
Similarweb’s suite of market intelligence solutions offers unbiased, accurate, honest insights you can trust. With a world of data at your fingertips, use Similarweb Web Intelligence to uncover facts that help inform your research and strengthen your position.
Take a look at:
Wrapping up
Today’s markets change at lightning speed. To keep up and succeed, companies need access to insights and intel they can depend on to be timely and on-point. While quantitative market research questions can and should always be asked, it’s important to leverage technology to increase your speed to insight, and thus improve reaction times and response to market shifts.
What is quantitative market research?
Quantitative market research is a form of research that uses numerical data to gain insights into the behavior and preferences of customers. It is used to measure and track the performance of products, services, and campaigns.
How does quantitative market research help businesses?
Quantitative market research can help businesses identify customer trends, measure customer satisfaction, and develop effective marketing strategies. It can also provide valuable insights into customer behavior, preferences, and attitudes.
What types of questions should be included in a quantitative market research survey?
Questions in a quantitative market research survey should be focused, clear, and specific. Questions should be structured to collect quantitative data, such as numbers, percentages, or frequency of responses.
What methods can be used to collect quantitative market research data?
Common methods used to collect quantitative market research data include surveys, interviews, focus groups, polls, and online questionnaires.
What are the advantages and disadvantages of using quantitative market research?
The advantages of using quantitative market research include the ability to collect data quickly, the ability to analyze data in a structured way, and the ability to identify trends. Disadvantages include the potential for bias, the cost of collecting data, and the difficulty in interpreting results.

by Liz March
Digital Research Specialist
Liz March has 15 years of experience in content creation. She enjoys the outdoors, F1, and reading, and is pursuing a BSc in Environmental Science.
Top Ecommerce Companies in the USA: The 100 Brands Winning the Traffic Race in 2026

3 of the Sharpest Minds Weigh in on the State of Gen AI in 2026

Contact us to set up a call with a market research specialist
