




by Darrell Mordecai4 Min.
Oct 21, 2026
 Marketing Intelligence
Every business, no matter the industry or size, faces competition.
If you don’t know what your competitors are up to, you could be missing out on easy opportunities to improve your online performance, grow market share, and get ahead of your competitors. That’s why I always emphasize that conducting a competitive analysis is essential to your business success. This process gives you the insights you need to respond quickly to changes in your market and capitalize on trends before it’s too late.
But here’s the question I hear most often: What should you focus on, and when you do collect information, how should you act on it?
That’s precisely where data-backed competitive analysis becomes a game-changer.
I like to compare it to a sports team preparing for a championship game. Coaches do extensive research throughout the season. They study game footage and build scouting reports on every player on the opposite team to identify their weaknesses and develop an effective plan of attack. Think of the competitive analysis as your competitors’ playbook: an important toolkit that equips you with a strategy for success.
In this guide, I’ll walk you through a step-by-step approach to competitive analysis, everything from the basics to advanced tools and tips.
You’ll learn how to conduct a thorough analysis of your business and translate your insights into actions that drive meaningful growth.
Ready to dive in?
Competitive analysis is the process of gathering, researching, and evaluating data about your market and your competitors’ core strategies. This data ranges from product offerings, positioning, and sales tactics to pricing models, go-to-market strategies, and more. The analysis allows you to uncover insights into competitors’ strengths, understand their strategic choices, and identify any gaps in your own strategy and focus areas.
These insights empower you to make informed, impactful business decisions that give you a competitive edge, helping you view the market landscape with clarity and revealing new avenues for growth.
In a nutshell: competitive analysis gives you the insights you need to make smart, impactful decisions that put you ahead. It helps you see the big picture, revealing new ways to grow and stay competitive.
But that’s not always easy. Gathering the data can be a challenge, and once you have it, new questions seem to pop up all the time:
If this sounds familiar, you’re not alone. When I first started with competitive analysis, I felt swamped by all the details and kept finding more questions than answers. But once you get the hang of it, you’ll have a powerful way to understand your market and make more confident decisions.
Before we continue, you can start by making a copy of the Similarweb Competitive Analysis Template. It will serve as your framework for analyzing your digital performance and comparing it to key competitors.
Business is inherently competitive, and your marketing strategies don’t exist in isolation. Be assured, your competitors aren’t likely to give up a piece of the pie without a fight. So, how do you increase your market share?
Well, a thorough competitive analysis can uncover valuable insights to help you:
But here’s the key: you need to go beyond surface-level research. This means analyzing your competitors’ products and their marketing strategies. After all, the more thoroughly you understand their business model, the better you’ll understand their strengths and weaknesses. Should you compete head-on in their space? Or should you carve out an underserved niche where you can capitalize on micro-consumer demand?
The answer, of course, lies in research. Whether you’re launching a new product or growing an existing business, you need a deep understanding of your competitive landscape to make informed decisions that drive growth.
Now that you understand why you need competitive analysis, here are some of the benefits you can expect.
Digging into your competitors’ marketing strategies isn’t just about finding their weaknesses; it’s about understanding where they’re actually ahead of you and figuring out your next move. This could be in their marketing approach, product features, or something else they’re doing better. The more you know about their strengths and weaknesses, the more you can leverage that insight to win back market share.
Your competitors might serve your target audience in ways you never thought possible. Looking at their products and services will not only help you think of product ideas but also give you insight into what your prospects really need. The better you understand your audience, the more likely you are to satisfy them.
Competitive analysis helps you stay attuned to industry shifts because it forces you to carefully study new tactics, products, or technologies your competitors are testing. Catching these trends early empowers you to stay ahead of the curve and position your business as a forward-thinking leader in your market.
Running a business without data you can trust is like flying blind. Having high-quality, accurate data and using that for your competitor research helps you clearly see your competitive landscape and develop a strategy that takes into account both your competitors and your target audience.
Every industry has its tried-and-true methods, and studying your competitors’ strategies shows you what’s working and how you might adapt those marketing tactics for your own goals. Competitive analysis doesn’t just influence your overall game plan, it also shapes the everyday marketing moves that bring that strategy to life.
Before diving into competitor tactics, let’s start with the foundation: understanding your market landscape. Taking a methodical approach to collecting and analyzing market information reveals not just who you’re up against, but also how different market forces interact and influence each other.
You can divide your competitor research into four main areas of competition:
In the following section, we’ll show you how to analyze your competitors systematically. We’ll start with the big-picture metrics and slowly work our way down to the specific tactical approaches your competitors are taking to achieve the results they are getting. To do that, we’ll be using a combination of data from competitor analysis tools and traditional market analysis methods.
I always start by mapping out companies that offer a product or service in the same category as mine. Then, I prepare a list of competitors and categorize them into different levels using three main factors:
When you approach this task, keep in mind there are two main types of competitors: direct and indirect. Then, in addition to these, there are also replacement competitors and potential competitors.
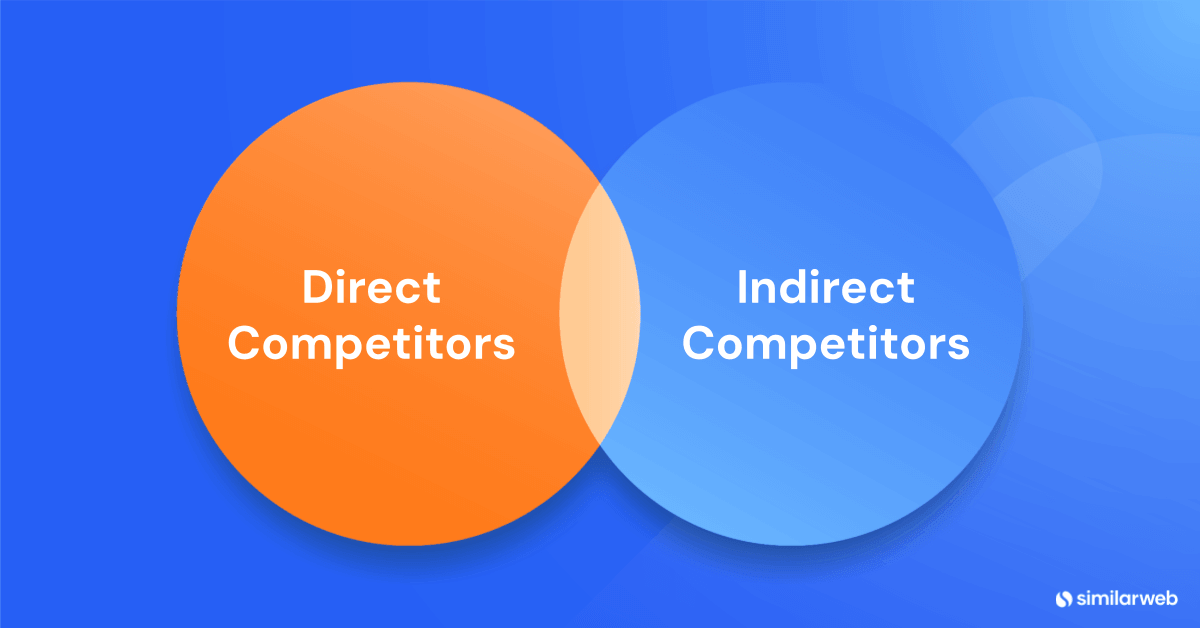
Your primary competitors fall into this category. These are businesses that are identical to yours in all three areas: they have the same target audience, offer a solution for the same problem, and are in the same product category. For instance, if you sell orthopedic shoes for kids, direct competitors would include other ecommerce sites or brands with similar products.
Indirect competitors overlap in one or two of the three areas. For example, they may target the same audience and address the same problem but with a different product. Think, for example, of a company offering a surgical solution for the same condition that orthopedic footwear aims to support. While your focus should be on direct competitors, tracking indirect ones is also wise. Industries evolve quickly, and indirect competitors may pivot into your market or launch a complementary product or app at any point.
Substitutes are companies that solve the same core problem differently than you do. While they might target different audiences or take a different approach, they’re still competing for your customers’ attention and budget. Take physical therapy clinics and orthopedic shoe companies, both help people with foot pain, just through different solutions. Understanding these alternative competitors is crucial because they show you where your customers might turn if they’re not satisfied with traditional options in your market.
Keep an eye on potential competitors and companies that could enter your market tomorrow if they see an opportunity. Think of major footwear brands that don’t currently make orthopedic shoes. With their resources and distribution networks, they could launch an orthopedic line practically overnight. Staying alert to these sleeping giants helps you anticipate industry shifts and prepare for new competition before it arrives.
👉 Pro tip: Mapping out these different types of competitors shows you exactly where you stand in the market and helps you anticipate how each might try to win over your customers.
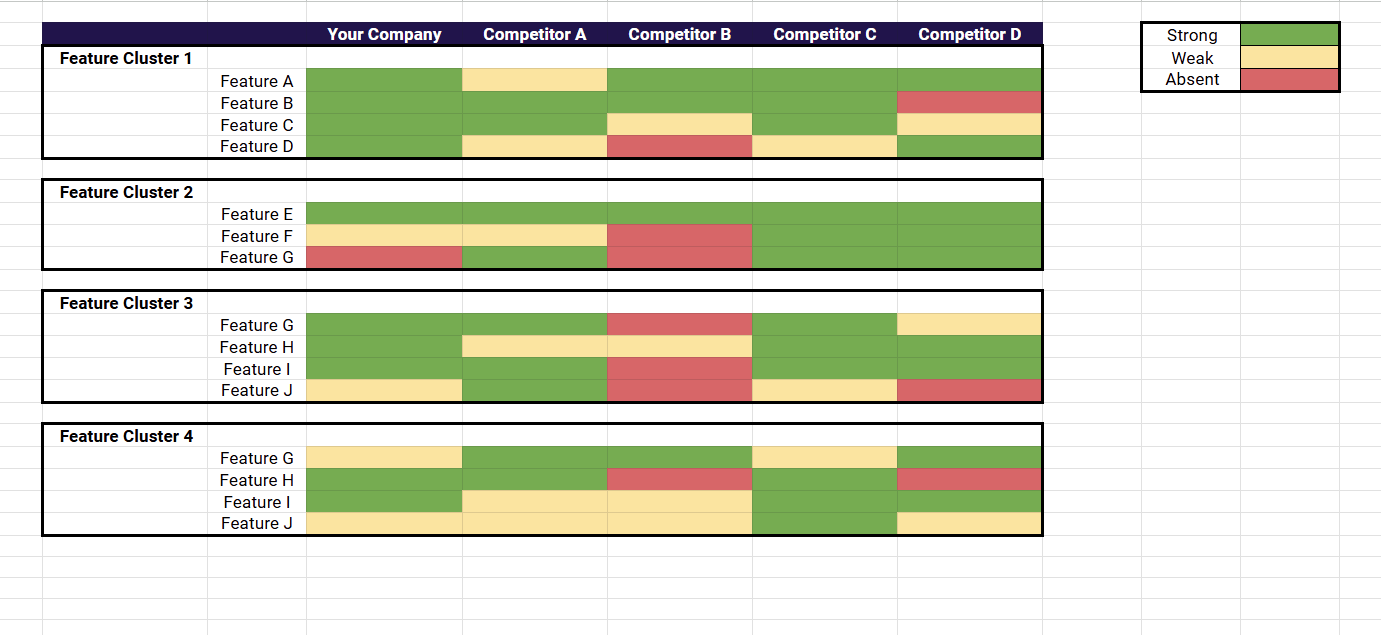
A competitive matrix is a simple but powerful tool that helps you visually compare your business to key competitors based on specific factors. It allows you to see at a glance where each competitor stands in critical areas and highlights opportunities where you might gain a competitive edge.
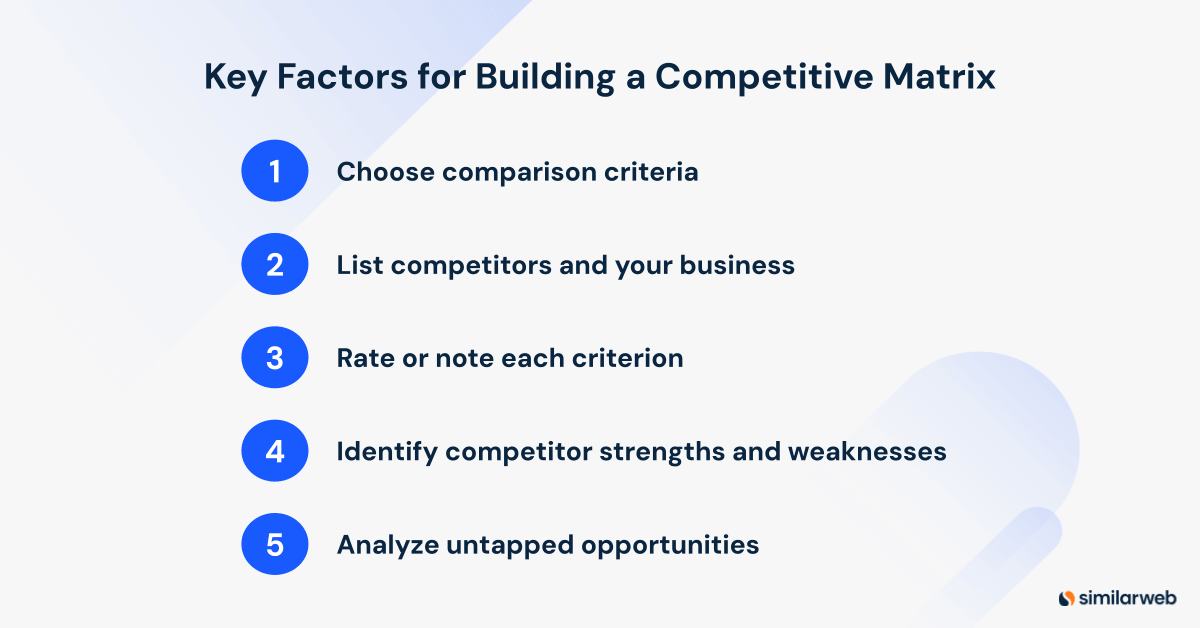
Here’s how to create and use a competitive matrix effectively:
Start by identifying the key factors you want to compare. These might include product features, pricing, target audience, market share, strengths, weaknesses, or unique selling points. Zero in on what truly drives buying decisions in your industry.
On one axis, list your business and each of your main competitors, including direct, indirect, replacement, and potential competitors, depending on what you want to analyze.
Assess each competitor on your list’s performance in each criterion. You can use a numerical rating, checkmarks, or brief notes. For example, if comparing product features, you might score each business on a scale from 1 to 5 or simply note the presence of specific features.
Once your matrix is complete, patterns should start to emerge. You’ll see where competitors are strongest and where there are gaps in the market. This helps you pinpoint your competitive advantages and identify areas for improvement or differentiation.
Use the matrix to look for opportunities to differentiate your business and marketing strategy. For instance, if most competitors lack customer support or a specific product feature, this could be a chance for you to differentiate yourself. Get a copy of our competitive matrix template.
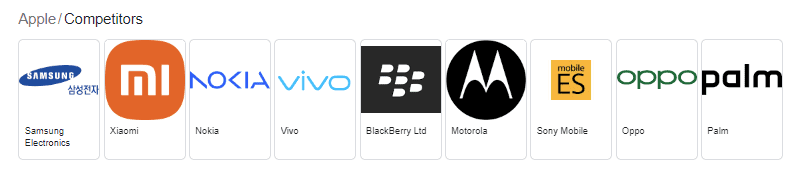
Finding your competitors starts with the simplest tool at your disposal: Google.
Run searches for keywords related to your business and see who shows up both in organic results and paid ads. For instance, typing in “[your brand] competitors” can reveal who Google thinks you’re competing with. However, Google can only take you so far.
Your sales team is a goldmine of competitor insights. They’re on the front lines, talking directly with customers who are weighing their options. They know exactly which competitors you’re up against and what questions prospects are asking about them.
👉 Pro tip: If your company uses a conversation intelligence platform like Gong, Chorus, or Clari, ask for access to relevant sales calls. You’ll hear firsthand which competitors come up most often, what objections prospects raise, and which competitor features get mentioned, intelligence that no public dataset can replicate.
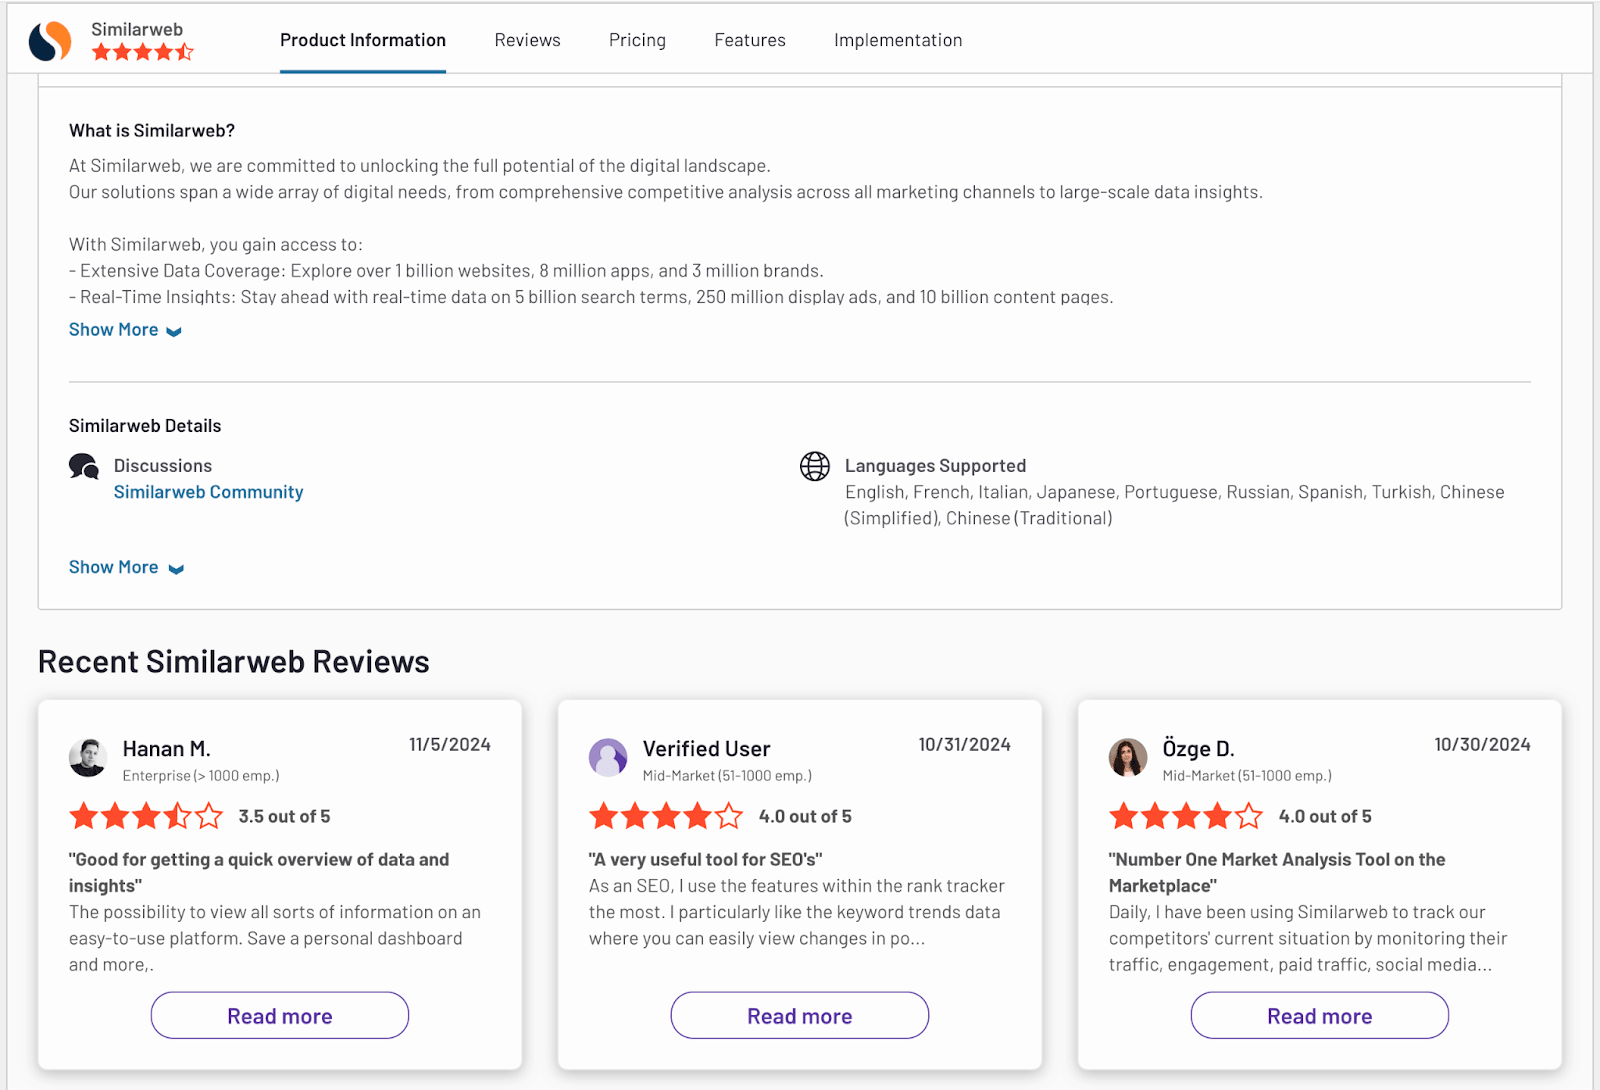
While reaching out to your customers takes more effort than checking in with your sales team, it’s one of the most valuable ways to gain competitive insights. You can use surveys, calls, or emails to connect with customers. Beyond direct outreach, check customer review sites like G2 or Capterra, the feedback shared by both your customers and your competitors’ customers on these platforms often reveals exactly the competitive insights you’re looking for.
One of the best ways to approach competitive analysis is by using a data-driven tool. It’s scalable and efficient, saving a lot of time, but remember: the data is only really relevant to your business if you can easily filter it to pull out what matters. Ultimately, trying to do this without the right tool won’t get you far and will cost you valuable time and money, which is why investing in the right one is absolutely crucial.
Let me show you how it works in practice. I’ll analyze Klook.com.
Klook has a warm place in my heart, as I used it a lot before and during my trip to Japan. The site made it very easy to get tickets to attractions, book train tickets, and more.
And it looks like I’m not the only one, let’s check out Klook’s web traffic over the last 12 months using Similarweb’s Website Analysis tool:
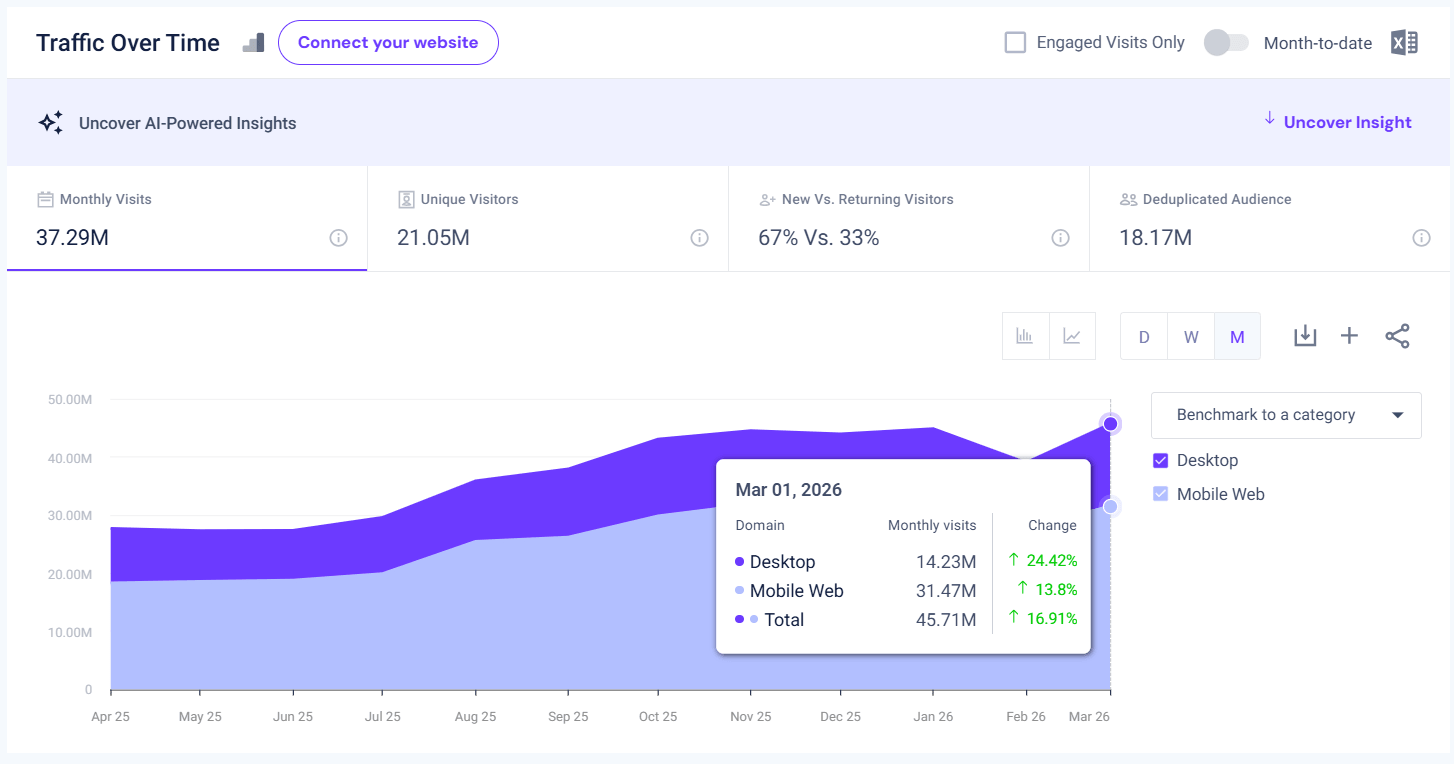
We can see that web traffic to klook.com has been steadily increasing since July 2025 (then the site had 27 million visitors, compared with almost 46 million in March 2026!).
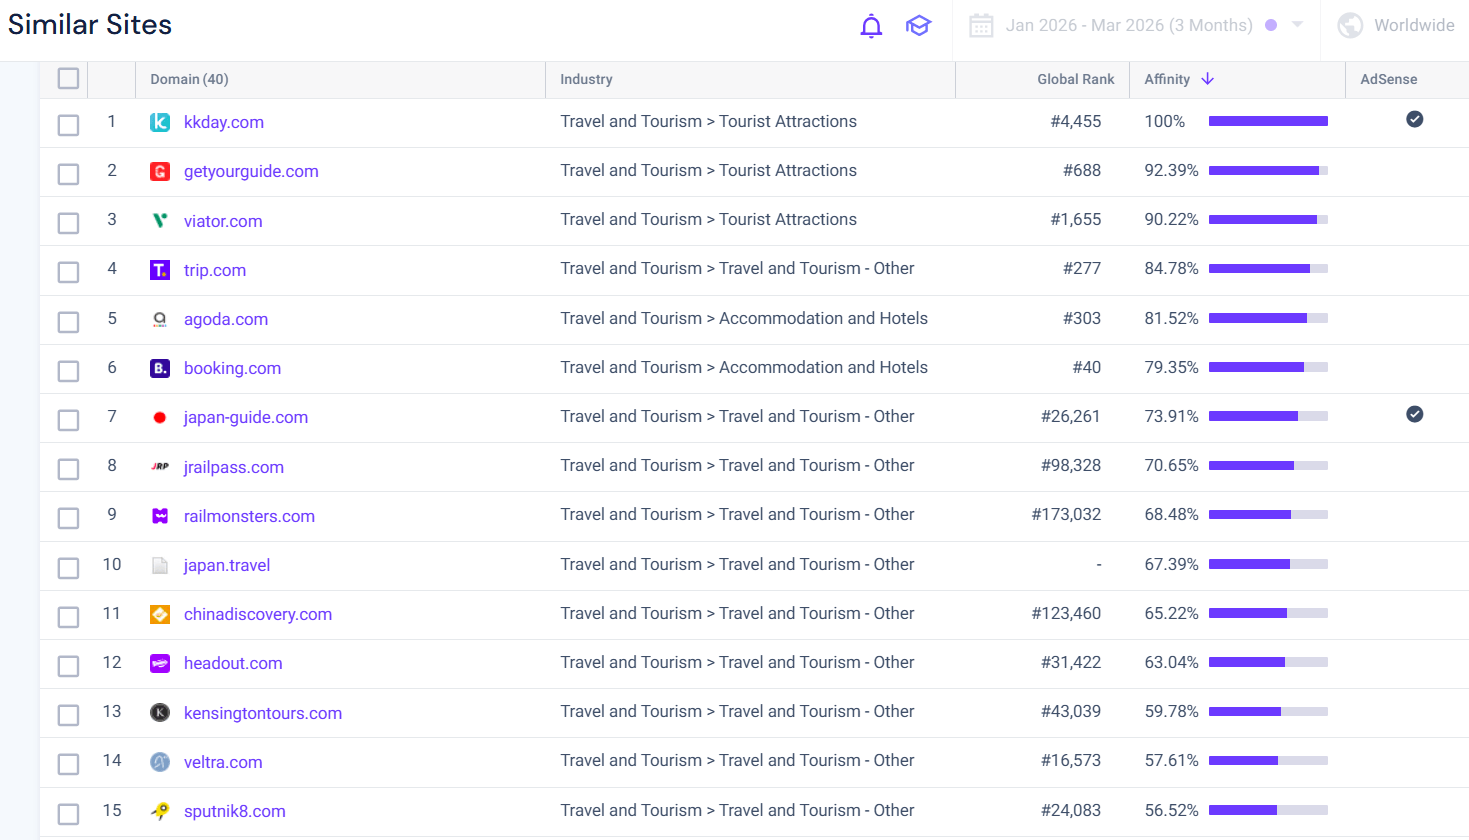
Next, let’s have a look at the Similar Sites report to get an overview comparison of Klook to its main competitors, based on content, audience, keywords, and referrals. Using multiple data points together helps you find your closest true competitors since no single factor tells the whole story.
Beyond data platforms, AI assistants have become genuinely useful research accelerators for competitive analysis. Here are three practical ways to integrate them:
The key caveat: always cross-check specific claims against primary sources before putting them in a deck. Read our guide for a deeper look at how AI is changing competitive analysis.
A site that targets similar keywords to yours isn’t necessarily a direct competitor. So, before analyzing organic competitor data, verify they’re actually serving your market. Use the Similarweb Organic Competitors report, which finds competitors based on keyword overlap. The industry and website type filters help you narrow down to the most relevant competitors for your business.
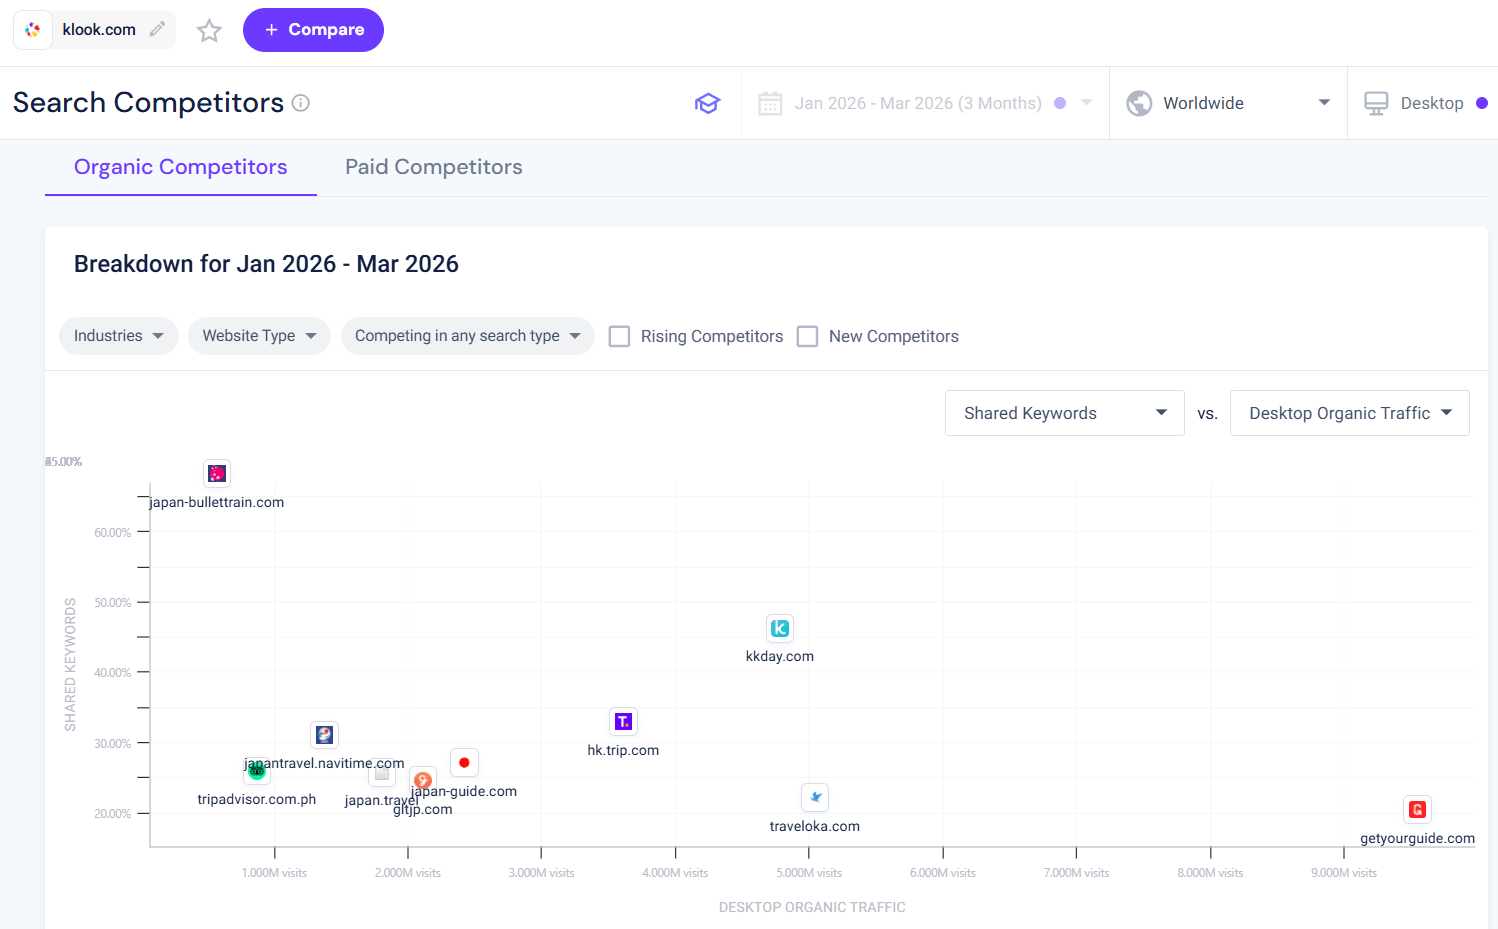
For Klook, this step quickly separates true competitors from sites that only happen to rank for similar travel terms. The Organic Competitors report shows that KKday stands out as Klook’s closest organic rival, combining the highest overlap score with 44.43% shared keywords and 4.78M desktop organic visits, which makes it a strong benchmark for side-by-side SEO analysis.
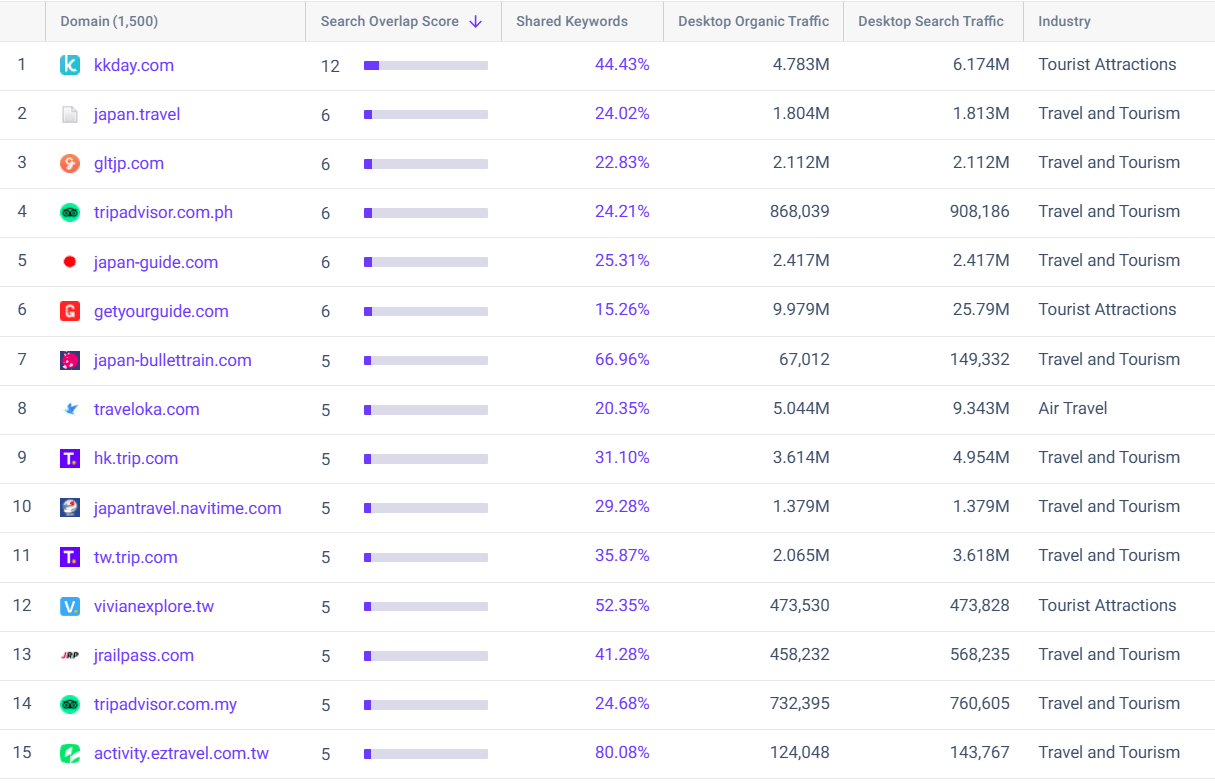
At the same time, larger players like GetYourGuide and Traveloka bring much higher organic traffic volumes, but with lower keyword overlap, suggesting they compete more broadly across travel discovery and bookings rather than mirroring Klook’s exact search footprint. There are also niche players such as japan-bullettrain.com, which shows very high keyword overlap but relatively little traffic, a sign that keyword similarity alone can be misleading unless you validate whether the site truly competes in your category and at your scale.
You should also look at which sites are running paid ads targeting your keywords. In the Similarweb Paid Competitors report, apply the same industry filter to focus on businesses in your space. This narrows your list to direct competitors who are actively running ads.
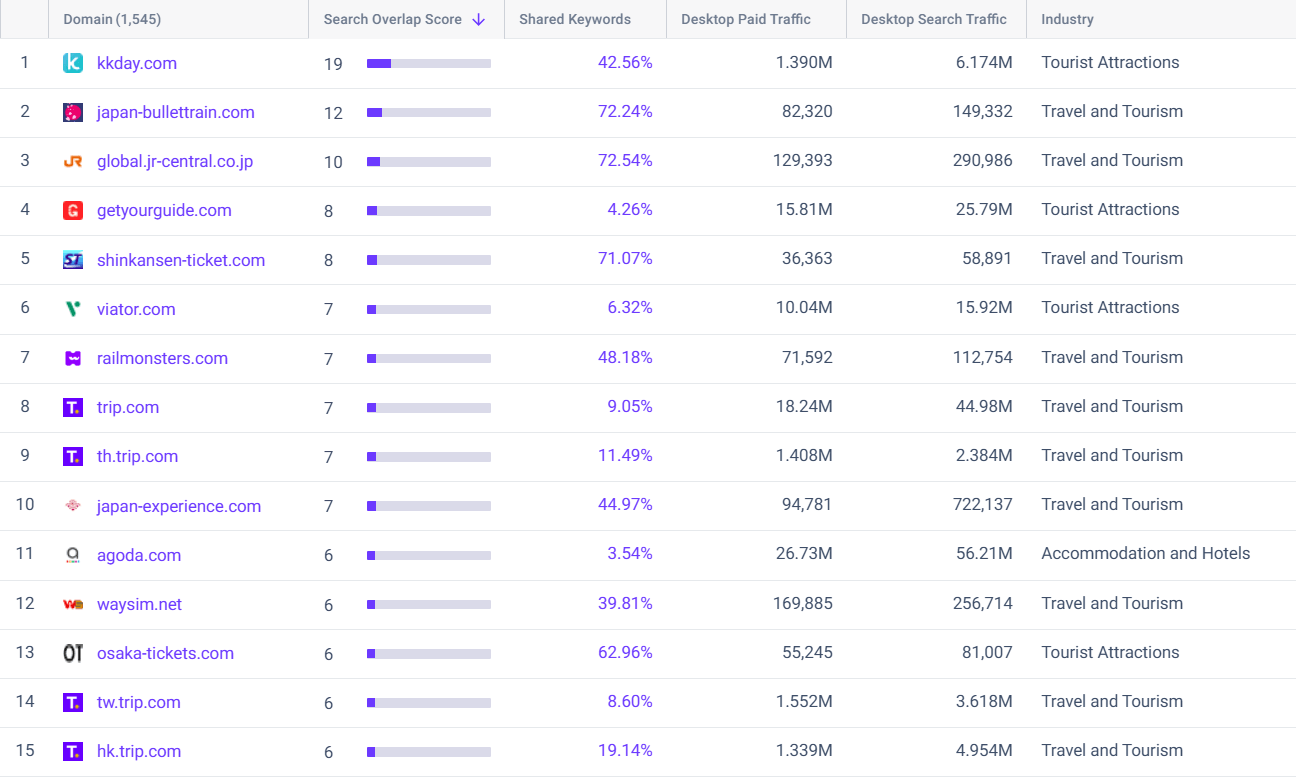
Looking at paid search tells a slightly different story. While KKday remains Klook’s closest competitor with a strong overlap of 42.56% and meaningful paid traffic, the biggest shift comes from large OTAs like Trip.com, Agoda, and Viator, which dominate in scale and drive tens of millions of paid visits. These players may not share as many keywords, but they compete aggressively on high-value, transactional terms.
At the same time, there is a layer of high-intent niche competitors such as japan-bullettrain.com, shinkansen-ticket.com, and osaka-tickets.com. These sites show very high keyword overlap, often above 60%, but relatively low traffic. This suggests they focus on specific booking queries like train tickets or local attractions, where user intent is strongest.
The takeaway is that in paid search, Klook is competing across two fronts. On one side are large travel platforms with significant budgets and reach. On the other are specialized providers that capture bottom-of-funnel demand through highly targeted keywords.
The SWOT analysis is my go-to framework for sizing up the competitive landscape. It looks at internal Strengths (S) and Weaknesses (W), plus external Opportunities (O) and Threats (T). Do this both for your business and your competitors. This simple framework helps you see the market clearly and make strategic decisions based on real competitive dynamics.
Through SWOT analysis, you’ll understand exactly where you stand: your vulnerabilities, your opportunities, and how market forces shape your competitive position.
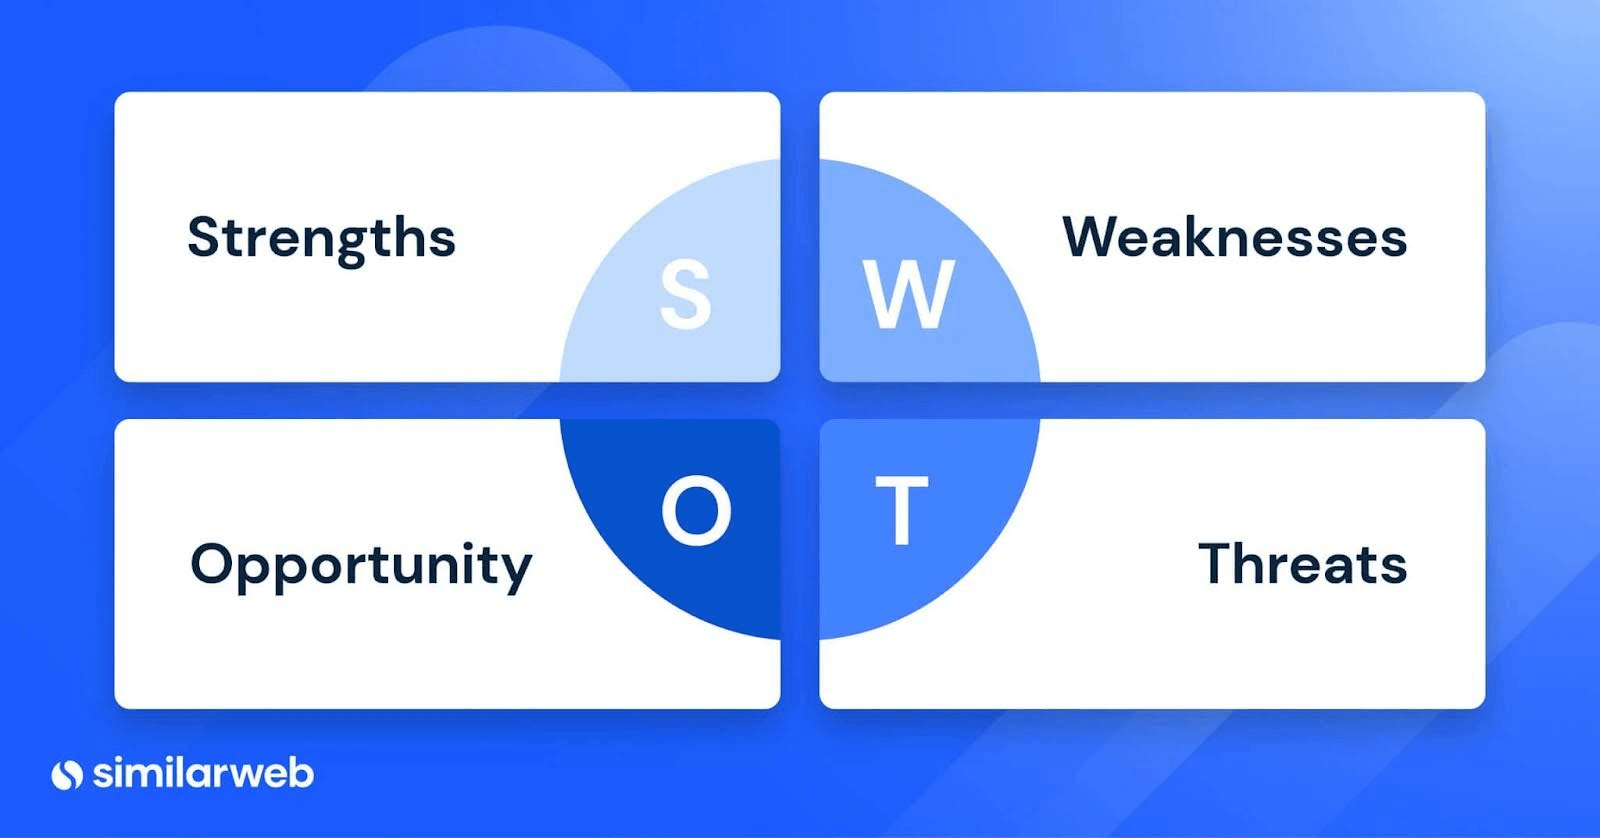
To get started, the best way is to set up a meeting room and a whiteboard and gather your team. Divide the whiteboard into four quadrants: Strengths (S), Weaknesses (W), Opportunities (O), Threats (T). Begin brainstorming and fill each quadrant with as many points as possible.
As I don’t work at Klook, I asked Claude to create a mock of how this might look after a roaring team session:
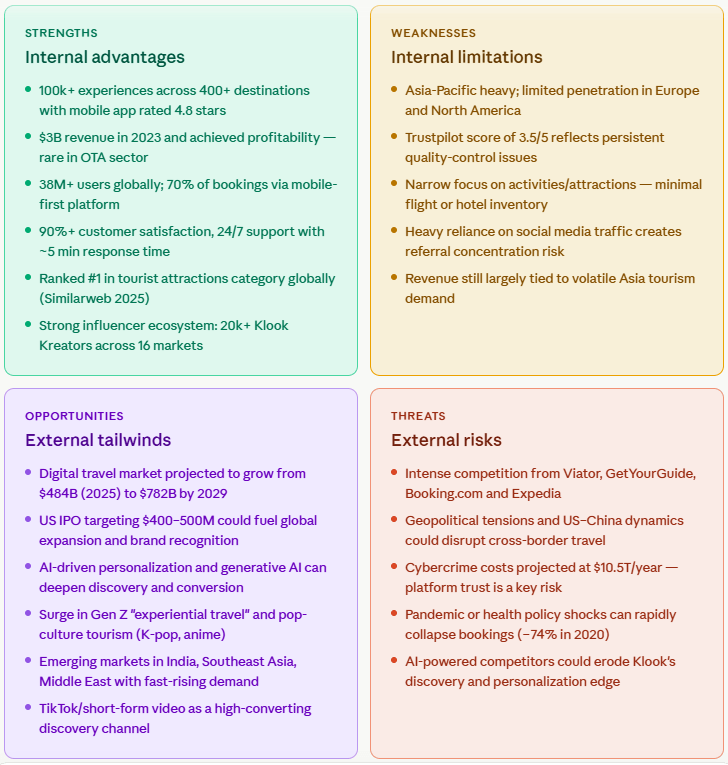
I recommend starting with opportunities and threats. Understanding these external factors gives you a clearer view of your competitive landscape. Then tackle your strengths and weaknesses, having those external factors already mapped out usually helps you spot internal factors that either address or relate to them.
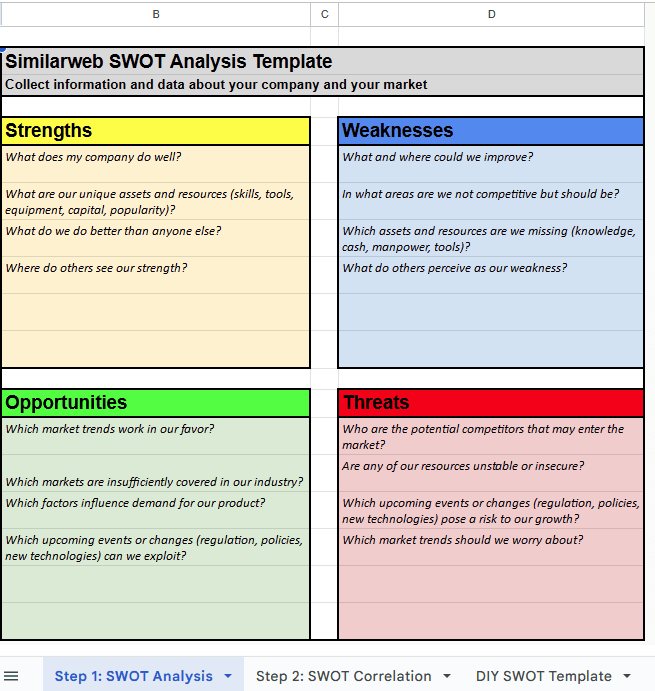
To get a copy of our SWOT analysis template, click here.
So far, we’ve analyzed your competitors. But to get a complete picture, you must also analyze their customers directly.
Understanding audience demographics is your first big-picture priority, since it shapes everything from pricing to tone to market positioning.
Let’s look at audience geography and demographics using the Audience tab in Similarweb’s Website Analysis tool. The Geography report shows each competitor’s traffic share by country.
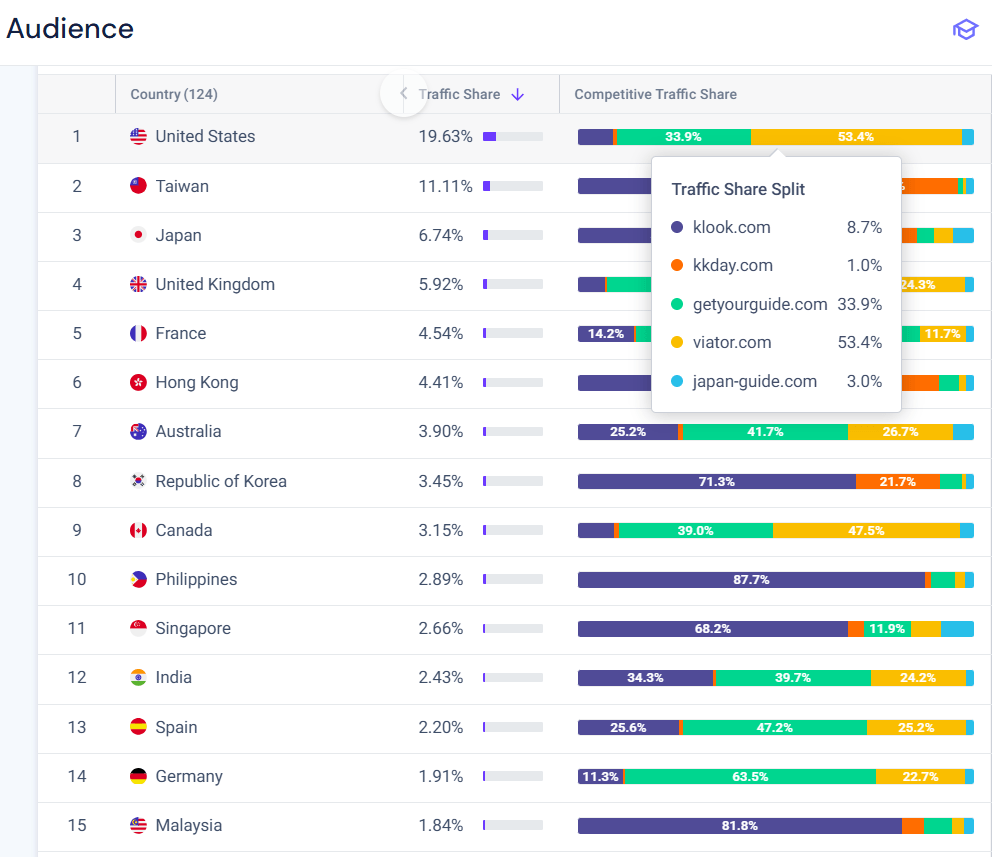
Klook’s audience is clearly global, but a closer look at geography shows where competition is strongest. The United States drives the largest share of traffic at 19.6%, followed by Taiwan and Japan, which reinforces Klook’s strong position in Asia-Pacific travel. However, when you break this down by competitive traffic share, markets like the US and Europe are heavily dominated by players such as Viator and GetYourGuide, while Klook holds a much stronger position in Asian markets like South Korea, Singapore, and the Philippines. This suggests Klook’s competitive advantage is still regionally concentrated, even as it expands globally.
The Demographics report reveals gender and age distribution.
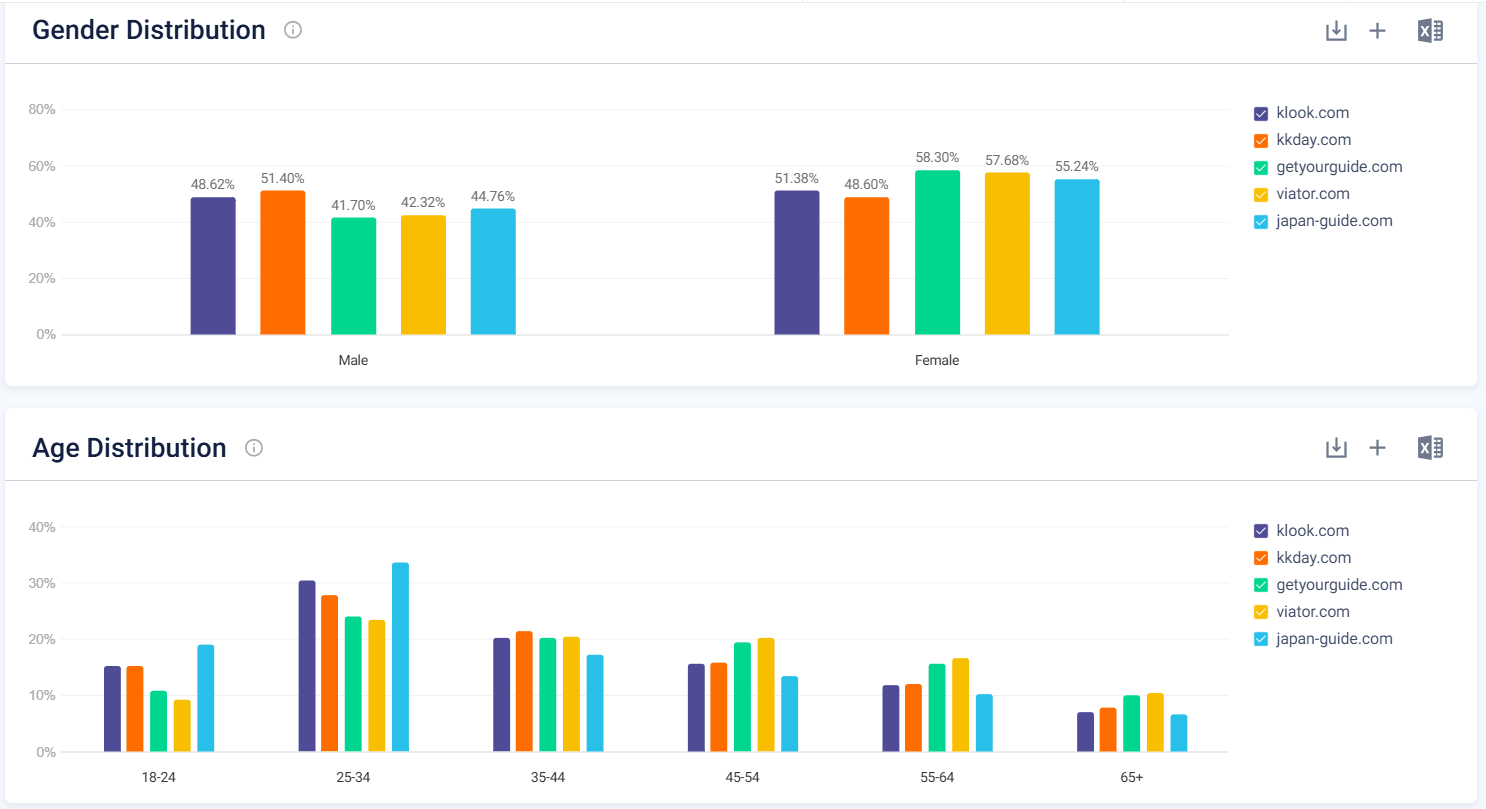
From a demographic perspective, Klook’s audience is fairly balanced by gender, with a slight skew toward female users, similar to most competitors. The more interesting signal comes from age distribution. The largest segment falls in the 25 to 34 range, followed by 35 to 44, indicating that Klook primarily attracts younger, experience-driven travelers. Compared to competitors, the distribution is relatively aligned, which means differentiation is less about who the audience is and more about how each platform captures and converts that demand.
Looking at audience overlap adds another layer to the competitive picture. Despite operating in the same category, the shared audience between Klook and its competitors is surprisingly low, often close to zero in percentage terms. Klook has over 21 million average unique visitors, but a large portion of this audience is exclusive, with more than 16 million users not visiting competing platforms in the same period.
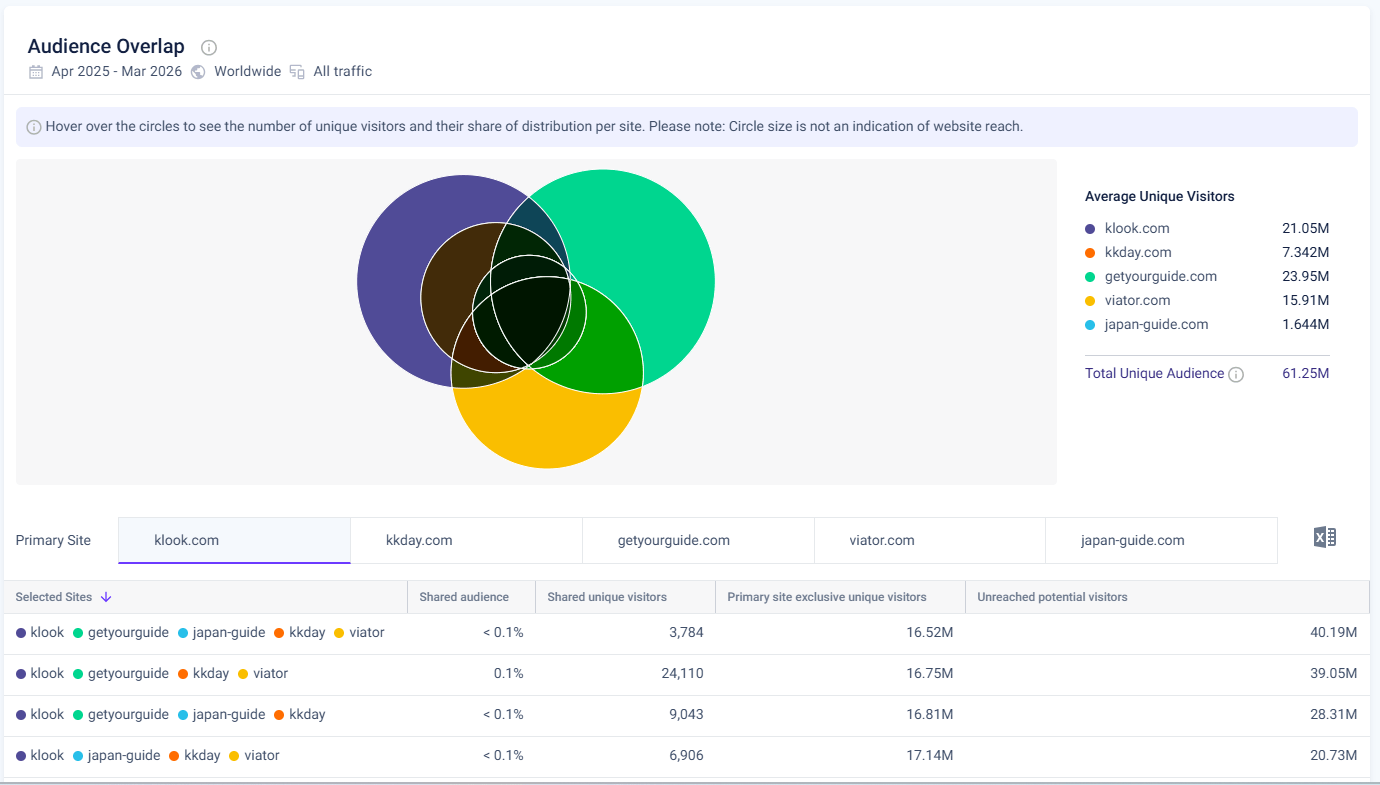
At the same time, the total addressable audience across all competitors exceeds 61 million users, with tens of millions still unreached by Klook. This indicates that competition is less about fighting over the same users and more about capturing different segments within a broad travel demand pool. For Klook, this creates a clear opportunity to expand reach into adjacent audiences that competitors like GetYourGuide and Viator are already capturing.
What a company says about itself only tells part of the story. To truly understand your competitors, you need to see them through their customers’ eyes:
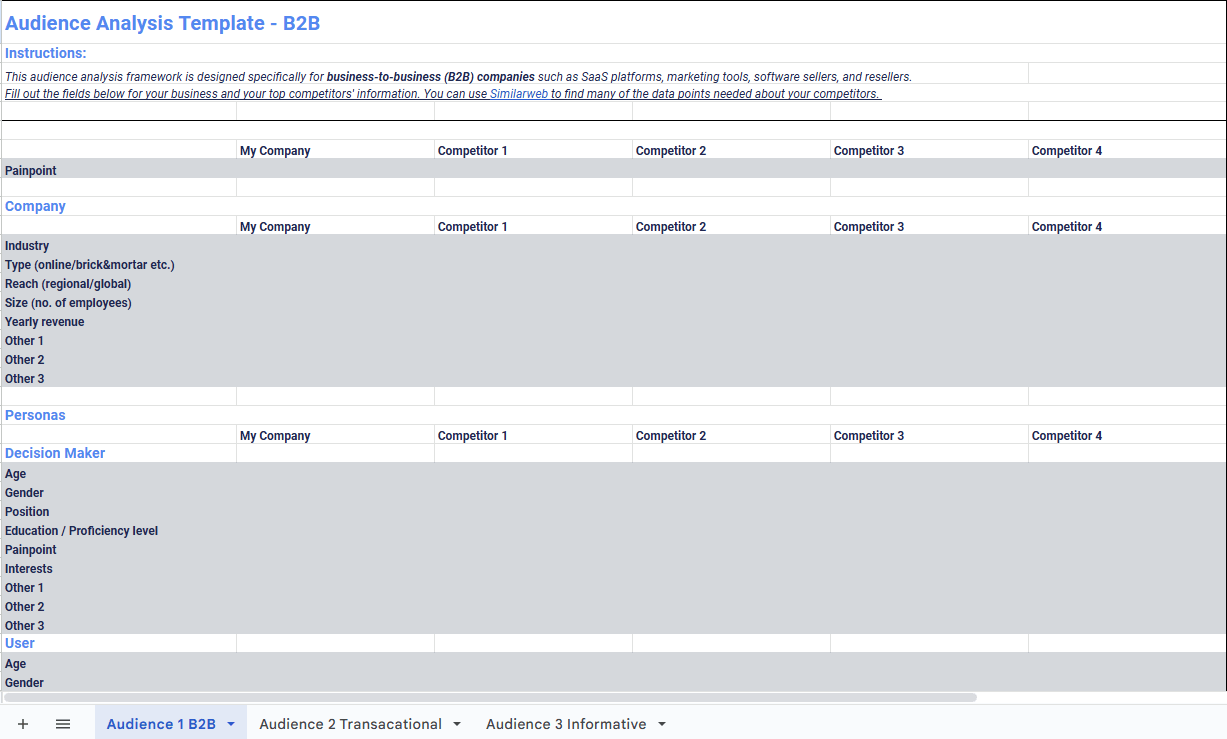
For audience analysis templates, get a copy of our full audience analysis template.
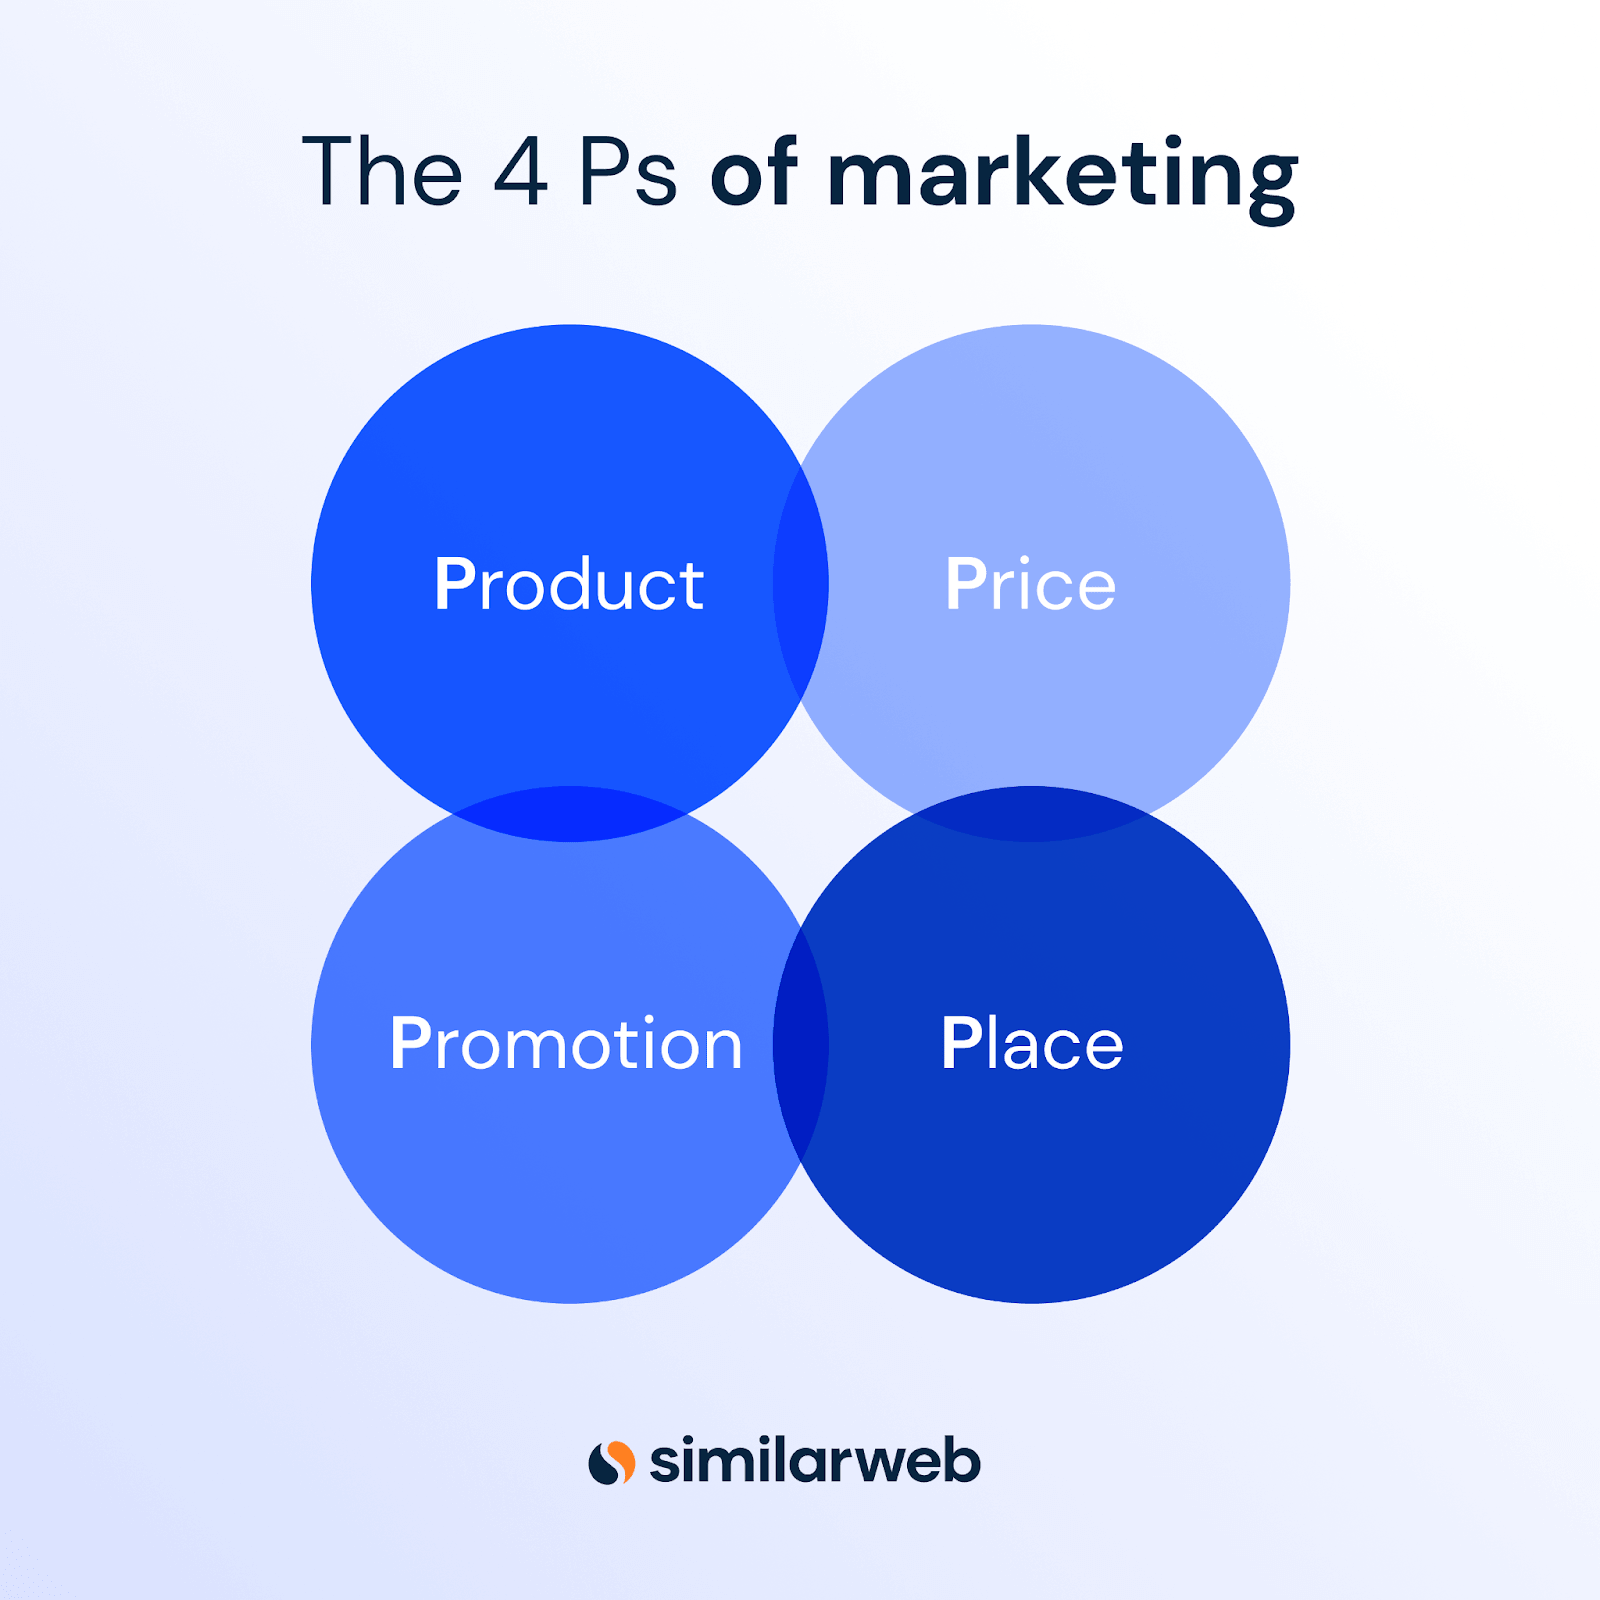
The 4 Ps framework, also called the marketing mix, refers to the fundamental elements businesses use to develop and implement marketing strategies.
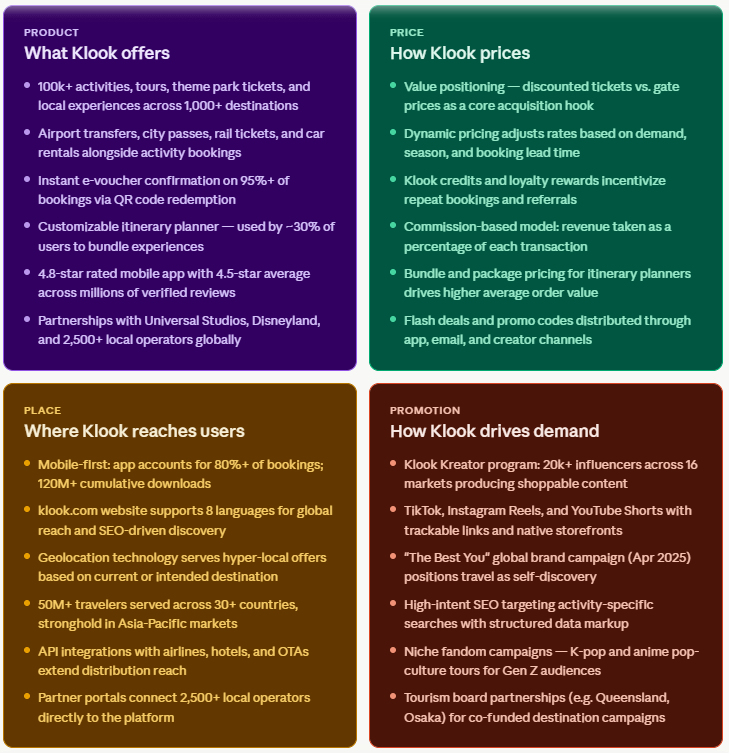
I used Claude again to simulate what this would look like after a session in Klook’s offices:
After you’ve identified your main competitors and analyzed their audiences, it’s time to gather background information on them. Make sure your company overview includes:
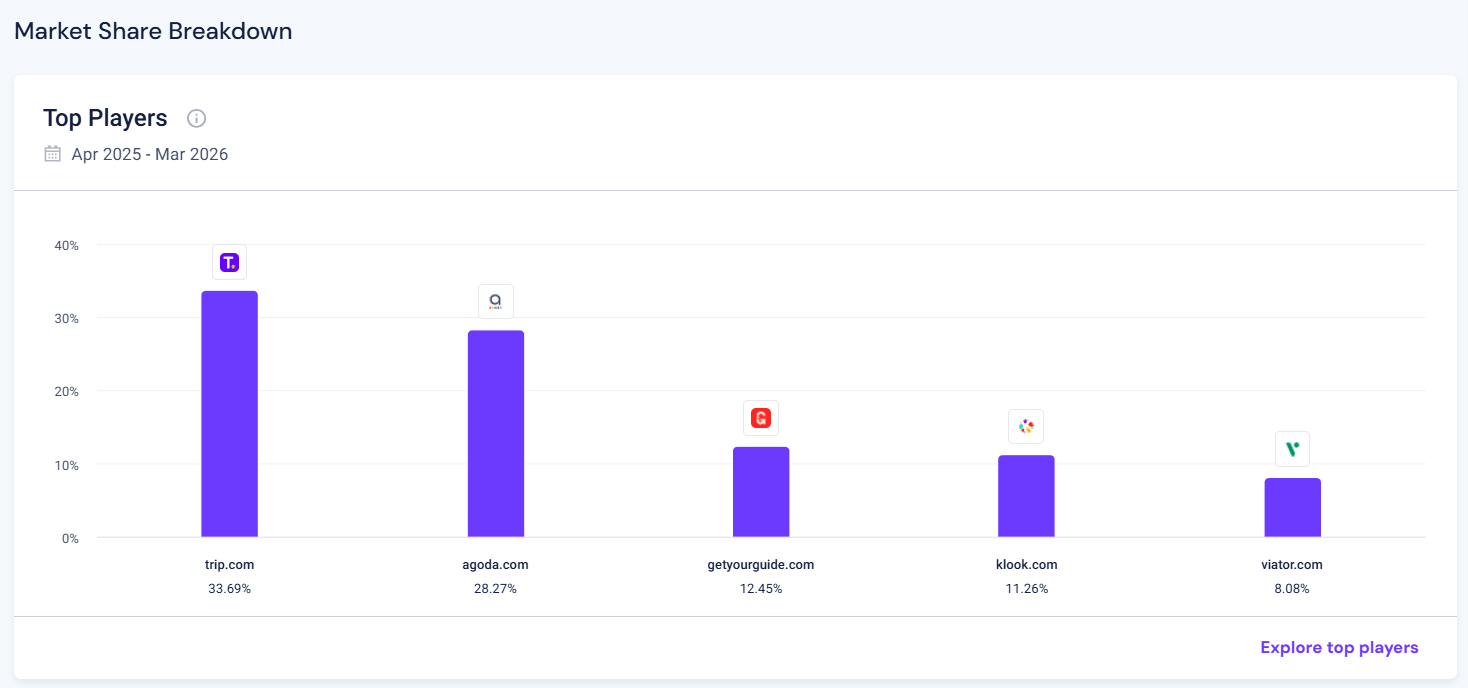
I’d recommend you regularly monitor your market position by creating a Custom Industry in the Similarweb Market research tool. Add your site and your competitors to set it up, this will show how your site is performing within a market you have defined.
Here I took Klook and 8 other sites (but you can do up to 300!)
Looking at the Top Players report, we see that Trip.com and Agoda dominate the space with 33.7% and 28.3% market share, putting them firmly in control of overall demand. Klook sits in the second tier with 11.3% market share, slightly behind GetYourGuide and ahead of Viator. This positions Klook as a strong challenger, but still some distance from the category leaders in terms of total scale.
The Market Quadrant view adds more context to that position. Klook shows above-average growth and engagement, with over 21M unique visitors and strong month-over-month growth. It sits outside the leading quadrant but clearly above many smaller players, which indicates momentum. In contrast, Trip.com combines both scale and growth, while Agoda maintains a large audience but with slower momentum.
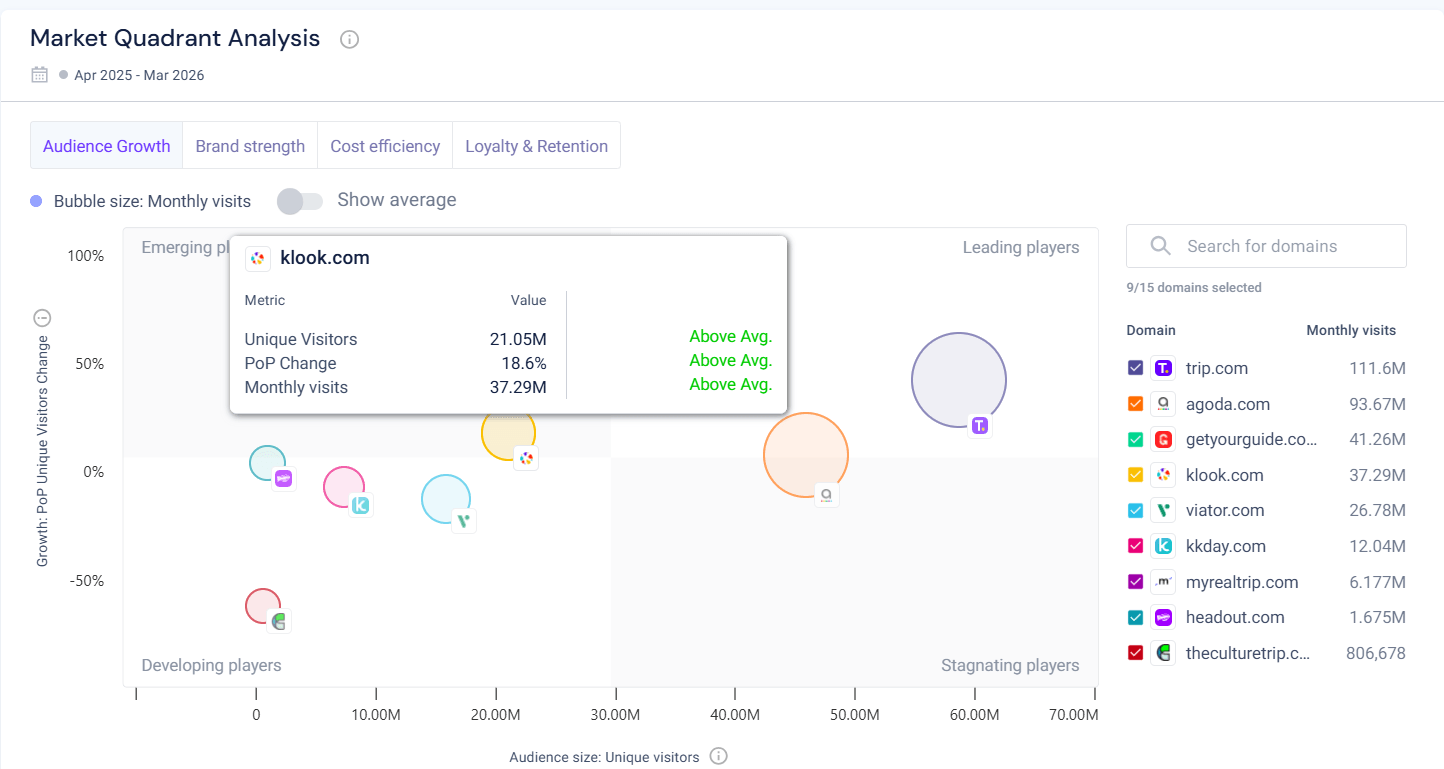
This tells a clear story. Klook is not the market leader yet, but it is growing at a healthy pace and competing closely with the top experience-focused platforms. The gap to the largest OTAs is still significant, but Klook is well-positioned to gain share if it continues to scale in high-growth markets and capture more demand across its existing audience.
Once you have basic overviews for your top competitors, your next step is to analyze how your company fits into your market. Pay special attention to those in the top-right of the market matrix, these are the companies you’ll want to monitor most closely.
You now have an overview of your competitors. You’ve assessed their place in the market and conducted an audience comparison. Now, let’s analyze their website performance to uncover:
Using Similarweb’s Website Analysis tool, look at traffic & engagement, then qualify those findings with engagement metrics like bounce rate and pages per visit. When you look at visits over time, you can spot trends. A competitor with high traffic but a downward trajectory may be more vulnerable than the headline number suggests.
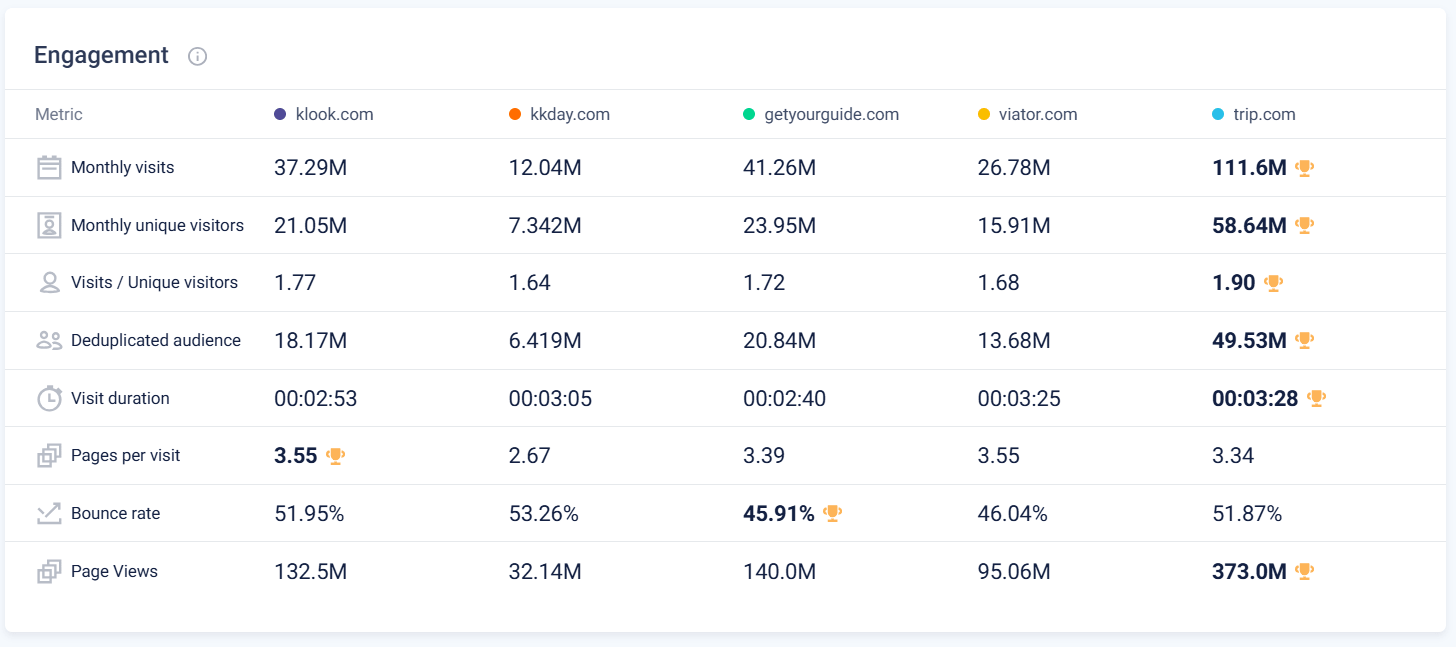
Looking at traffic and engagement gives a more complete picture of how Klook performs beyond raw visit numbers. With 37.3M monthly visits and 21M unique users, Klook sits behind the largest players like Trip.com and GetYourGuide, but remains firmly in the top tier. Where it stands out is engagement quality. Klook leads on pages per visit at 3.55, matching Viator and outperforming most competitors, which suggests users are actively browsing and comparing options rather than bouncing quickly.
At the same time, its bounce rate sits at just under 52%, which is higher than GetYourGuide’s 45.9%. This indicates that while Klook drives strong exploration once users engage, there is still room to improve first-touch experience and landing page relevance to reduce drop-off.
Looking at trends over time adds important context.
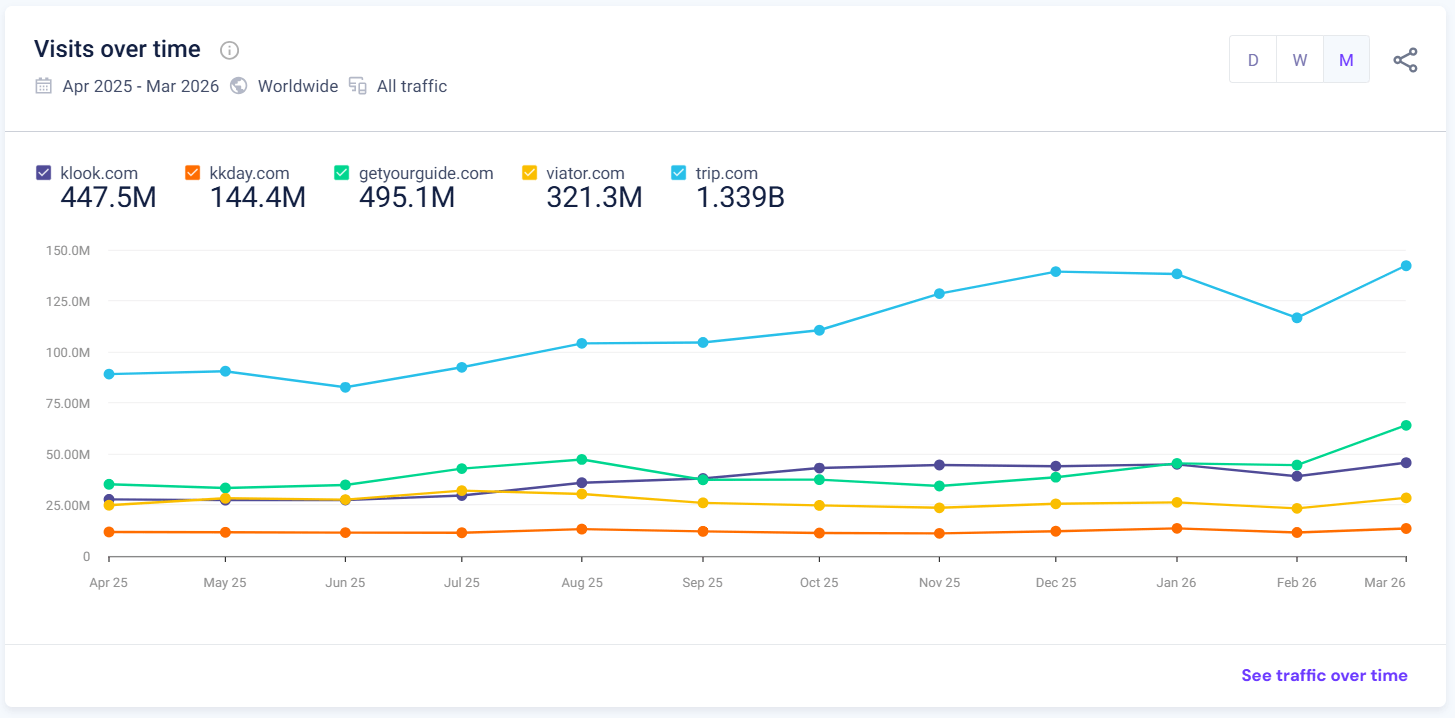
Klook shows steady growth across the year, rising from the mid-30M range to around 46M monthly visits by March, with a small dip in February followed by a rebound. This upward trajectory signals healthy demand growth and increasing visibility. In contrast, while Trip.com dominates in scale, its growth is more gradual, and other competitors like Viator remain relatively flat. This suggests that Klook is gaining momentum, even if it has not yet closed the gap in total traffic.
Then move to Marketing Channels. Which channels are they winning in? Are any channels being underinvested in? These gaps are often where the best opportunities to gain market share reside.
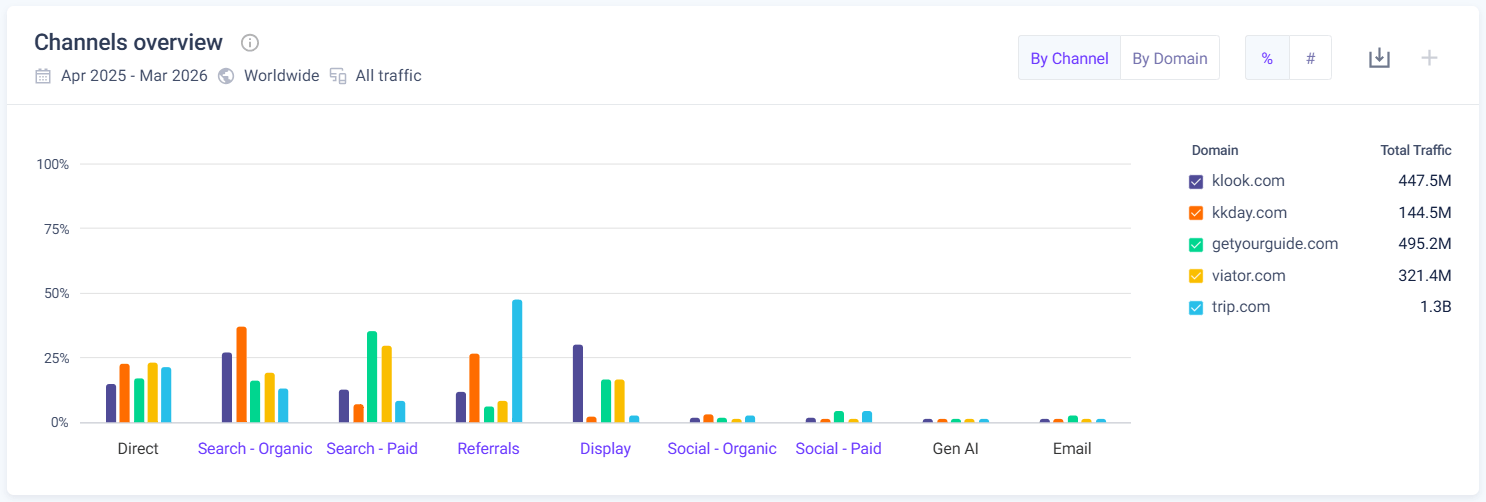
Looking at marketing channels reveals clear differences in how each player acquires traffic. Klook’s strategy is relatively balanced, with strong contributions from organic search (around 25%+) and display (around 30%), supported by direct traffic. This suggests a mix of brand demand and active user acquisition, especially through retargeting and awareness campaigns.
In contrast, competitors show more specialized channel strategies. Trip.com heavily dominates referrals, driving close to half of its traffic from partnerships and affiliates, which points to a strong distribution network. GetYourGuide and Viator lean more heavily on paid search, indicating a focus on capturing high-intent demand at scale. Meanwhile, KKday over-indexes on organic search, suggesting a stronger reliance on SEO for growth.
For Klook, this highlights both strengths and opportunities. Its diversified mix reduces reliance on any single channel, but there may be room to expand in areas like referrals and paid search, where competitors are capturing significant demand.
If you’re only looking at websites, you’re missing a big part of the picture. In travel especially, a huge portion of bookings and repeat usage happens on mobile apps. This is where Similarweb’s App Intelligence comes in, giving you visibility into downloads, usage, engagement, and user sentiment across your competitors’ apps.
Starting with downloads, both Klook and GetYourGuide operate at a similar scale, with 4.6M and 5.3M total downloads over the past year.
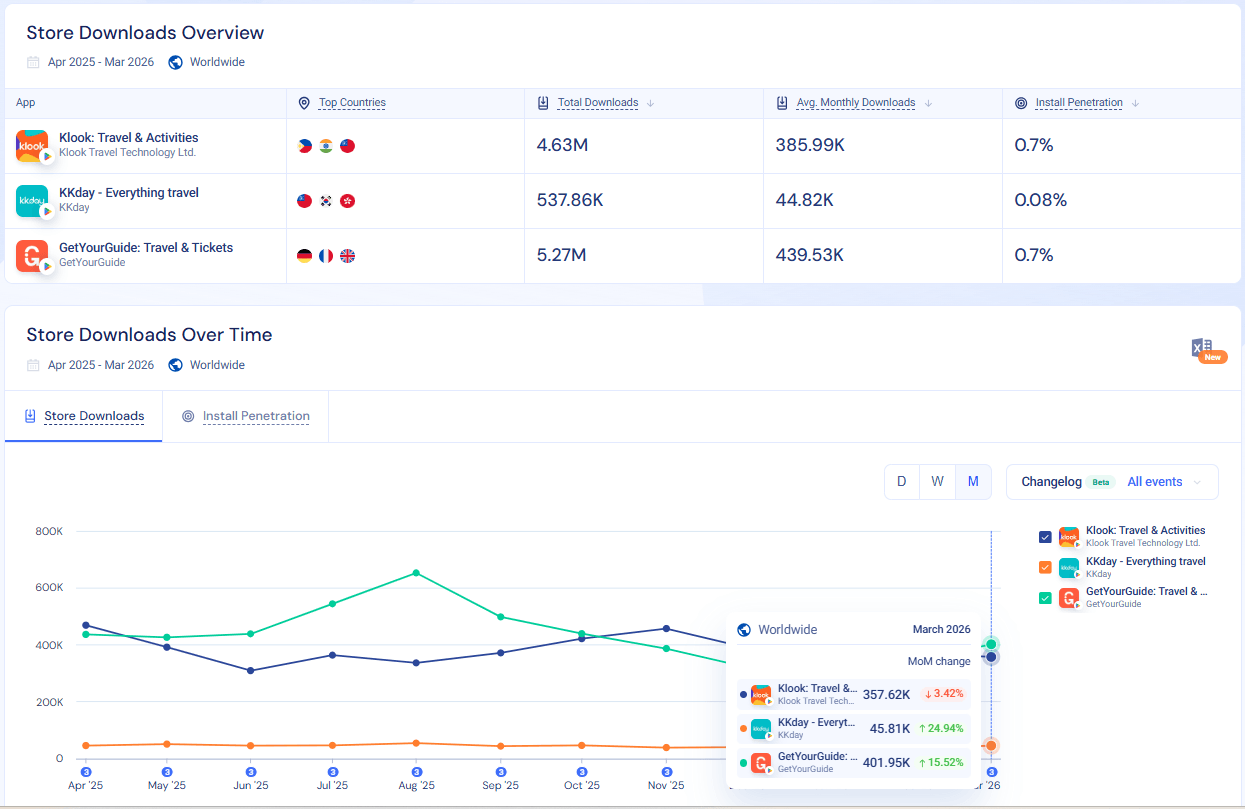
However, GetYourGuide slightly leads in average monthly downloads, which suggests stronger ongoing acquisition. KKday, on the other hand, is significantly smaller in scale, with under 1M total downloads, indicating a more limited app footprint.
Looking at trends over time adds more context. Klook’s downloads are relatively stable, but show a slight decline in the most recent month, while GetYourGuide is trending upward.
Engagement metrics tell a different story.
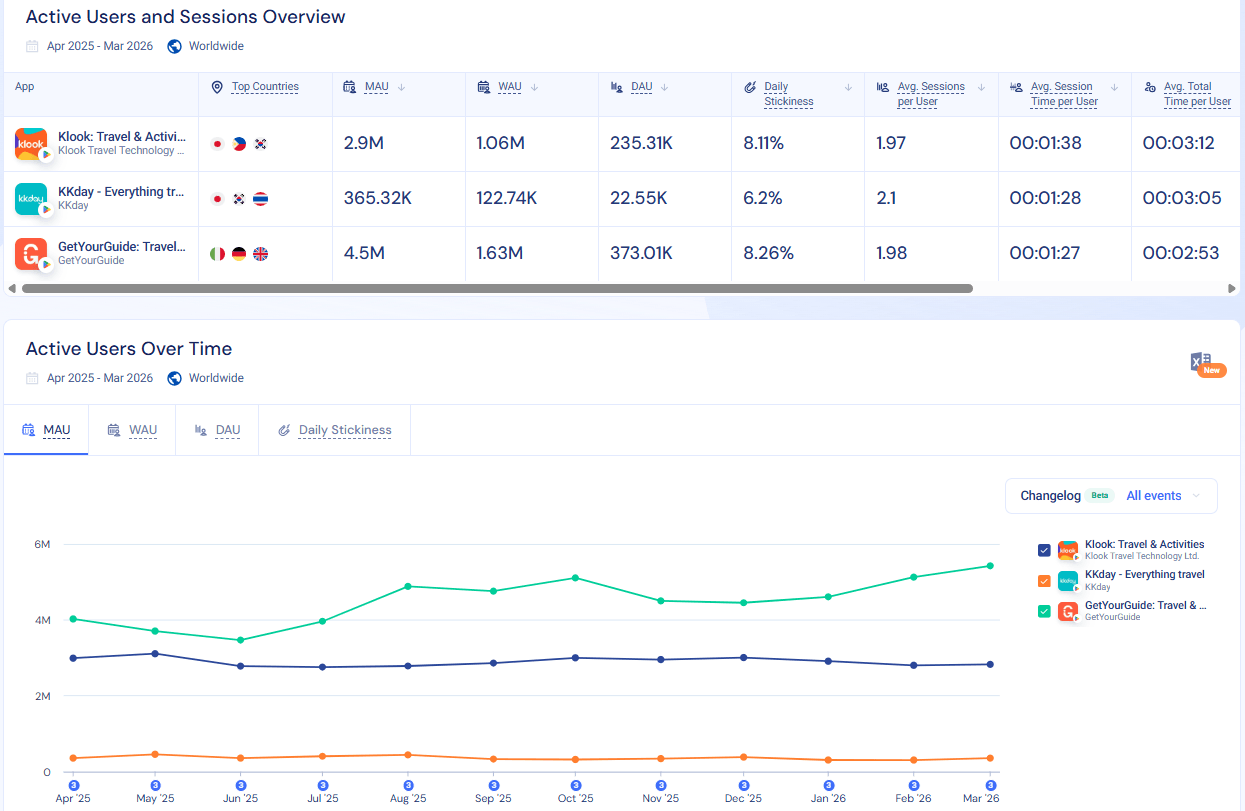
Klook has around 2.9M monthly active users, compared to 4.5M for GetYourGuide, but its session time per user is higher, which indicates that users who are in the app are actively engaging. Its daily stickiness (8.1%) is also close to GetYourGuide’s, showing comparable retention levels. KKday again trails behind in both scale and engagement.
User feedback highlights where experience gaps exist.
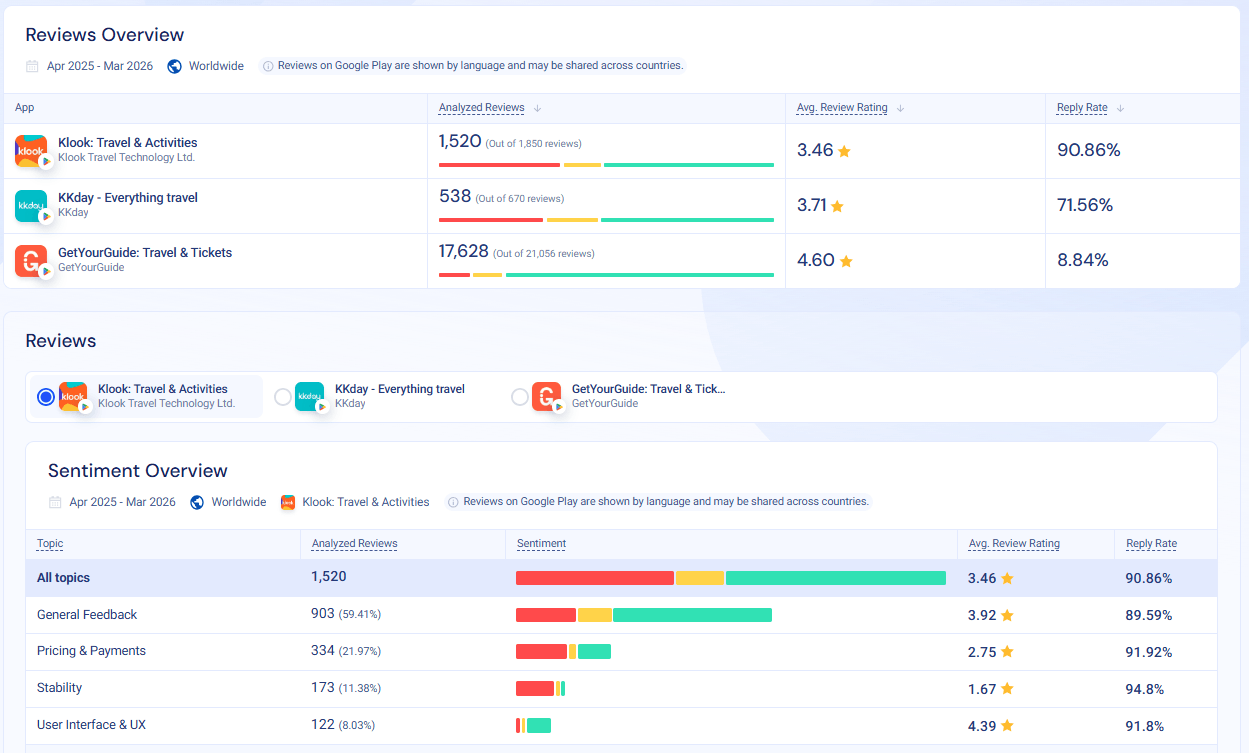
Klook’s average rating of 3.46 is noticeably lower than GetYourGuide’s 4.60, despite having a much higher reply rate to reviews (over 90%). This suggests that while Klook is actively managing customer feedback, there may be underlying product or experience issues, particularly around areas like pricing and stability, where sentiment appears weaker.
The takeaway is that app performance is not just about downloads. Klook is competitive in scale and engagement, but there is clear room to improve user satisfaction and acquisition momentum. For competitive analysis, this helps you understand not just how users find your product, but how they experience it after they install it.
Once you’ve analyzed your competitors’ performance and strategies, the next step is to monitor them continuously. Competitive analysis is not a one-time exercise, and this is where a competitive tracker becomes essential.
With Similarweb’s Competitive Tracker, you can follow up to 25 competitors in one place and stay updated on both performance trends and real-world business activity. Instead of manually checking multiple sources, you get a centralized view of what your competitors are doing across marketing, product, and growth.
One of the most valuable features is Competitor News & Updates, a daily feed that highlights meaningful competitor activity across more than 20 business topics. This includes things like partnerships, product launches, investments, and leadership changes, all ranked by relevance so you can quickly focus on what matters. For example, spotting a new partnership or product expansion early can help you respond before it impacts your market position.
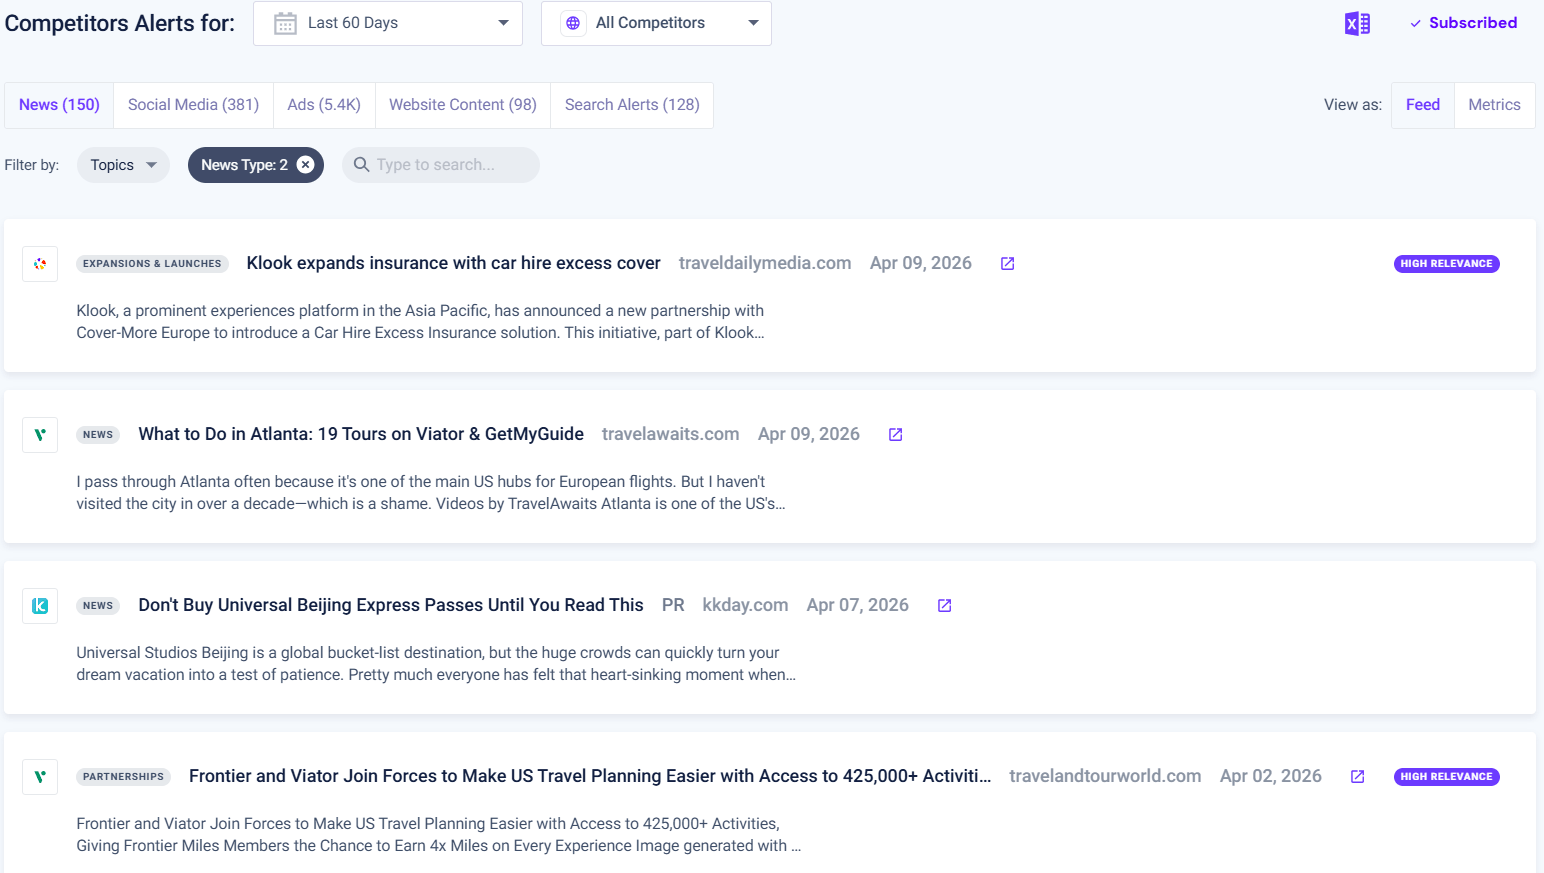
Beyond business updates, the tracker also gives visibility into marketing execution. You can monitor competitors’ social media posts and paid ads in real time, which makes it easier to understand how they position their offerings, what messaging they prioritize, and where they are investing budget. This is particularly useful for identifying new campaign angles or testing ideas based on what is already working in your category.
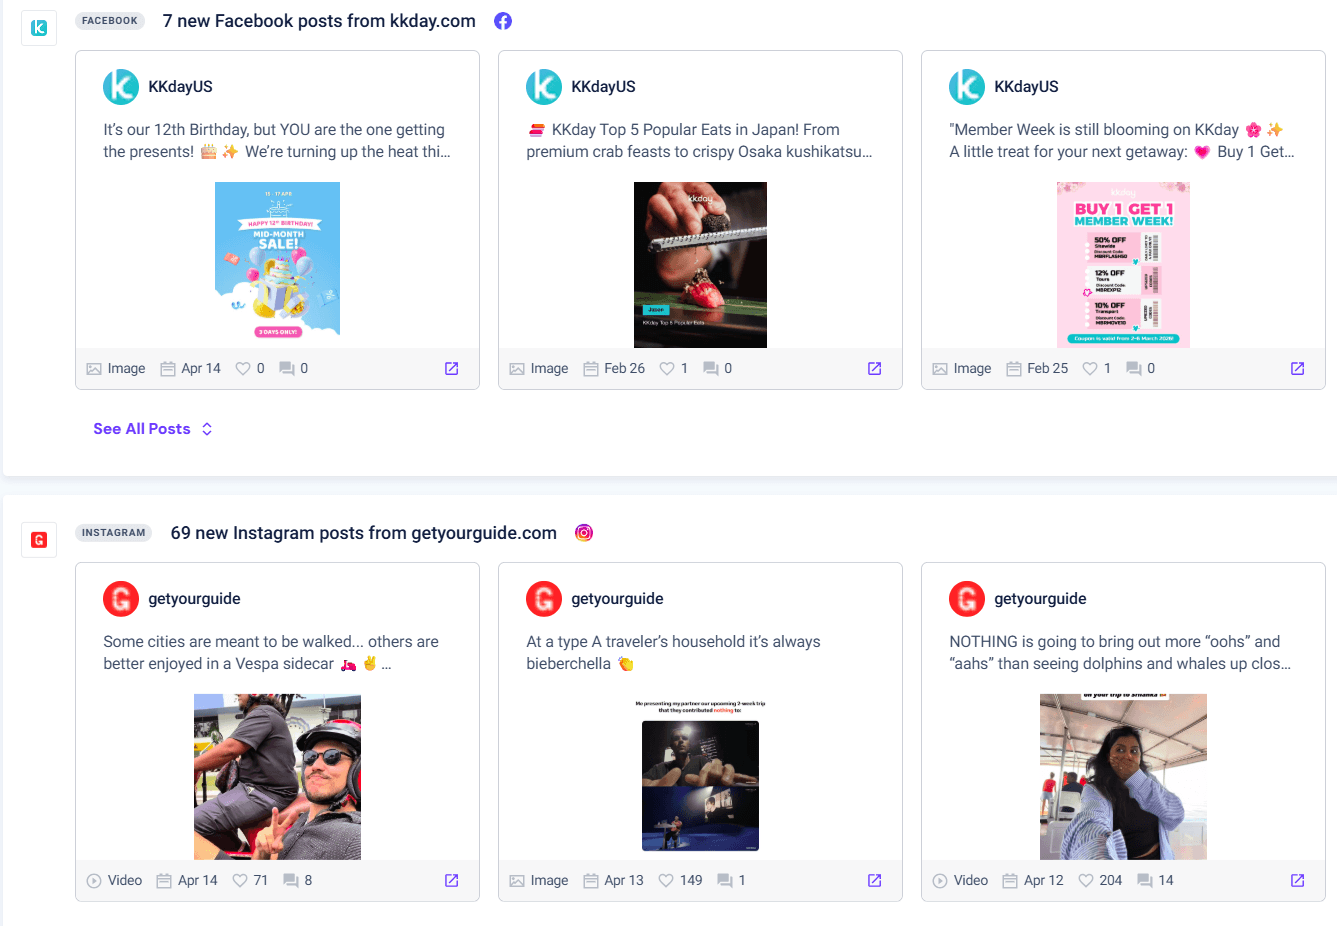
You can also track content strategy changes by following competitors’ blog updates and website content. This helps you quickly spot shifts in topics, new landing pages, or emerging themes, which can feed directly into your own SEO and content planning.
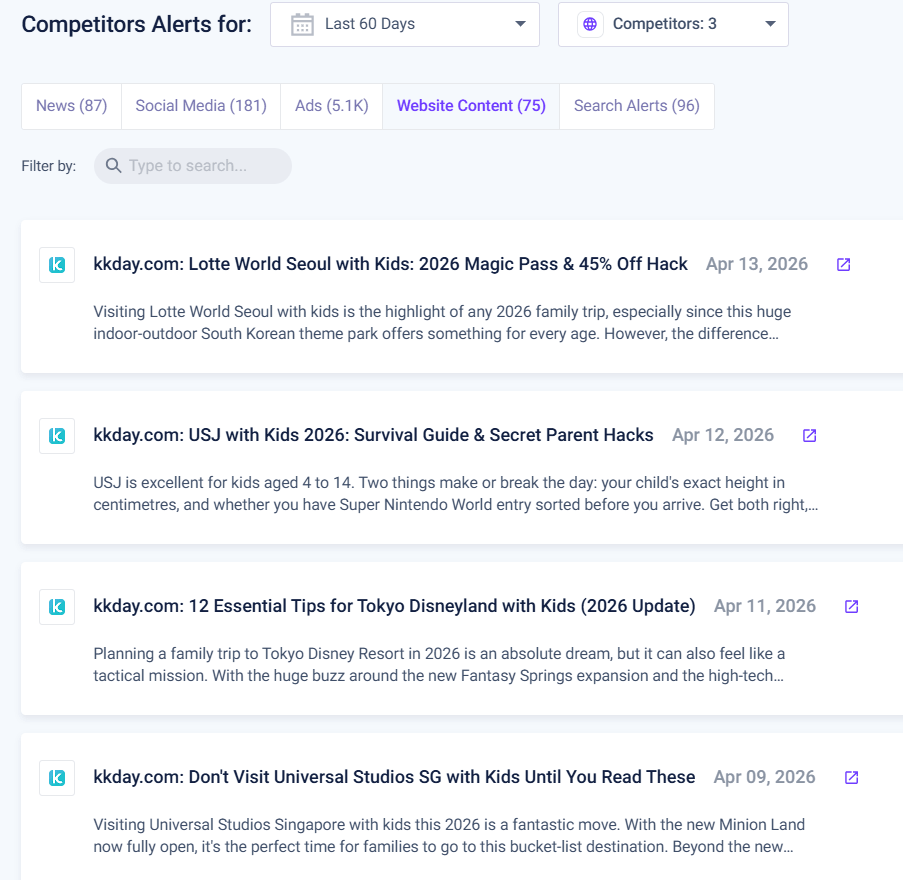
All of this can be delivered directly to your inbox through automated alerts, so you do not need to actively check the platform every day. Instead, you stay informed as soon as something important happens, from new ad creatives to press mentions and site updates.
The result is simple. Instead of reacting late to competitor moves, you build a system that helps you spot changes early and act on them faster.
Go to the Similarweb Keywords report. This report helps you understand how your competitors appear in search results, for both paid and organic listings, giving you insights into both their SEO and PPC keyword strategies.
Compare all your top competitors’ keywords in one view. Non-branded keywords reveal their SEO strategies, while branded keywords show brand awareness performance.
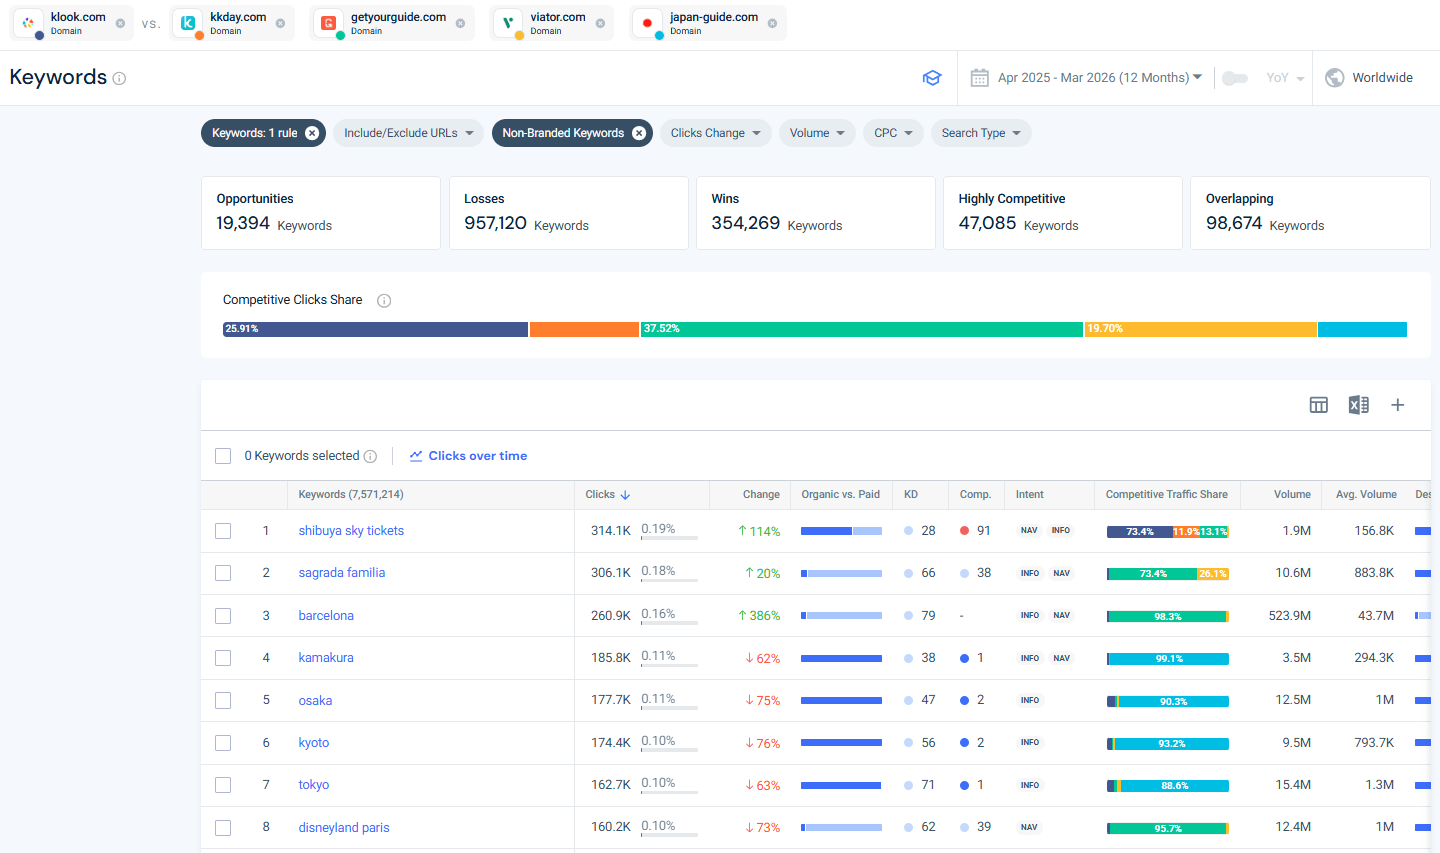
Looking at the Keywords report gives a clear view of how Klook competes in search across both SEO and PPC. When focusing on non-branded terms, the competitive landscape is dominated by GetYourGuide, which holds the largest share of clicks at around 37.5%, followed by Klook at 25.9% and Viator at 19.7%. This shows that while Klook is a strong player, it is still competing for visibility against platforms that capture a larger share of discovery traffic.
At the keyword level, the mix of wins and losses highlights where Klook is gaining and where it is losing ground. For example, it is seeing strong growth on certain queries like “Shibuya Sky tickets,” while losing visibility on broader destination terms such as “Tokyo,” “Kyoto,” and “Osaka.” This pattern suggests that Klook performs better on specific, experience-driven queries rather than broad travel searches, where larger platforms tend to dominate.
Overall, this reinforces an important strategic insight. Klook’s strength lies in capturing high-intent, activity-focused searches, but there is still an opportunity to expand visibility across broader, top-of-funnel travel queries to grow overall traffic share.
The top landing pages report allows you to reveal which of your competitors’ pages get the most organic and paid traffic, which keywords each page ranks for, and how performance trends over time. You can add relevant terms to a keyword list to track your traffic share against competitors on an ongoing basis.
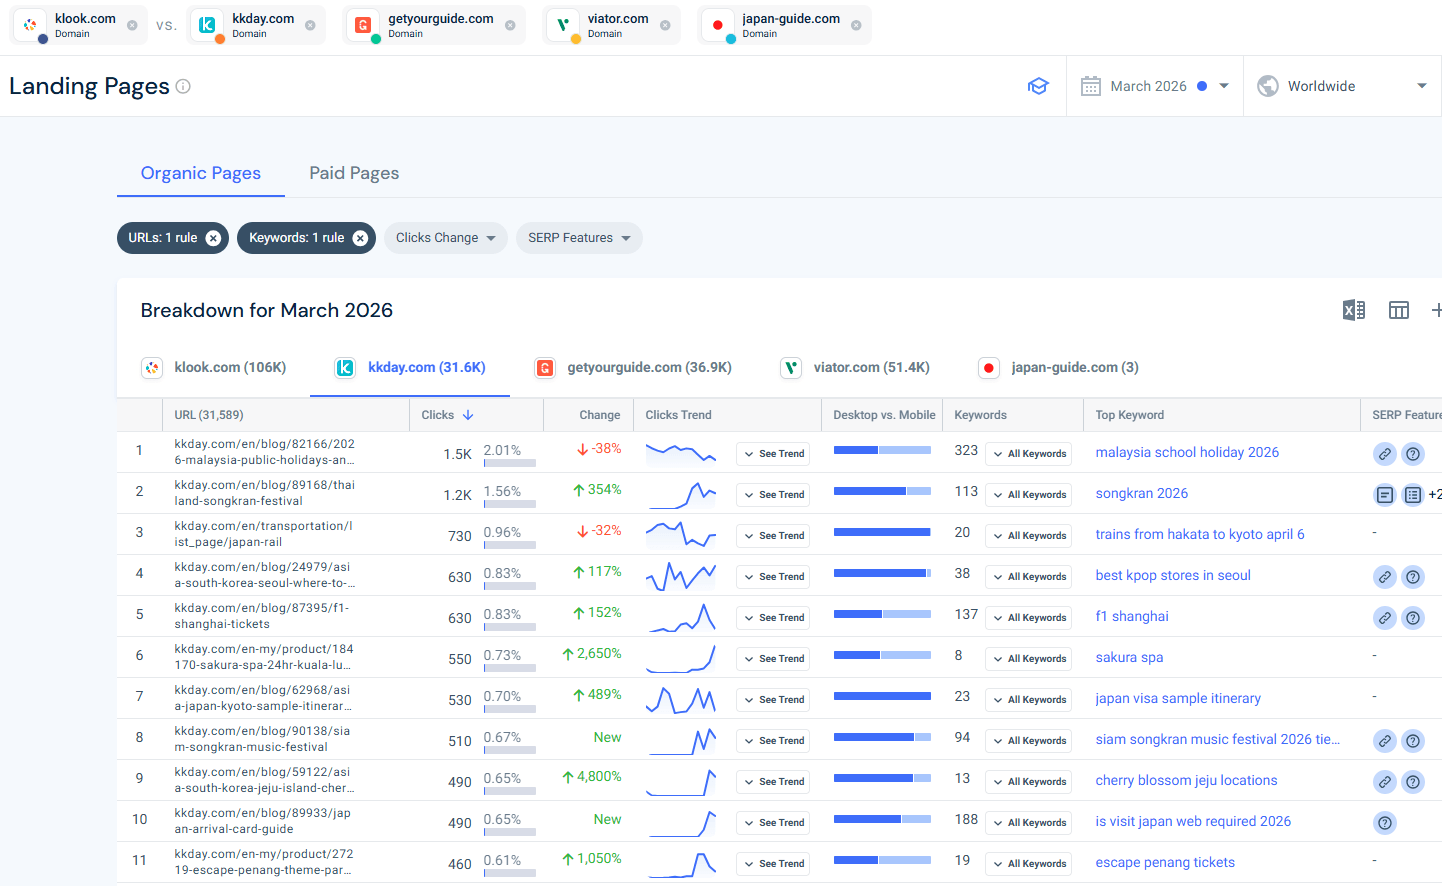
Looking at KKday, a large share of its top-performing pages are blog and guide-based content, targeting queries around travel planning, events, and itineraries such as “Songkran 2026” or “Japan visa sample itinerary.” Many of these pages are seeing strong growth, with some increasing by hundreds or even thousands of percent, which signals an active content strategy focused on capturing search demand early.
This highlights a clear pattern. Instead of relying only on product or booking pages, competitors are using informational content to attract users at the research stage, then guiding them toward conversion. For Klook, this points to an opportunity to expand beyond transactional pages and invest more in content that targets high-volume, planning-related searches, especially around seasonal events, travel guides, and destination-specific queries.
👉 Pro tip: Add these keywords to a dedicated campaign in your rank tracker. Use the tracker to monitor your organic rankings and optimize your pages to capture more traffic share.
Understanding which content and keywords your competitors use is just the start. To gain a competitive edge, you’ll need to dive into their pay-per-click (PPC) strategies.
Start with Similarweb’s Paid Competitors tool to conduct a PPC competitive analysis by entering your website. Switch between metrics like total traffic, paid traffic, search overlap, and shared keyword percentage to identify your closest PPC competitors.
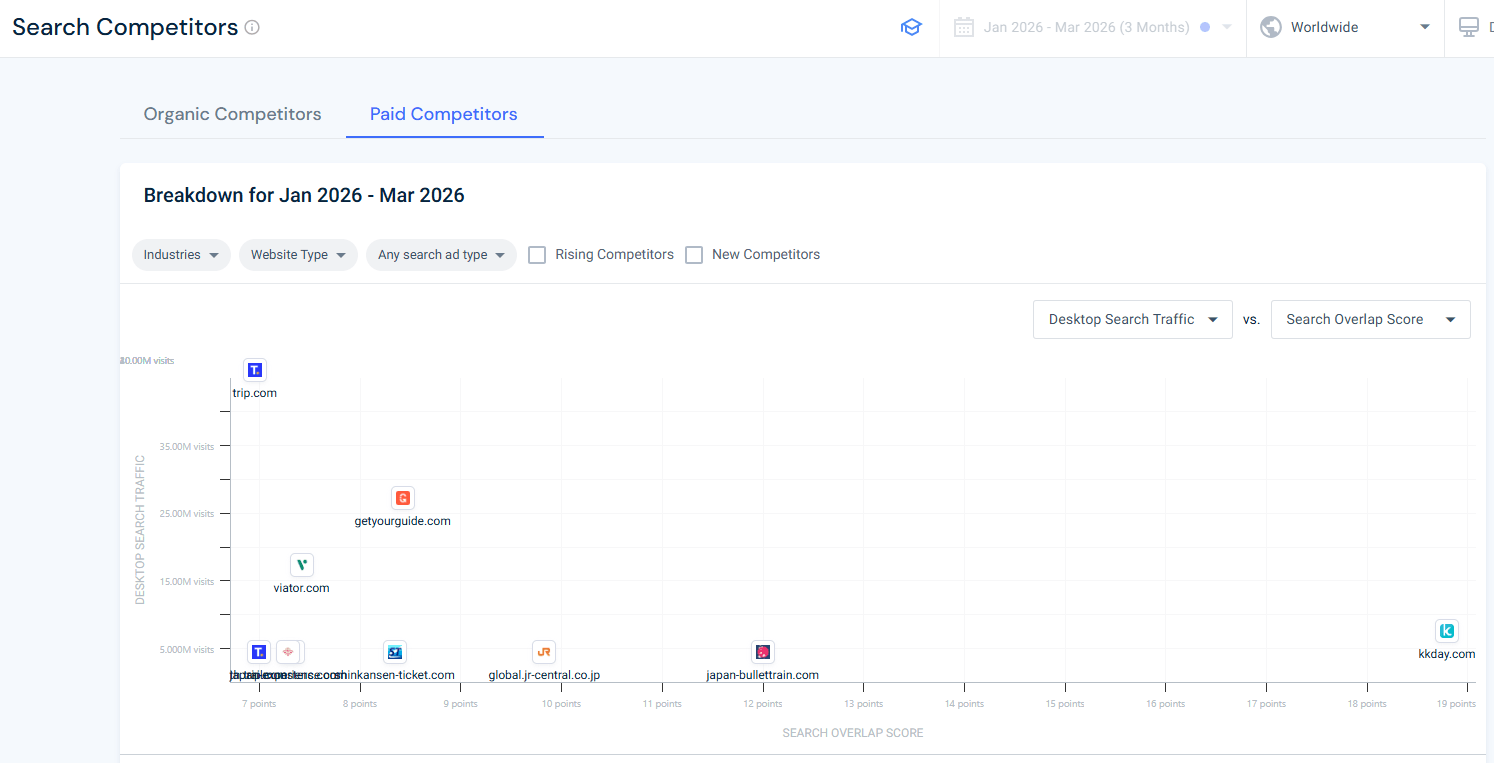
KKday stands out as the closest paid competitor, with the highest search overlap score and a significant 42.6% shared keywords, making it the most directly comparable player in terms of targeting strategy.
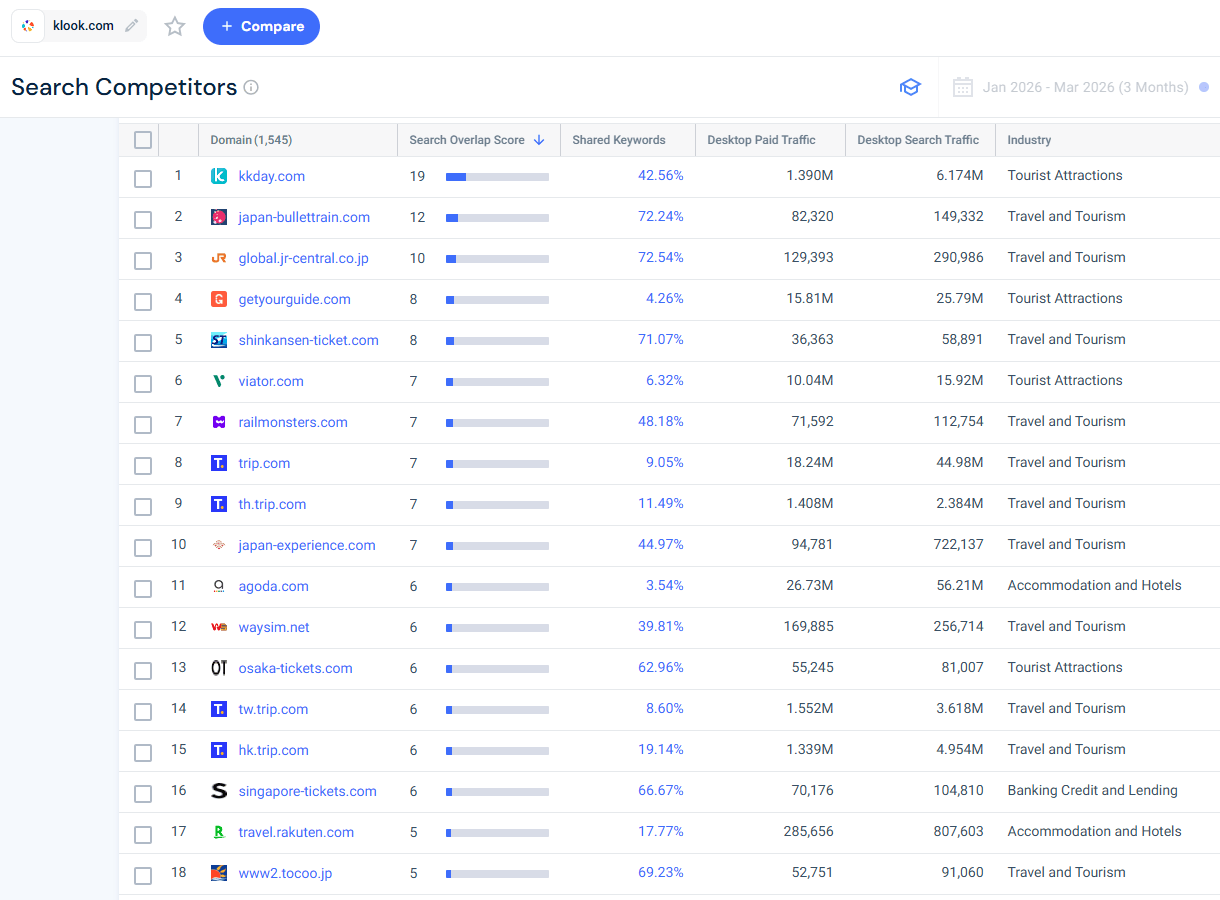
At the same time, larger platforms like Trip.com, GetYourGuide, and Viator dominate in terms of paid search traffic volume. Trip.com alone drives nearly 45M paid visits, far ahead of other players, which shows the scale of investment required to compete on broad, high-intent travel queries.
There is also a distinct group of niche competitors such as japan-bullettrain.com, shinkansen-ticket.com, and osaka-tickets.com, which show very high keyword overlap but relatively low traffic. These sites focus on highly specific queries, often tied to transportation or local experiences, where conversion intent is strong.
This highlights an important dynamic in PPC. Klook is competing across different layers of the market, from direct competitors with similar keyword strategies, to large platforms with significant budgets, and smaller niche sites targeting highly specific demand.
After identifying your paid competitors, use Similarweb’s Search Overview feature to compare paid traffic trends over a specific period. Then:
Looking at PPC performance over time helps you understand how aggressively competitors are investing and how that changes throughout the year.
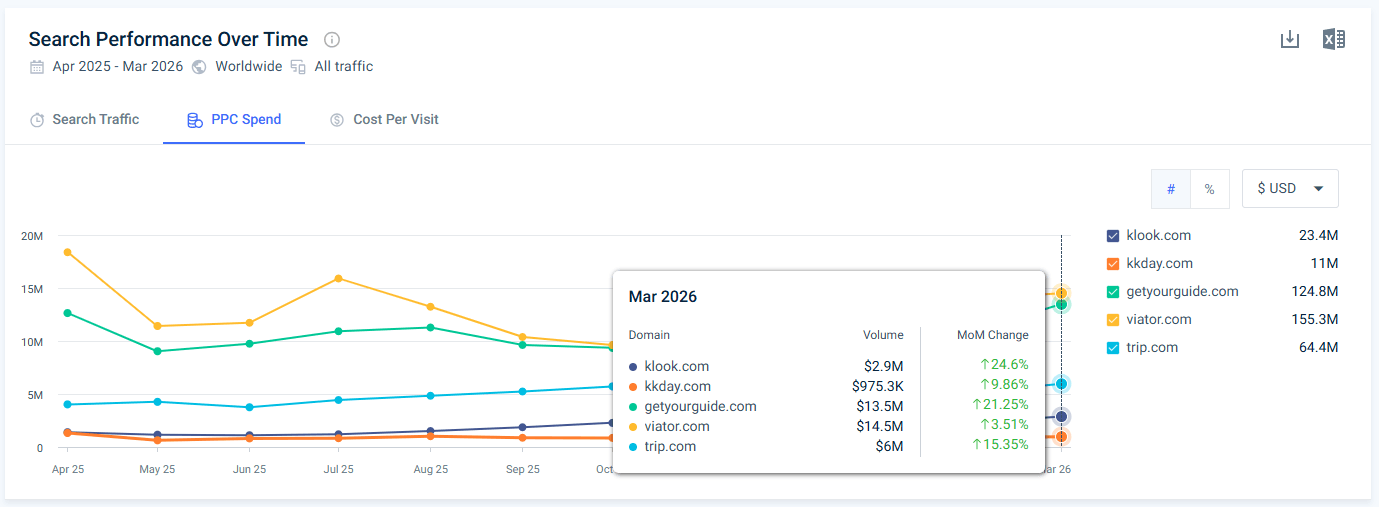
In Klook’s case, its paid spend is growing steadily, reaching around $2.9M in March, but it remains significantly lower than competitors like Viator and GetYourGuide, which are investing over $14M and $13M respectively. This gap highlights the level of budget required to compete at scale on high-value travel keywords.
At the same time, the upward trend across most players suggests increasing competition and rising costs in the category. Klook’s consistent growth in spend indicates a push to capture more paid demand, but it is still operating more selectively compared to larger platforms.
Looking at actual ad creatives adds another layer of insight.
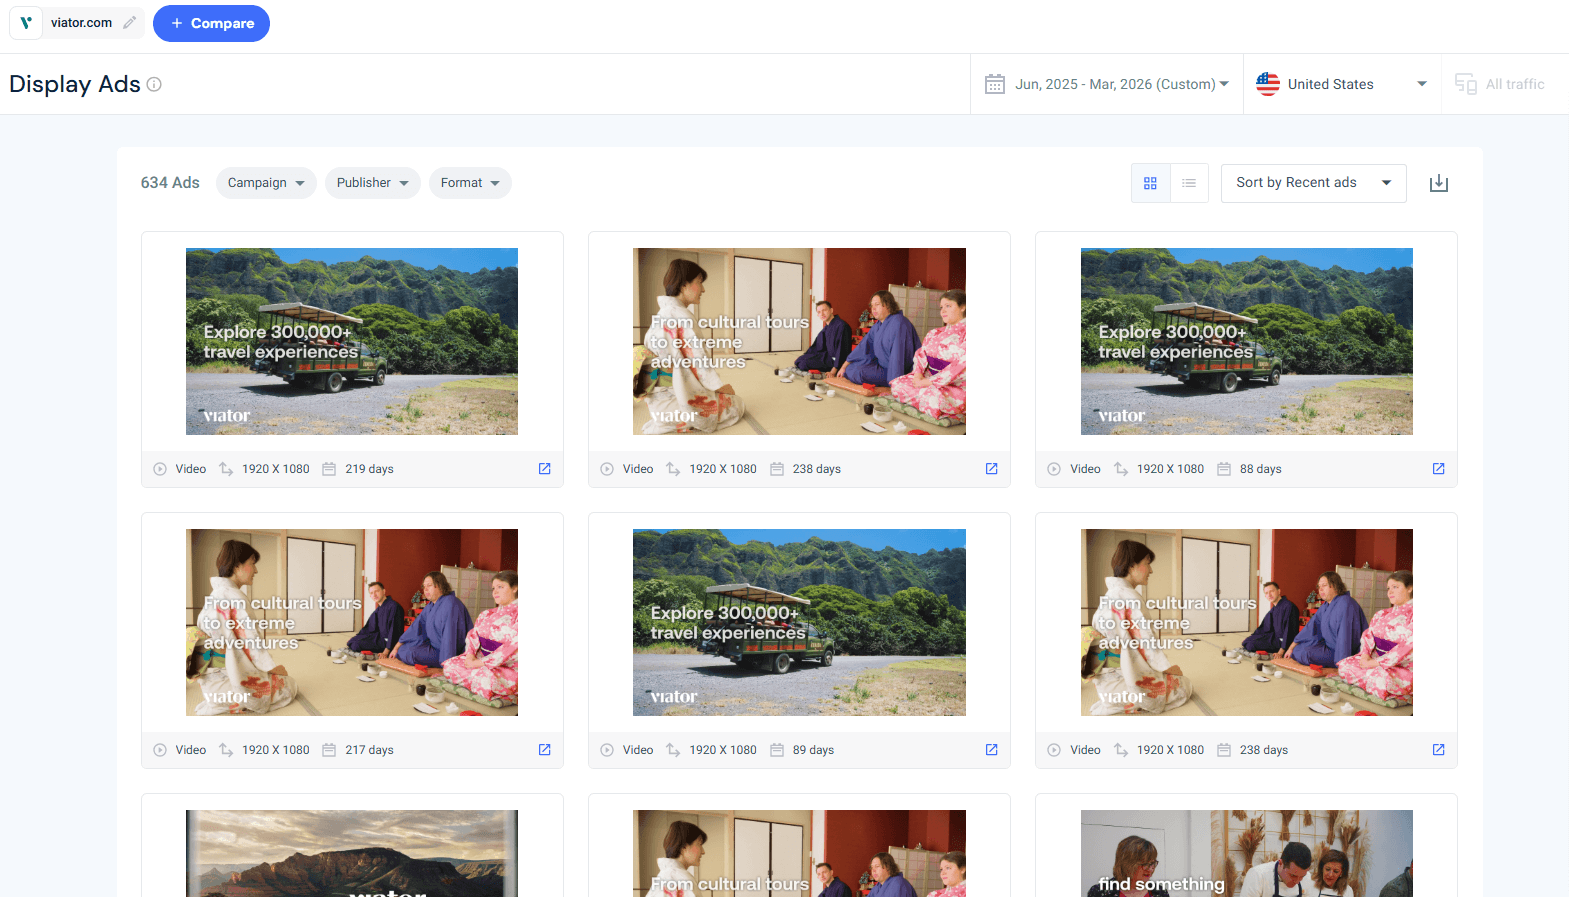
Competitors like Viator focus heavily on broad, experience-led messaging, using visuals and copy that emphasize variety and inspiration, such as “explore 300,000+ travel experiences.” This type of messaging targets users earlier in the decision-making process, not just those ready to book.
For Klook, this reveals a clear opportunity. Competing on budget alone may not be enough, so refining messaging and testing different positioning angles can be just as important as increasing spend.
To better understand your competitors’ marketing, research their lead generation strategies. Put yourself in the shoes of their audience: read a few blog posts, sign up for their newsletter, try out any free tools they offer. Also look at top traffic referrers and discover the top sources of referrals for their site.
Focus on identifying:
Monitor your competitors’ Twitter (X), LinkedIn, Facebook, Instagram, and TikTok activity. Pay attention to their campaigns, product launches, events, and company milestones. This intelligence can shape your own digital strategy and brand positioning. For a structured approach, use a dedicated social media competitive analysis framework.
Here are four steps to do this effectively:
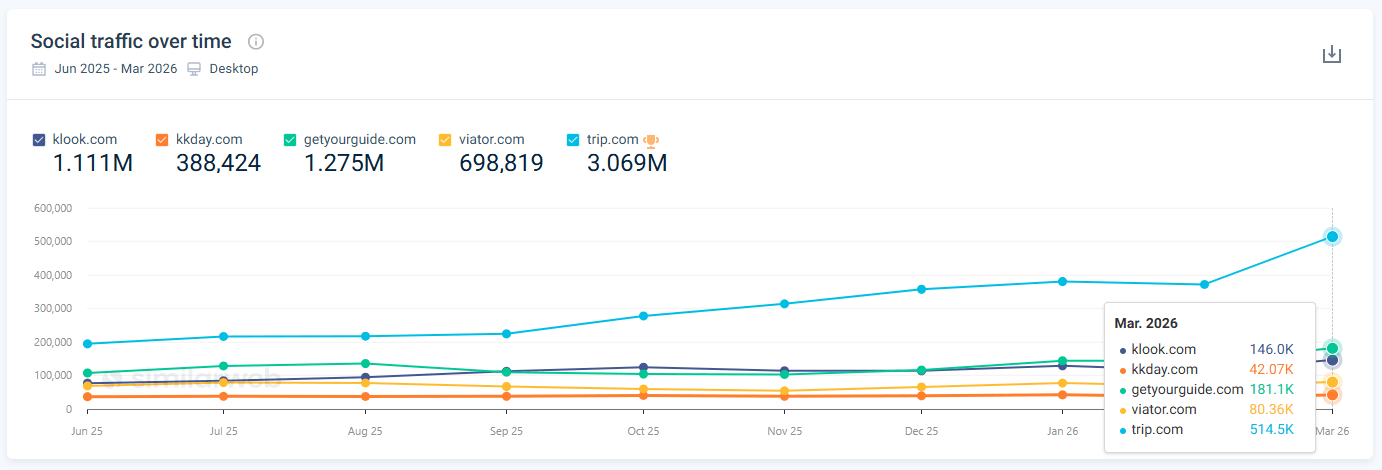
Trip.com clearly leads, driving over 3M social visits, more than double any other player. Klook performs strongly with 1.1M visits, slightly behind GetYourGuide, which shows that social is already a meaningful channel, but not a leading one.
Looking at trends over time, Klook’s social traffic is relatively stable with gradual growth, while Trip.com shows a much stronger upward trajectory, especially toward the end of the period. This suggests a more aggressive or effective social strategy, likely supported by higher investment or broader campaigns.
When breaking this down by platform, clear differences emerge.
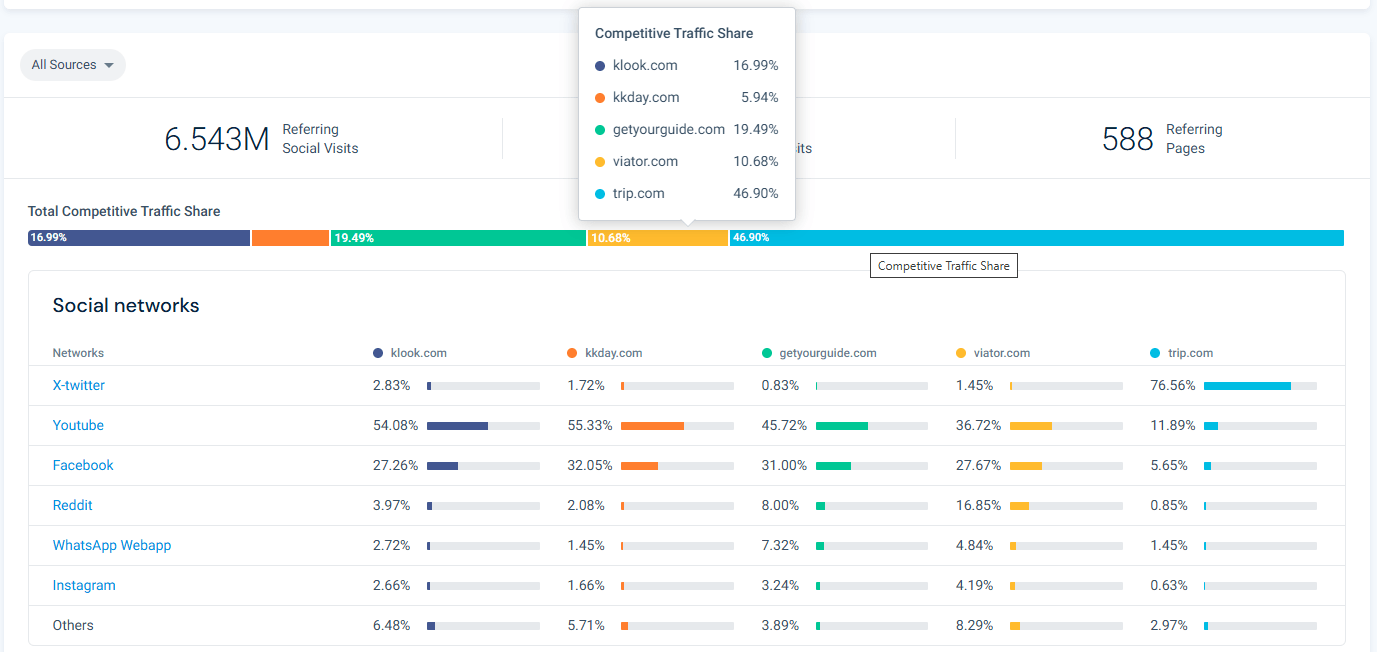
Klook relies heavily on YouTube and Facebook, which together account for the majority of its social traffic. In contrast, Trip.com dominates X (Twitter), driving over 75% of its social traffic from that channel alone, while other competitors show a more balanced mix across platforms like Reddit and Instagram.
From a competitive standpoint, this highlights two things. First, Klook’s current strategy is strong on traditional social platforms but less diversified. Second, there may be untapped opportunities in channels where competitors are gaining traction, particularly platforms that drive higher engagement or discovery.
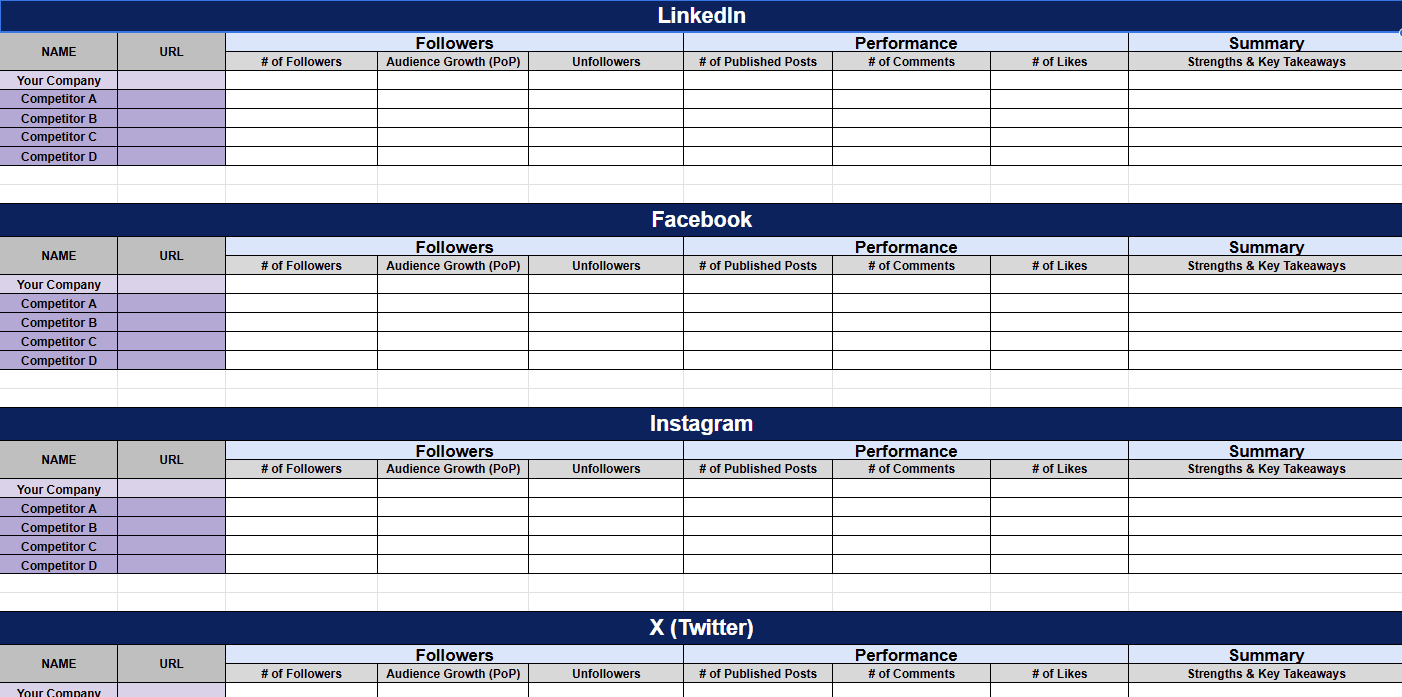
Get a copy of our full Social Media Analysis Template.
Global affiliate marketing spending reached approximately $18.5 billion in 2024 and is projected to grow at a 15% CAGR through the decade ahead, according to Post Affiliate Pro’s 2025–2026 market analysis. By studying your competitors’ affiliate partnerships, you can refine your own strategy to capture a bigger piece of this performance-driven channel.
Similarweb’s competitor analysis tools help you identify and evaluate potential partners to drive website traffic and build brand recognition through strategic backlinks.
Here are the main steps you need to take:
Let’s have a look at our competitive set’s performance of referrals:
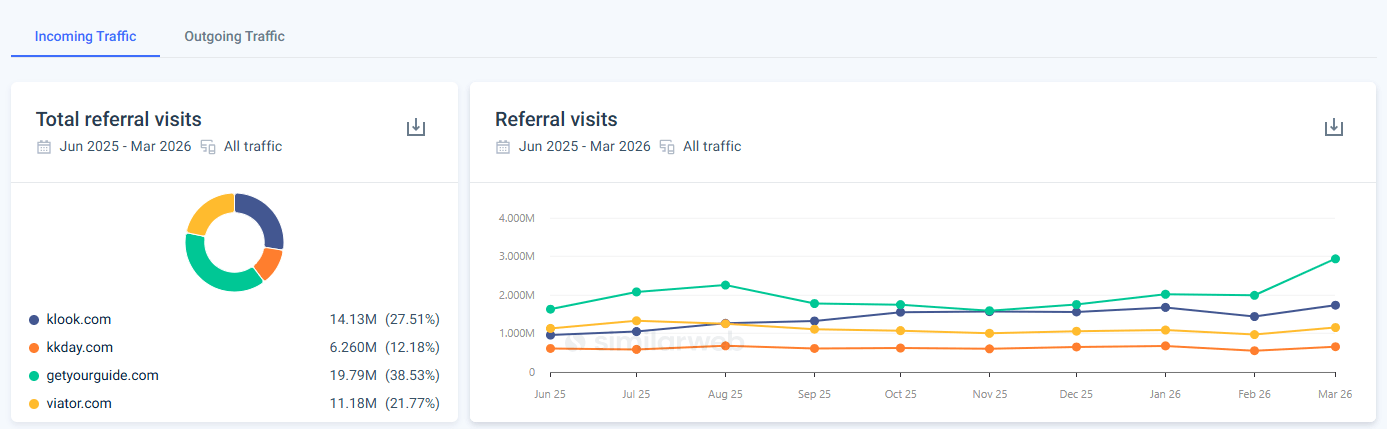
Referral traffic reveals another important part of the competitive landscape. GetYourGuide leads this channel with 38.5% share and nearly 20M visits, followed by Klook at 27.5% and 14.1M visits, which shows that partnerships and external sources already play a meaningful role in Klook’s acquisition strategy.
Looking at trends over time, Klook’s referral traffic is steadily growing, but at a slower pace compared to GetYourGuide, which continues to widen the gap. This suggests that while Klook has an established referral base, competitors are scaling partnerships more aggressively.
Breaking this down further, the sources themselves tell an interesting story.
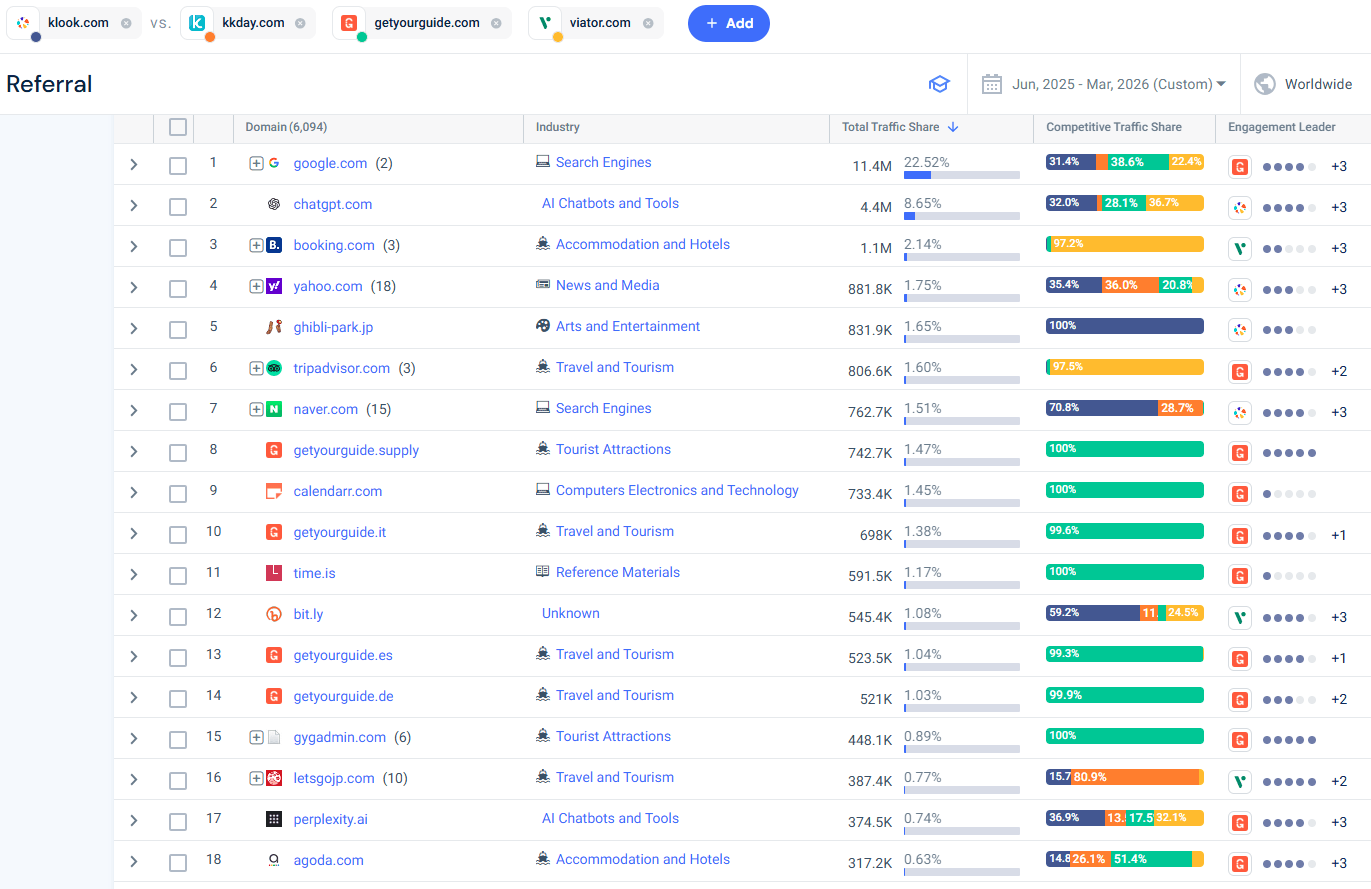
Traditional drivers like Google, Booking.com, and Tripadvisor remain key contributors, but newer sources such as ChatGPT and Perplexity are already appearing among the top referrers. This points to a shift in how users discover travel platforms, with AI-driven discovery starting to play a role alongside search and affiliate partnerships.
For Klook, this highlights that expanding partnerships and strengthening presence across emerging referral sources could help capture additional demand, especially as discovery continues to evolve beyond traditional channels.
For a more detailed breakdown, see our guide on how to find your competitors’ affiliates.
Generative AI platforms, ChatGPT, Perplexity, Gemini, and others, have become a meaningful discovery channel that your competitive analysis can no longer ignore. When a prospect asks an AI assistant “what’s the best [your category] tool?”, your brand either shows up or it doesn’t. And right now, most companies have no idea how their competitors are performing in these AI-generated answers.
According to Similarweb’s 2025 Generative AI Landscape report, generative AI platforms now attract around 7 billion average monthly web visits, representing 76% year-over-year growth. AI referrals to transactional sites convert at roughly 7%, higher than typical organic referral rates, evidence that AI assistants are evolving from curiosity to commerce.
That’s the opportunity. Here’s how to track it.
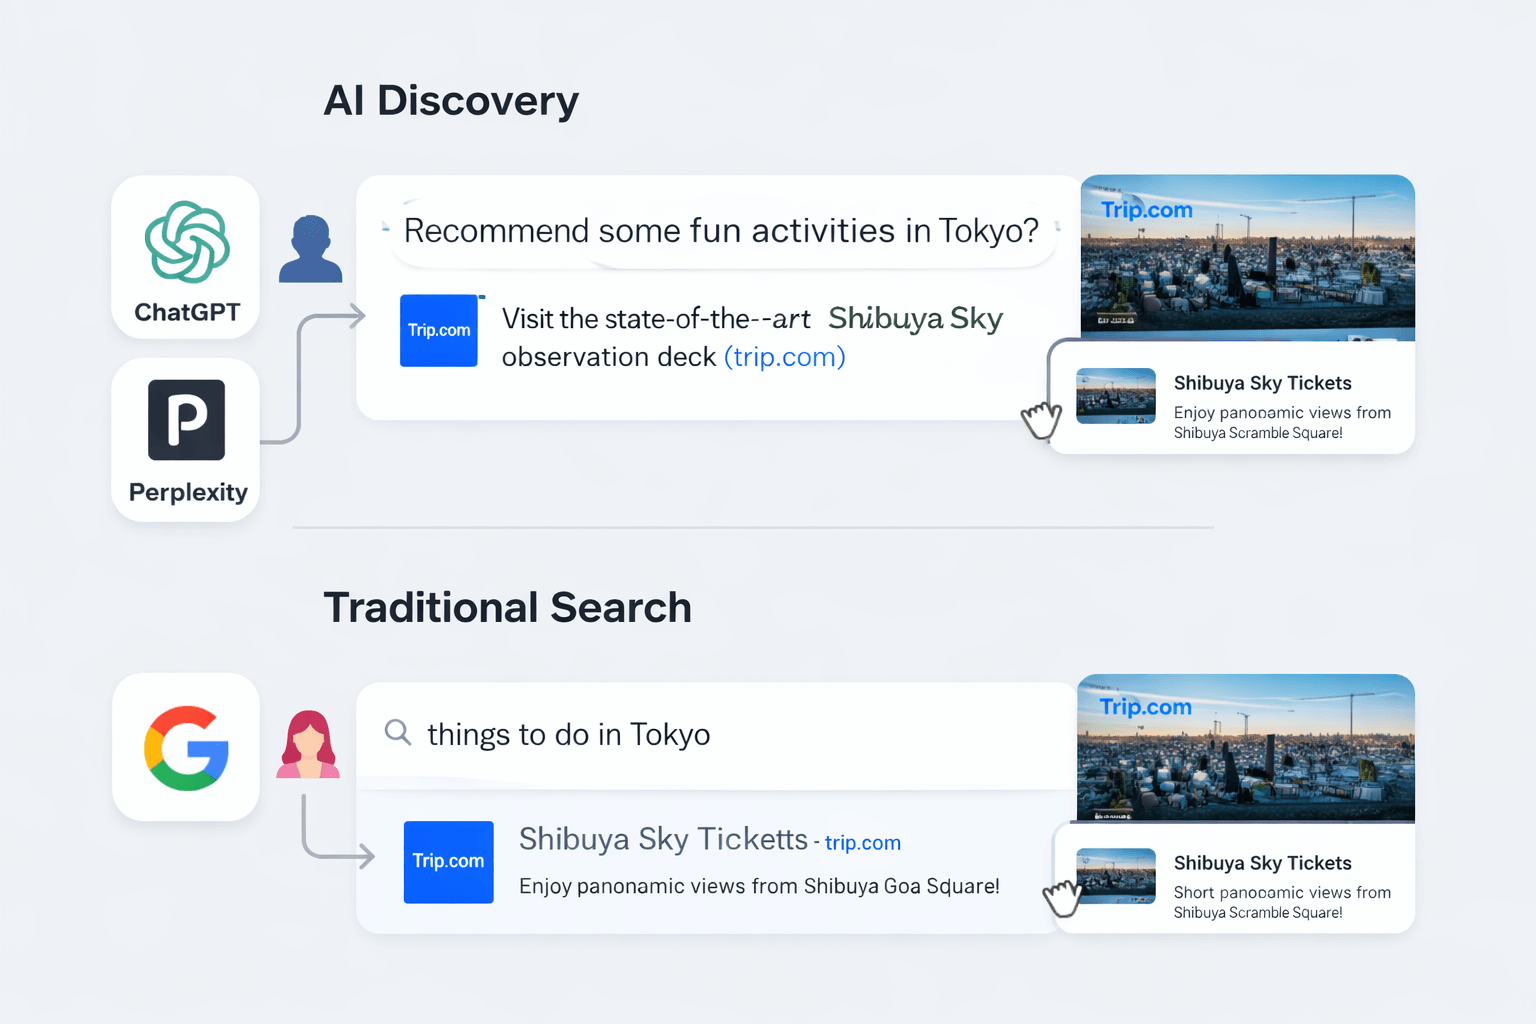
Similarweb’s AI Search Intelligence module is built around two core components, AI Brand Visibility and AI Traffic, that work together to give you a full-funnel view: visibility first, impact second. Here’s what each one does and how it connects to competitive analysis.
The AI Brand Visibility module answers the question traditional analytics can’t: when someone asks ChatGPT, Gemini, or Perplexity about my category, who do they recommend?
You start by setting up a campaign, defining the topics most relevant to your business (e.g., “SEO tools”, “competitor research”, “website analytics”) and selecting your competitors. Within 24 hours, the tool begins tracking brand visibility in AI-generated responses for those topics across the major LLM platforms.
The core metric is Visibility Share: the percentage of AI-generated responses for a given topic and time period in which your brand appears. The tool tracks up to 30 brands per topic, so you can see instantly which competitors dominate, which are emerging challengers, and where there are gaps you could fill.
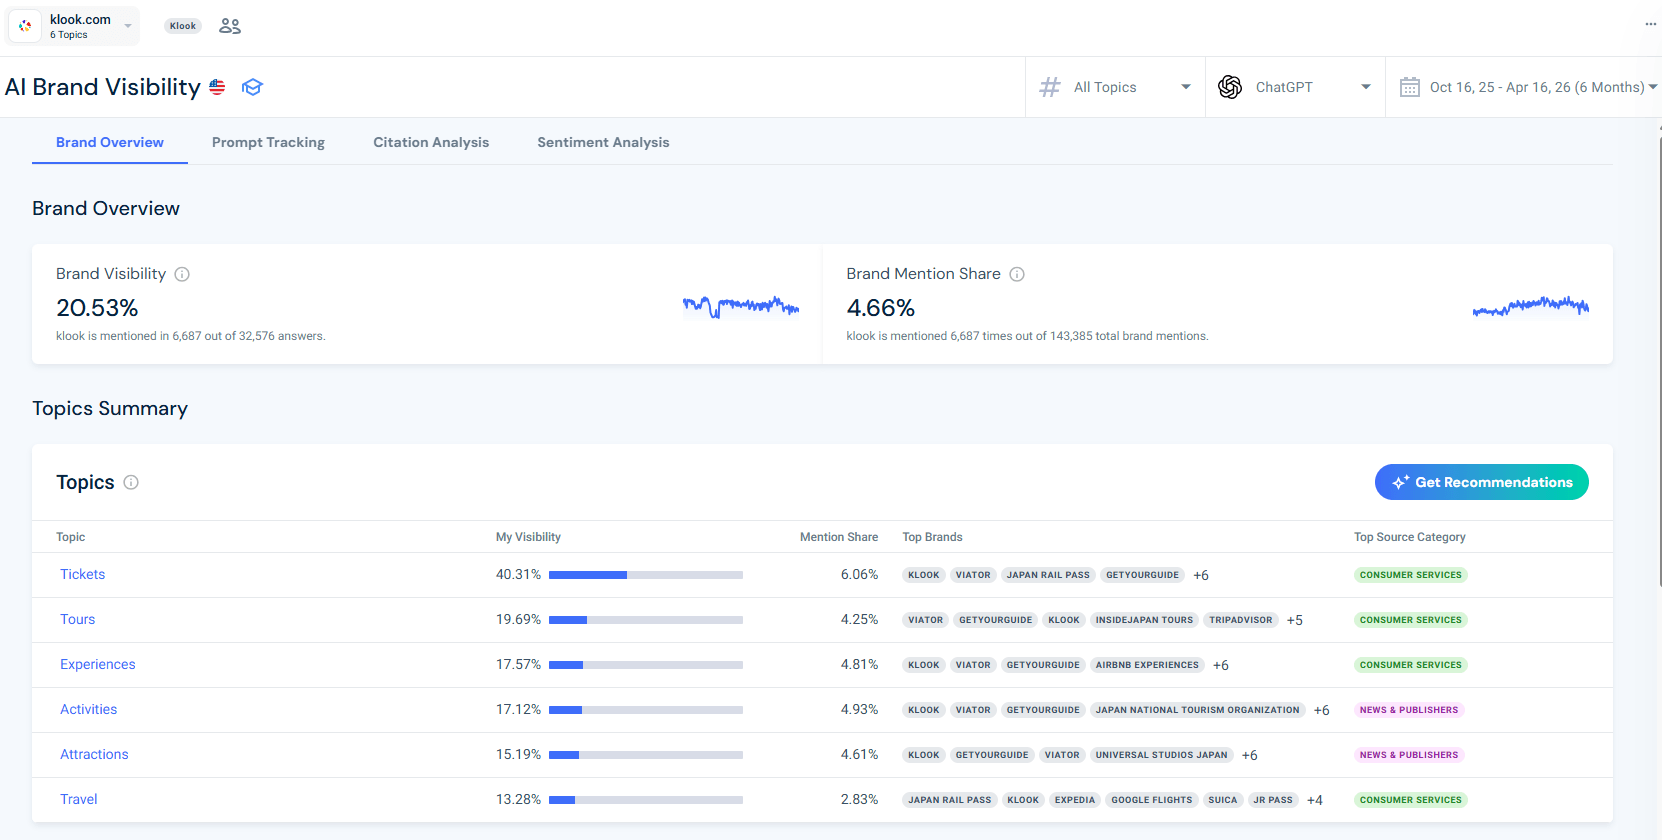
Overall, Klook has a visibility share of 20.5%, meaning it is mentioned in about one in five relevant AI responses. However, its brand mention share is much lower at 4.66%, which suggests that while Klook is present, it is not yet a dominant or consistently top-cited brand.
Breaking this down by topic reveals where Klook performs best. It has the strongest visibility in “Tickets” (40.3%), where it appears frequently alongside competitors like Viator and GetYourGuide. In broader categories like Tours, Experiences, and Activities, visibility drops into the mid-to-high teens, indicating stronger competition and less consistent presence.
This highlights a key insight. Klook is already well positioned in more transactional, high-intent queries, but has less visibility in broader discovery topics where users are still exploring options. Expanding content and brand presence in these areas could help increase both visibility and overall share of AI-driven recommendations.
Within the AI Brand Visibility module, there are four specific reports you’ll use for competitive analysis:
1. Prompt Analysis: Understand what questions drive your competitors’ visibility
The Prompt Analysis tool shows you the actual user prompts being asked in ChatGPT and other chatbots for each topic you’re tracking, along with the AI’s response, the brands mentioned, and the sources cited. For each prompt, you get a visibility score, a sentiment indicator, and a breakdown of which competitors appeared.
From a competitive analysis standpoint, this is genuinely powerful. If you see that a competitor is consistently mentioned in response to prompts like “best tool for tracking competitor traffic” or “how do I find my competitors’ keywords”, and you’re not, that’s a specific content gap you can close. It also tells you how users are phrasing questions around your category, which is intelligence you can feed directly into your content strategy and SEO.
For Klook, visibility varies significantly depending on the type of query. Let’s look at some of the prompts our campaign tracks:
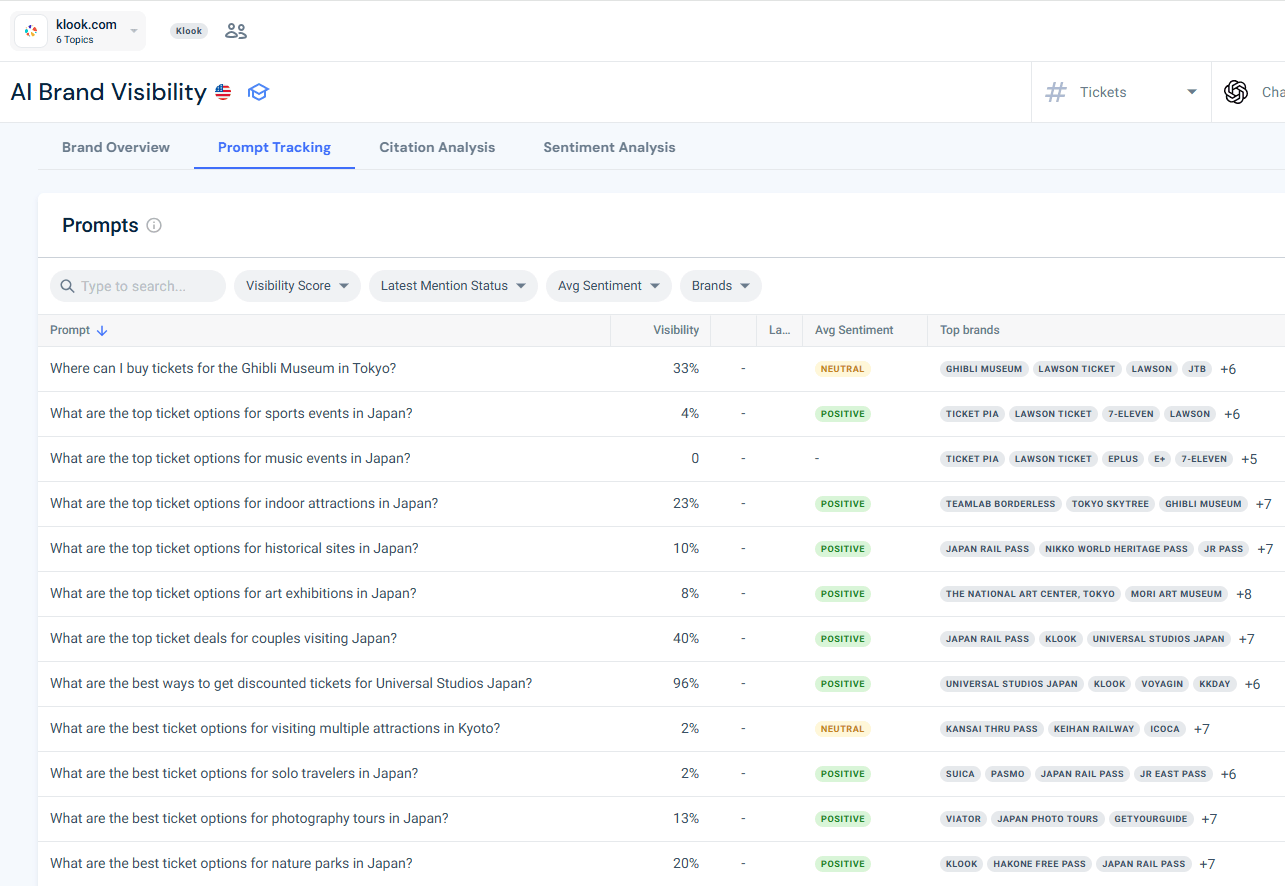
It performs very strongly on high-intent, deal-driven prompts, such as “discounted tickets for Universal Studios Japan,” where visibility reaches as high as 96%, indicating strong alignment with transactional demand.
However, visibility drops sharply for broader or more exploratory queries. For example, prompts like “best ticket options for sports or music events in Japan” show little to no presence, even though these represent valuable discovery-stage searches. This gap highlights where competitors are being recommended instead.
Another key insight is how users phrase their queries. Many prompts are highly specific and contextual, often tied to locations, use cases, or traveler types. This reinforces that AI search behavior is more conversational and intent-driven compared to traditional keyword search.
For Klook, the opportunity is clear. Expanding content to directly answer these types of prompts can help increase visibility in AI-generated responses, especially in areas where competitors currently dominate.
2. Citation Analysis: Find out which domains are shaping AI answers in your category
The Citation Analysis tool reveals which websites and domains AI platforms are citing as authoritative sources in responses for your tracked topics. This is a map of the entire external content ecosystem that shapes what AI says about your category.
The competitive intelligence use case here is underappreciated. If a competitor’s blog, a specific industry publication, or a review site keeps appearing as an AI citation source in your category, that domain has structural influence over how prospects discover brands. You can use this insight two ways: first, it tells you which publications to target for PR and earned media, because getting mentioned there increases your likelihood of appearing in AI answers; second, it shows you which types of content (brand pages, forums, news articles, UGC) AI platforms favor in your space, which should directly inform your content production priorities.
For Klook, its domain influence score of 45.35 indicates a solid presence, but the breakdown reveals a more nuanced picture.
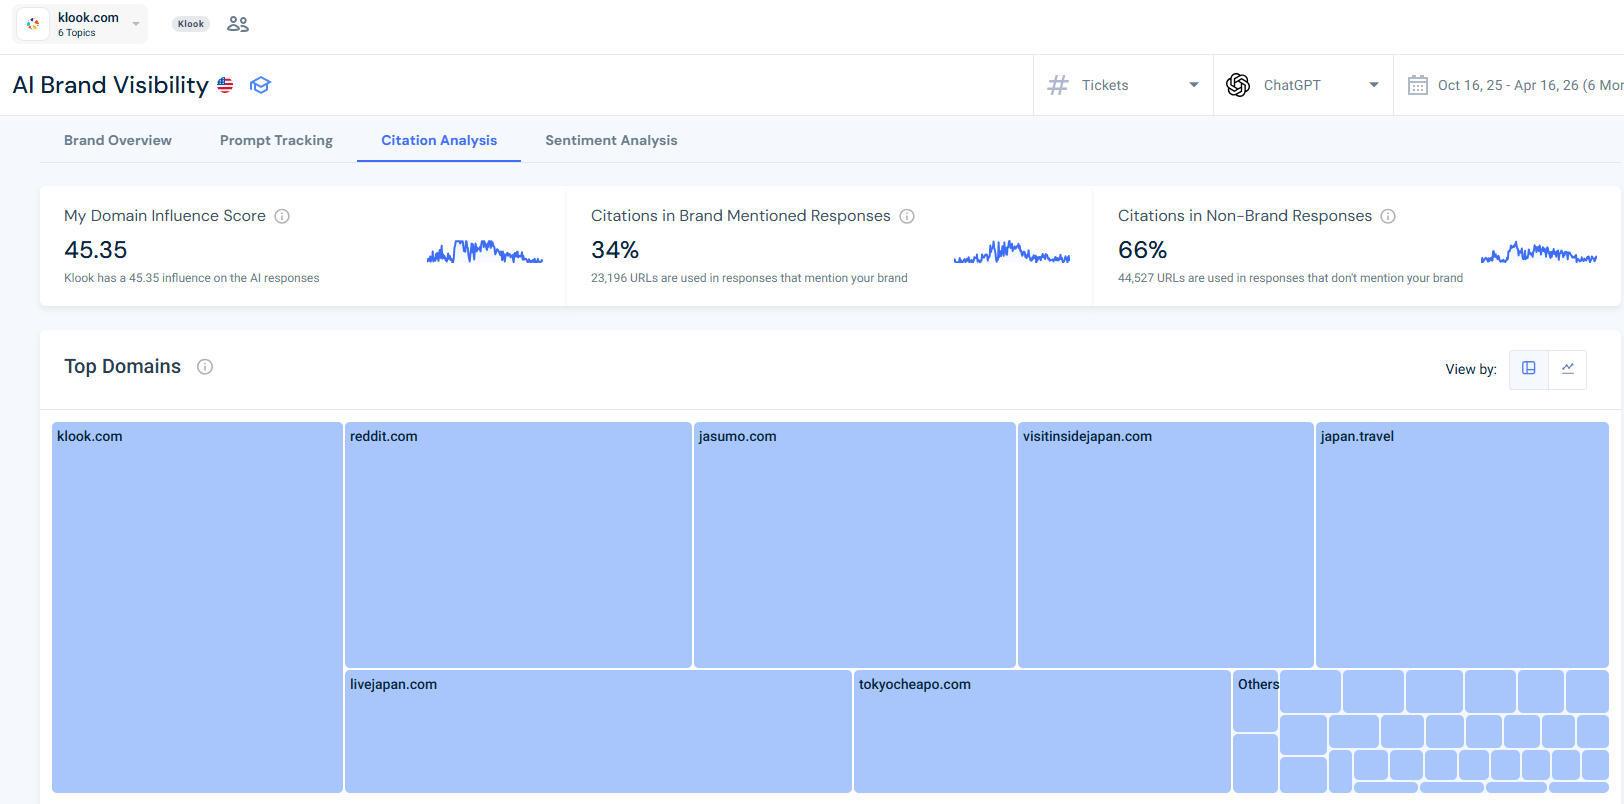
Only 34% of citations appear in responses that mention Klook, while 66% come from responses where Klook is not mentioned, highlighting a significant gap between influence and brand attribution.
Looking at the top cited domains, a large share comes from third-party content sources such as Reddit, travel blogs, and publisher sites like Japan.travel and TokyoCheapo.
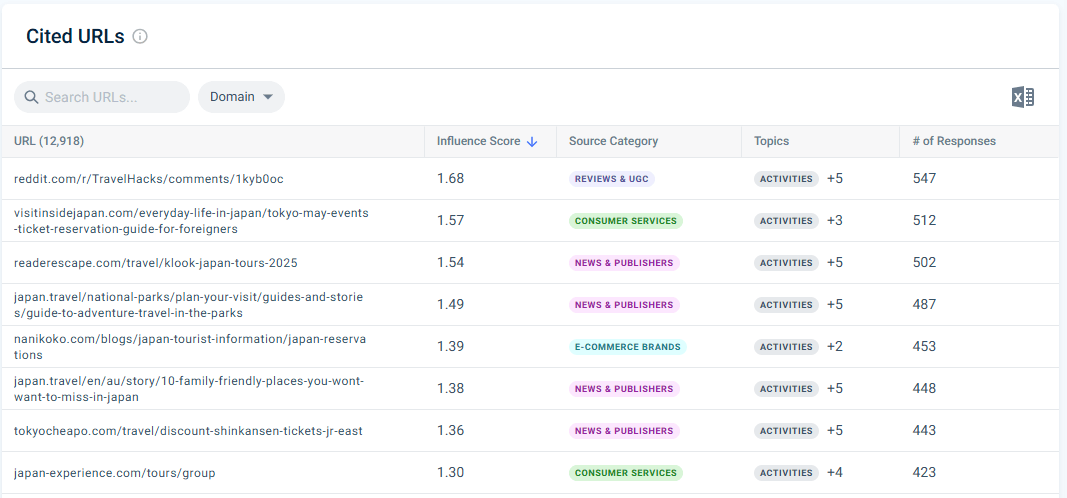
This shows that AI platforms rely heavily on editorial content, user-generated content, and travel guides, not just brand-owned pages, to generate recommendations.
At the URL level, many of the most frequently cited pages are informational guides and list-style content, often focused on activities, itineraries, or travel tips. This reinforces a key pattern. AI answers are shaped more by helpful, experience-driven content than by transactional pages alone.
For Klook, this creates two clear opportunities. First, increasing presence on high-influence domains through PR, partnerships, or content contributions can improve visibility in AI responses. Second, investing in more authoritative, guide-style content can help ensure that Klook is not only part of the ecosystem, but also directly cited and recommended more often.
3. Sentiment Analysis: Benchmark how AI describes you versus competitors
The Sentiment Analysis tool tracks whether your brand and your competitors’ are mentioned positively, neutrally, or negatively in AI-generated responses, broken down by topic and over time. A Sentiment Score ranging from −1 to 1 lets you compare brand perception across your competitive set in a Sentiment Score Comparison heatmap.
If a competitor consistently earns stronger positive sentiment on topics like “ease of use” or “customer support” in AI answers, that’s a signal about what real users are saying about them in the content AI is learning from, and it’s a gap in your own narrative. Conversely, if a competitor is getting negative mentions around a specific topic like pricing transparency, that’s an opening for your own positioning. The ability to benchmark sentiment, not just presence, turns this from a vanity metric into a strategic one.
For Klook, around 66% of mentions are neutral, with 33% positive and only 1% negative, which indicates that Klook has a stable reputation but is not strongly differentiated in how it is perceived.
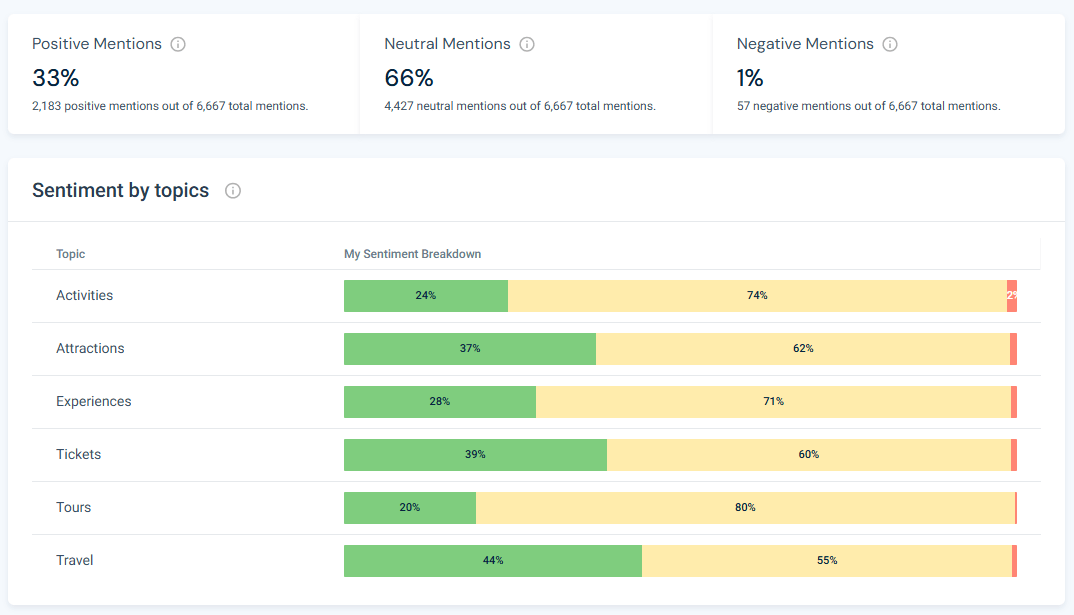
Looking deeper by topic, sentiment varies depending on the category. Klook performs best in broader areas like Travel (44% positive) and Tickets (39% positive), where it is more frequently associated with helpful or favorable recommendations. However, in categories like Tours and Activities, positive sentiment drops closer to 20 to 25 percent, with the majority of mentions remaining neutral.
This suggests that while Klook is consistently included in AI responses, it is not always being highlighted as the top or most distinctive option. For competitive analysis, this is an important distinction. Visibility alone is not enough if competitors are being described more favorably.
The opportunity here is to strengthen how Klook is positioned within the content ecosystem that AI models rely on. Improving messaging around key strengths such as ease of booking, value, or unique experiences, can help shift more mentions from neutral to positive over time.
The AI Traffic Tracker shifts from visibility (are you being mentioned?) to impact (are those mentions sending real visitors?). It tracks the estimated referral traffic flowing from ChatGPT, Perplexity, Gemini, and other AI platforms to any website, including your competitors’, over time.
Visibility and traffic don’t always correlate. A competitor could be mentioned frequently in AI answers but generate very little click-through traffic if users are satisfied with the AI’s response itself. Conversely, a competitor with moderate visibility but highly specific, high-intent prompts may be converting AI visits at a much higher rate. AI Traffic lets you see both sides.
For competitive analysis, here’s how to use AI Traffic data:
Klook leads in this channel with an average of ~182K monthly visits from AI platforms, followed by Viator at ~156K and GetYourGuide at ~100K. This suggests that
Klook is not only being mentioned, but is also successfully converting AI visibility into clicks.
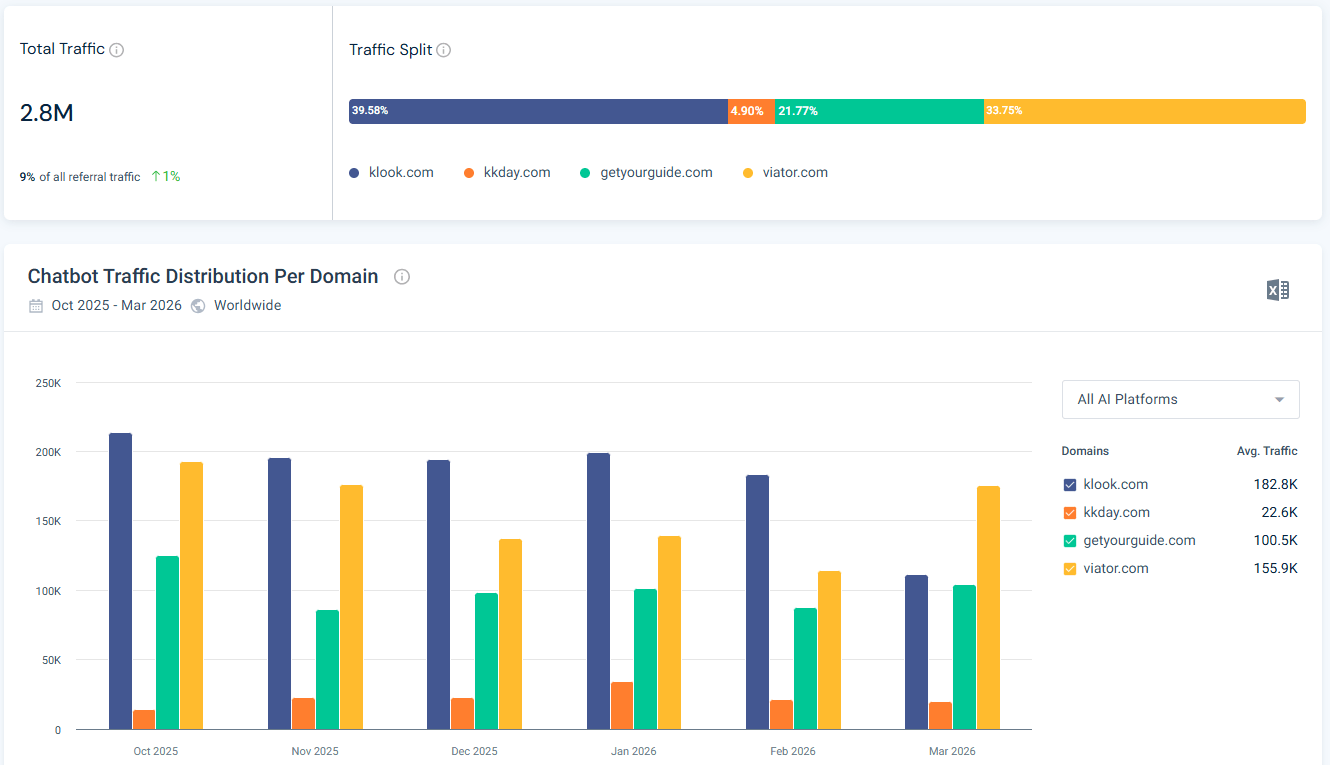
Looking at the traffic split, Klook captures the largest share at ~39.6%, well ahead of competitors. This is a strong signal that its presence in AI-generated answers is aligned with high-intent queries that drive users to take action.
Over time, AI-driven traffic appears relatively stable with some fluctuations, but remains consistently meaningful across all players. This indicates that AI is already an established referral channel, not just an emerging one.
The key takeaway is that visibility alone does not guarantee traffic. Klook’s ability to capture a larger share of visits suggests it is performing well on prompts where users are more likely to click through. For competitive analysis, this helps identify not just who is being mentioned, but who is actually benefiting from AI-driven discovery.
The power of the AI Search Intelligence module comes from using AI Brand Visibility and AI Traffic together. Here’s the workflow:
👉 Pro tip: Add AI visibility benchmarking to your regular competitive tracker review. Shifts in AI share of voice often precede shifts in organic traffic by weeks or months, making this an early warning signal worth watching.
Let’s talk about some of the most popular frameworks that make competitive analysis systematic and insightful:
1. SWOT Analysis: This classic framework is ideal for pinpointing your competitors’ strengths and weaknesses. It’s particularly useful for uncovering potential competitive advantages and areas for improvement in your business.
2. Porter’s Five Forces: Created by Harvard professor Michael Porter, this framework looks at five essential forces shaping every industry:
Using Porter’s Five Forces, you can get a clearer picture of the market dynamics affecting your business.
3. Growth-Share Matrix: If you manage a diverse product portfolio, this matrix can help you strategize which products to focus on. It classifies your offerings into four categories:
This approach shows where to channel your resources and which products might need a strategic shift.
4. Customer Journey Map: A customer journey map is a visual story of your customers’ interactions with your brand. Start by mapping every customer channel, your website, social media, email, customer support, and in-store (if applicable). Track the customer experience across these touchpoints, highlighting engagement metrics, brand responses, and opportunities to improve the journey.
Want more frameworks? Check out our complete list of competitive analysis frameworks for more on this topic.
Now that you understand what makes a competitive analysis effective, let’s put it into practice. Our templates and comprehensive, up-to-date datasets give you everything you need to dive deep. All that’s left for us to do is include a set of downloadable templates throughout the blog to streamline your competitive analysis. You can also find them here below:
Get a copy of our full competitive analysis template here
Preview:
Get a copy of our full audience analysis template here
Preview:
Get a copy of our full competitive matrix template here
Preview:
Get a copy of our full SWOT analysis template here
Preview:
Get a copy of our full Buyer Persona Template here
Preview:
Get a copy of our full Social Media Analysis Template here
Preview:
Use these competitive analysis templates to hit the ground running with proven frameworks. They’ll help you uncover insights faster!
Competitive analysis is a powerful tool that can and should fuel every function in your business, from marketing to product development and beyond.
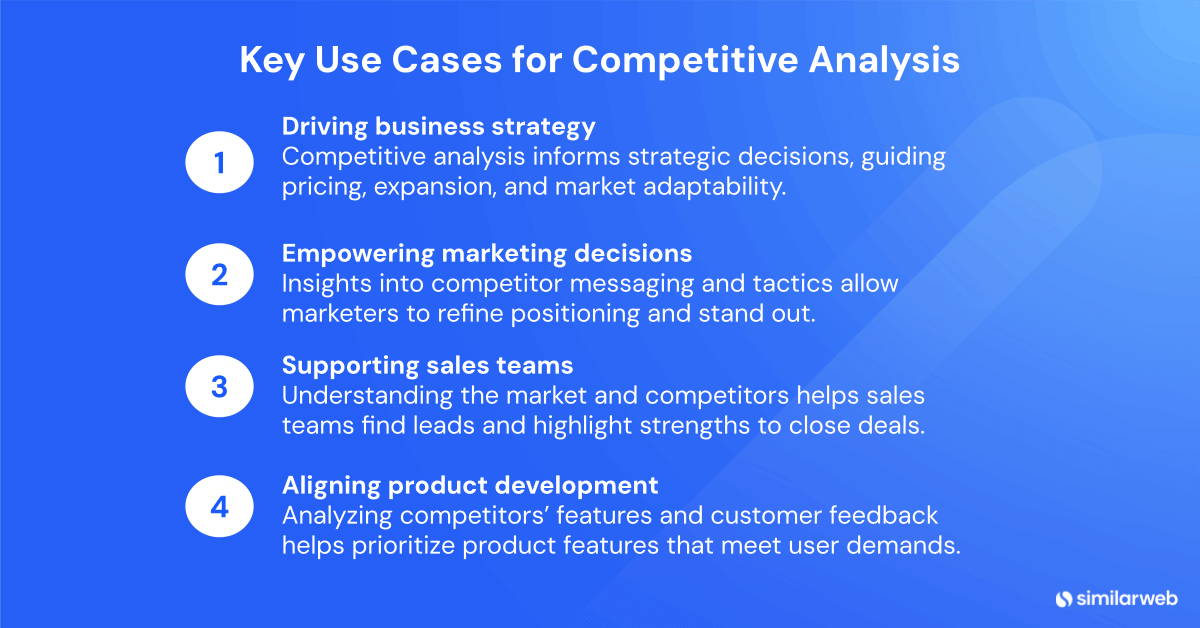
Competitive analysis isn’t a one-time activity, it’s a continuous process you need to carry out to guide your decision-making across key business functions.
A competitive analysis is a powerful tool in your business toolkit, but only if done regularly within a structured review process. Setting up periodic reviews ensures that your insights stay relevant and actionable as the market evolves and new opportunities arise.
A well-defined review process should include concrete business recommendations and specific action items, as well as a system for follow-ups to track progress.
Most businesses find that monthly or quarterly reviews are ideal for keeping a pulse on the competitive landscape. However, for more tactical decisions, like adjusting keyword focus, budgeting for ad campaigns, or responding to seasonal trends, weekly or even daily reviews are considered best practices.
The traditional guidance on competitive review cadence was built for a world where competitors moved slowly.. That world is changing. AI tools now allow competitors to publish content at scale, test new landing pages rapidly, launch new keyword campaigns quickly, and adjust pricing in near real-time. Meanwhile, AI answer engines are surfacing new brand winners and losers at a pace that doesn’t wait for your quarterly review.
This doesn’t mean you need to check your competitive tracker every morning. But for fast-moving categories, SaaS, ecommerce, and media, a monthly review cadence is now the minimum. Consider setting up automated alerts in your Similarweb Competitive Tracker for traffic spikes, new ad creatives, and keyword movement. For AI visibility specifically, Similarweb’s AI Search Intelligence module lets you benchmark your brand’s presence across AI platforms, track this monthly alongside your traditional competitive metrics to catch shifts early.
For more context on how AI search channels are evolving and why they matter for competitive strategy, the Similarweb guide on AI visibility investment has a solid breakdown of the data behind the shift.
Review your competitive analysis during key business moments like strategy shifts, product launches, or market expansion. This deeper analysis helps you adjust goals, spot gaps, and identify quick wins. Make it a regular practice, and you’ll confidently navigate market changes, always staying one step ahead.
When it comes to competitive analysis, having the right tools in your arsenal can make all the difference. These tools allow you to access, visualize, and interpret valuable competitor data, helping you stay one step ahead.
Yeah, I work here, so I’m biased… but also, this is exactly the kind of problem Similarweb was built to solve.
Similarweb doesn’t just give you a few metrics, it gives you a connected view of your entire competitive landscape. You can analyze traffic, engagement, marketing channels, keyword strategies, referrals, and even how competitors are showing up in AI platforms like ChatGPT and Perplexity.
The real strength is in how everything ties together. You’re not looking at SEO in isolation or paid in a vacuum. You can move from high-level trends, like market share and traffic growth, all the way down to specific keywords, landing pages, ad creatives, and referral sources driving performance.
It also goes beyond traditional analytics. With tools like AI Search Intelligence, you can track where competitors are being recommended in AI-generated answers and whether that visibility actually turns into traffic. Add in competitive tracking, alerts, and real-time updates, and you’re not just analyzing competitors, you’re keeping up with them as they move.
If your goal is to make data-driven decisions based on actual market behavior rather than guesswork, it’s a pretty hard tool to beat.
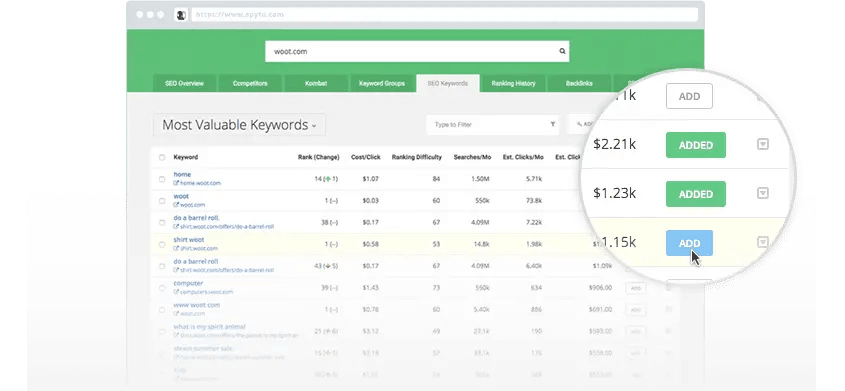
SpyFu lets you peek into your competitors’ SEO and PPC strategies. Enter a domain, and you’ll see precisely where competitors appear on Google and Bing, their organic rankings, target keywords, and ad spend. It’s particularly valuable for understanding their paid search tactics and finding new keyword opportunities.
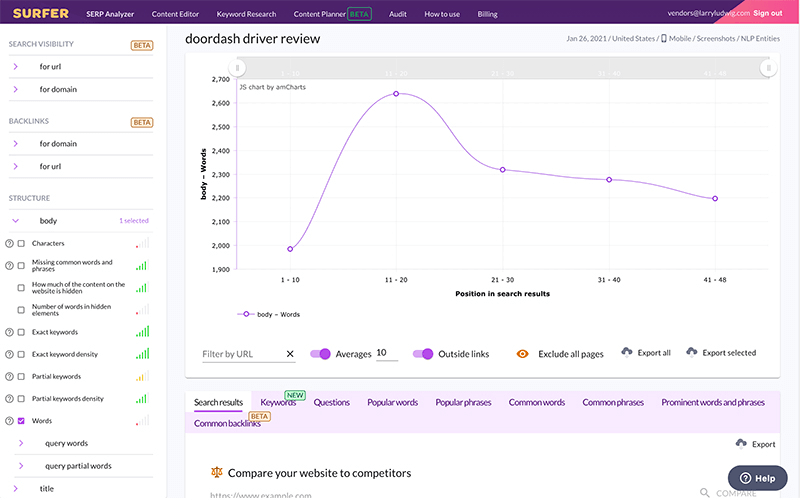
Surfer analyzes your content against top-ranking pages in real-time, helping you adopt the strategies that work for your competitors. You’ll also see how to optimize your content to meet search intent and audience expectations, plus essential insights for improving your search rankings.
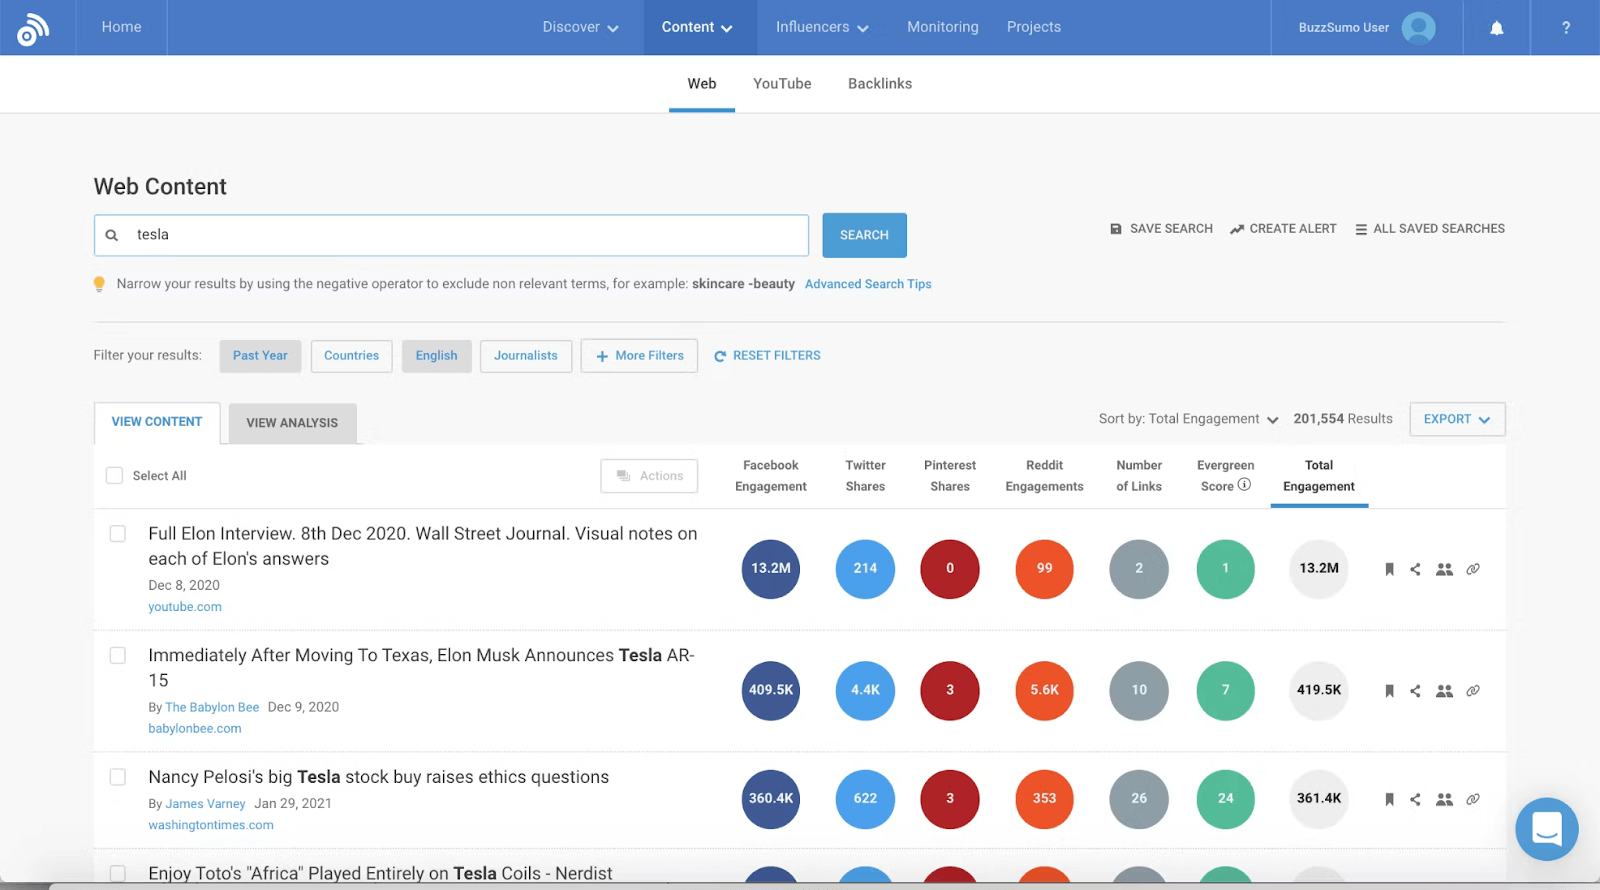
BuzzSumo shows you which competitor content performs best, from blog posts to videos to infographics. You’ll see the most shared and engaging pieces in your market, helping you spot content trends and opportunities your competitors have missed.
For a more detailed breakdown of each tool’s features, pricing, and ideal use cases, see our list: Best Competitor Analysis Tools.
We’ve covered it all. From assessing the broader market to breaking down competitor strategies and understanding how they serve their audiences.
You now have a blueprint for uncovering opportunities and building a strategy that plays to your strengths while targeting competitor gaps. Remember, though, the key is having reliable, comprehensive data, and the right framework for acting on it fast.
With Similarweb’s up-to-date data and competitive analysis tools, including the growing suite of AI intelligence capabilities, you’ll have the insights you need to understand traffic patterns, market share, and now the emerging world of AI-driven discovery. So, you’re ready to analyze your market and win it.
What is competitive analysis?
Competitive analysis is the process of collecting and reviewing information about your competitive landscape.
What should I include in a competitive analysis?
In your competitive analysis, you should assess your competitors’ strengths, weaknesses, market share, pricing, marketing strategies, and customer feedback. Also evaluate their innovation, distribution channels, overall financial health, and, increasingly, their visibility in AI search platforms. This will help you identify opportunities and threats in your industry.
How can I conduct a successful competition analysis?
Use Similarweb to determine the demographic makeup of your customer base across desktop and mobile. Identify the sites consumers visit, evaluate emerging or declining performers, find industry trends and marketing strategies you can implement, and track how your brand and competitors appear in AI-generated answers.
What is a competitive analysis framework?
A competitive analysis framework is a structured approach to compare your company’s marketing strategy to your competitors to inform strategic decision-making. It involves evaluating market dynamics, industry trends, and competitor performance.
What is competitive AI analysis?
Competitive AI analysis is the process of tracking how your competitors perform across AI-powered platforms like ChatGPT and Perplexity. It reveals which pages and topics are driving visibility and traffic from these sources. See the full guide on analyzing competitors’ AI traffic for a step-by-step walkthrough.

by Roie Gortler
Senior Product Marketing Manager
With 15+ years in product marketing, strategy, branding, and PR, Roie has driven growth at top agencies and tech firms through product launches and go-to-market strategies.

What Is Retail Intelligence? How It Works and Why It's Essential to Digital Commerce

Most Searched Things on Google in 2026
The ultimate solution to help you build the best digital strategy
