





The Top 100 Most Visited Websites in the USA (August 2026)
by Shai Belinsky10 Min.
Sep 29, 2026
 Marketing Intelligence
Most marketers instinctively know they need multiple channels. Fewer know which ones are actually driving their competitors’ growth and which ones to prioritize with a limited budget.
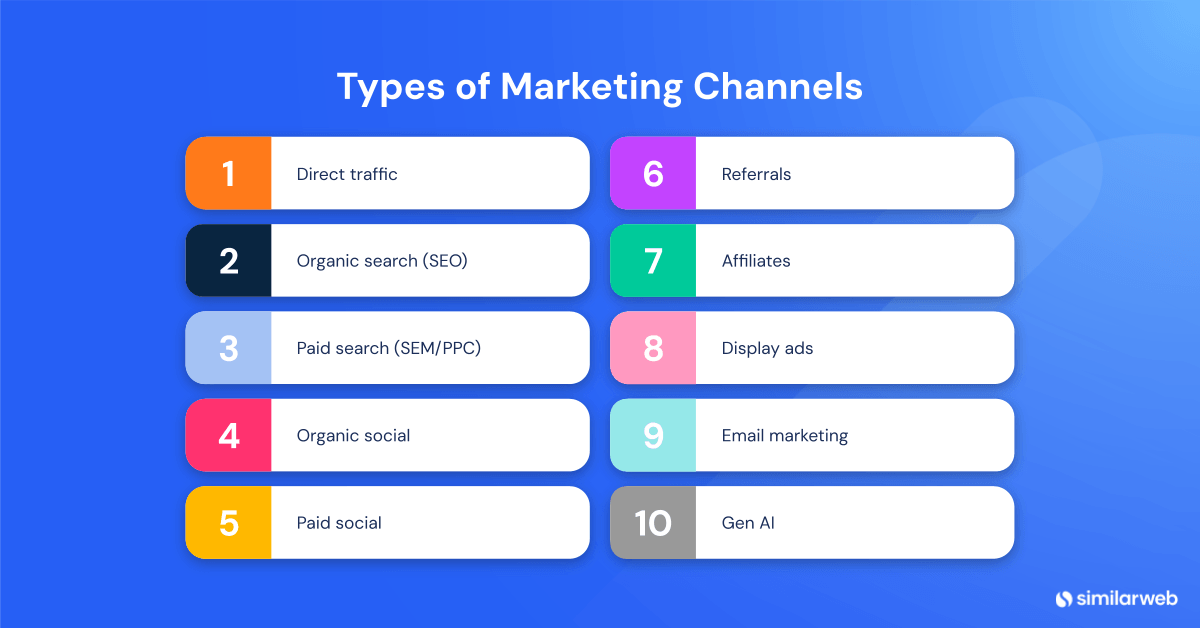
That distinction is now harder to ignore. In 2026, the channel mix has broken into more pieces than most marketing teams are tracking. AI platforms are capturing consumer attention before anyone opens a search bar. Social commerce has become a primary revenue driver, not just an awareness play. Referral traffic from AI tools converts at rates that make traditional paid search look expensive by comparison. And Similarweb now tracks 10 distinct traffic channels (including Gen AI and a standalone Affiliates channel), giving marketers a more precise view of where audiences actually come from than ever before.
This guide walks through every major marketing channel, what makes it work in 2026, and how to use real competitive data to build the mix that’s right for your business.
Marketing channels are the distinct pathways through which visitors arrive at your website and discover your brand. In analytics tools and competitive intelligence platforms, they represent the initial source of a visit: direct, organic search, paid social, email, Gen AI, and so on.
The goal of each channel is to reach a specific audience at a specific point in their decision journey. A brand-new prospect discovering you through organic search is in a completely different mindset than a loyal customer returning via a direct bookmark, or a high-intent buyer arriving after asking ChatGPT for a product recommendation.
Critically, channels differ not just in who they reach, but in how ready those visitors are to act. That’s why channel mix strategy (not just channel presence) determines whether your marketing budget works.
There are offline channels (direct mail, print, events) and online channels. This guide focuses on digital marketing channels, specifically the ones that drive measurable web traffic.
The stakes of getting your channel mix wrong have risen sharply. Three forces are changing how channels perform right now:
AI is intercepting the top of the funnel – According to our Gen AI Statistics, AI platform visits grew 28.6% between January 2025 and January 2026 (US, desktop and mobile combined), while referrals from those platforms to external sites remained flat. More users are using AI, but AI is keeping their attention rather than sending it to websites. Brands that aren’t visible in AI answers are being filtered out before the journey even begins.
Channel performance diverges by audience type – According to HubSpot’s 2026 State of Marketing Report (based on data from over 1,500 global marketers), Website/SEO is the top ROI channel overall. For B2C brands specifically, email marketing ranks first. Paid social leads for B2B, while organic social and content marketing lead for B2C awareness. One-size-fits-all channel strategies underperform.
Competitive benchmarking is now possible at the channel level – Similarweb’s April 2026 Marketing Channels upgrade introduced a 37-month recalibrated dataset and new channel granularity, including Gen AI as a measurable channel. It’s now possible to see exactly which channels are driving competitor growth and where your traffic distribution diverges from industry benchmarks.
Sending the right message through the wrong channel, or concentrating budget in a channel your audience isn’t using, costs you more than just efficiency. It costs you your competitive position.
Not all channels do the same job. Some build awareness among people who have never heard of you. Others convert visitors who are already close to a decision. Some you own outright; others depend on algorithms, ad auctions, or third-party platforms. Understanding what each channel is built for, and which Similarweb tools give you visibility into it, is the starting point for building a mix that actually reflects how your audience moves.
Direct traffic consists of visitors who type your URL directly into their browser, use a bookmark, or arrive from a link that doesn’t pass a referral signal (including some messaging app links).
Direct traffic is a proxy for brand strength. A high direct traffic share tells you that visitors know your brand well enough to seek you out without a prompt. These visitors are typically your most loyal, highest-intent users: return customers, brand advocates, and people deep into a purchase decision.
Optimizing this channel means optimizing your brand itself: memorable naming, consistent presence, and experiences that bring people back. A healthy direct traffic share is also a signal AI platforms pick up on.
Use Similarweb’s benchmarking tools to compare your direct traffic share against competitors and your industry benchmark. If your share is below category average, that gap is usually a brand awareness problem before it’s a channel problem.
What to track: Direct traffic share vs. competitors; period-over-period growth as a brand awareness signal.
Organic search remains the highest-volume channel for most websites, accounting for roughly 40.6% of all website traffic globally, and it’s the top ROI-generating channel overall according to HubSpot’s 2026 data.
The mechanics are well-understood: create content that answers what people search for, optimize it for crawling and relevance, and earn authority through backlinks and engagement. But the nature of organic search itself is changing. According to BrightEdge’s year-on-year analysis, AI Overviews now appear on roughly 48% of Google searches, up 58% from February 2025, and organic CTR on those queries has dropped 61% (from 1.76% to 0.61%), per Seer Interactive’s research. Ranking well no longer guarantees a click.
The practical implication: in 2026, an organic search strategy requires two parallel tracks. Traditional SEO for queries where users still click through, and Answer Engine Optimization (AEO) for queries where you need to appear in the answer, not below it. According to HubSpot’s data, 41% of marketers say updating their SEO strategy for AI search changes is their top priority in 2026.
Similarweb’s SEO tools let you compare your organic traffic share against competitors, track keyword rankings, and identify where competitors are gaining organic ground you haven’t contested yet. Beyond traffic share, you can deep-dive into individual keyword performance, seeing which terms each competitor ranks for, how clicks are distributed across the competitive set, and where gaps exist that represent untapped organic opportunity.
What to track: Organic traffic share; keyword rankings; competitor organic growth; keyword click share gaps vs. competitors; AI Overview presence for your priority terms.
Paid search (ads that appear when users search for specific terms) is the fastest way to reach high-intent audiences. You’re paying to appear at the moment someone is actively looking for what you offer.
The channel is especially effective for bottom-of-funnel acquisition: conversion campaigns, competitive conquesting, and reaching new audiences with high transactional intent. According to HubSpot’s 2026 State of Marketing data, paid social media ranked as the second-highest ROI channel for B2B brands, with paid search closely behind.
Effective paid search requires ongoing attention: keyword bidding strategy, match type management, landing page optimization, and negative keyword pruning. The biggest mistake most brands make is bidding on the same broad terms as their largest competitors without a differentiated angle, burning budget on impressions that don’t convert.
Similarweb’s paid search analysis tools reveal which keywords your competitors are bidding on and their estimated ad spend, so you can find gaps and opportunities your own research might miss. You can also see estimated PPC spend and cost per visit across competitors, giving you a budget-level view of how aggressively each brand is investing in the channel.
What to track: Click-through rate; cost per click; conversion rate; competitor paid keyword share.
Organic social covers unpaid posts, stories, videos, and community activity across social platforms: Instagram, LinkedIn, TikTok, Facebook, YouTube, Reddit, and others.
The channel’s role in 2026 is primarily awareness and relationship-building, not direct conversion. According to HubSpot’s 2026 State of Marketing Report, Instagram has overtaken Facebook as the most-used platform (70% of brands), and TikTok has surpassed X in both brand usage and ROI perception, with 54.5% of brands now using it. LinkedIn remains the dominant B2B platform, used by 47% of B2B marketers.
The format that changed everything: short-form video (under 60 seconds, optimized for vertical viewing) now delivers the highest ROI of any media format, with 48.6% of marketers ranking it in their top three. Even B2B brands are adapting; 44% now use short-form video for product demos and customer testimonials.
The practical lesson: social organic works when content is native to the platform, not repurposed from other channels. A LinkedIn post that reads like a press release, or a TikTok that looks like a TV ad, will underperform against content built for how that platform’s audience actually behaves. For guidance on where social media and SEO intersect, that connection is more direct than most marketers realize.
What to track: Reach and engagement rates by platform; follower growth; share of organic social traffic vs. competitors.
Paid social refers to traffic from sponsored content and ads on social platforms, now tracked as a separate channel from organic social in Similarweb’s 2026 Marketing Channels data. This separation matters because it makes the ROI of your paid social investment independently visible, rather than blended with organic performance.
Meta and Google together account for nearly half of all digital ad spending (46.9%), making paid social one of the largest budget allocations for most mid-to-large brands. For B2C marketers, paid social channels drove the second-highest ROI in HubSpot’s 2026 data, with social shopping tools close behind.
The most important principle for paid social in 2026: platform-native creative dramatically outperforms generic ads. Audiences on TikTok, Instagram, and Facebook have been trained to scroll past anything that looks like an advertisement. Content that mimics organic, native formats (creator-style video, real testimonials, lo-fi product clips) consistently outperforms polished production on every measurable ROI metric.
Total social media ad spend is projected to reach $338.75 billion globally in 2026. Budget alone won’t differentiate you. Creative strategy and audience precision will.
What to track: Paid social traffic share vs. competitors; cost per acquisition by platform; creative performance by format.
Referral traffic comes from links on external websites that aren’t search engines, social platforms, or affiliates: news coverage, blog mentions, industry directories, partnerships, and reviews.
This channel is a proxy for credibility. High-quality referral links signal that authoritative third parties trust your brand enough to link to it, which has a compounding effect. It builds SEO authority, drives direct qualified traffic, and increases your likelihood of being cited by AI platforms.
Domains with millions of mentions on platforms like Reddit and Quora have roughly 4x higher AI citation rates. Review platforms (G2, Capterra, Trustpilot) increase ChatGPT citation probability by 3x. Building a referral profile is no longer just a traffic and SEO play. It’s now directly correlated with AI visibility.
Use Similarweb’s referral research tools to discover which sites are driving referral traffic to your competitors, then identify partnership and outreach opportunities your brand is missing.
What to track: Referral traffic share; top referring domains; competitor referral sources; coverage on review platforms.
As of April 2026, Similarweb tracks affiliate traffic as a standalone channel, distinct from general referrals. Affiliate partnerships involve third-party sites earning commissions for driving sales or traffic, and their performance behaves differently from editorial mentions or organic links.
Affiliate marketing works on a pay-for-performance model, which makes it capital-efficient: you pay when results happen. The channel is especially effective for ecommerce and subscription businesses where conversion events are clearly defined and trackable.
The affiliate channel has grown significantly in recent years as performance-based media has expanded beyond traditional coupon and cashback sites into influencer-led content, review blogs, and comparison platforms. In some industries (finance, software, consumer goods), affiliates drive a disproportionately large share of competitor traffic, and that’s now visible and benchmarkable for the first time.
What to track: Affiliate traffic share vs. industry; which affiliate categories drive the most volume for your top competitors.
Display advertising covers visual banner ads, programmatic placements, and native ad units on third-party websites and networks. Unlike paid search (which captures existing intent), display creates awareness and enables retargeting by reaching users who’ve already interacted with your brand but haven’t converted.
Display is particularly effective for three specific use cases: retargeting website visitors who bounced before purchasing, cart abandonment recovery, and awareness campaigns reaching new audiences at scale. Similarweb’s Ad Intelligence platform lets you see exactly which ad networks and publishers are driving display traffic to your competitors, which creatives they’re running and for how long, and where each brand is concentrating its display spend across publishers.
In 2026, display ads work best as a complement to other channels, reinforcing brand messages that audiences first encountered through organic or paid search, then following them across the web until they’re ready to convert.
What to track: Display traffic share; competitor ad networks and publishers; retargeting conversion rates.
Email is one of the most consistently high-ROI channels in the entire marketing mix, and one of the most underrated precisely because it’s mature. With 4.59 billion global email users and about 75% of online adults checking email monthly, the audience reach is essentially universal. HubSpot’s 2026 data ranks email as the #1 ROI channel for B2C brands.
What makes email different from every other channel: you own the relationship. Social platforms limit your organic reach to roughly 10% of your followers. Email delivers to the inbox of anyone who subscribed, without algorithmic filtering. That directness makes it the best channel for customer retention, repeat purchase campaigns, and nurturing subscribers toward their first conversion.
In 2026, email performance is increasingly driven by personalization quality. Subscribers receive an average of over 100 emails per day; the ones that get opened are those that feel relevant to that specific person at that specific moment. AI-powered segmentation using behavioral triggers (purchase history, browse behavior, lifecycle stage) is replacing broad audience blasting and lifting conversion rates measurably.
What to track: Open rate vs. industry benchmarks; click-through rate; unsubscribes; revenue per email sent.
Gen AI is the newest and fastest-growing channel in Similarweb’s 2026 Marketing Channels data, tracking referral traffic from AI platforms including ChatGPT, Gemini, Perplexity, DeepSeek, and others.
The numbers tell a story that demands attention. AI platform visits grew 28.6% in 2025. AI-referred sessions grew 527% in the five months between January and May 2025 alone. And when AI does send traffic to a website, the quality is exceptional: AI-referred visitors convert at 4.4x the rate of organic search visitors, spend 68% more time on site, and generate more page views per session
The catch: AI referral traffic currently accounts for about 1% of all website traffic, and AI platforms are retaining attention rather than distributing it. Winning a citation in an AI answer is both harder and more valuable than it was 18 months ago. The brands building AI visibility now are compounding an advantage that will be very difficult to close by 2027.
What drives AI citation? Similarweb’s 2026 Generative AI Brand Visibility Report shows that for brands like Ulta Beauty (whose AI visibility index tripled between April 2025 and January 2026), the winning formula is a combination of domain authority, referral breadth, and consistent content coverage of the topics that matter to their audience.
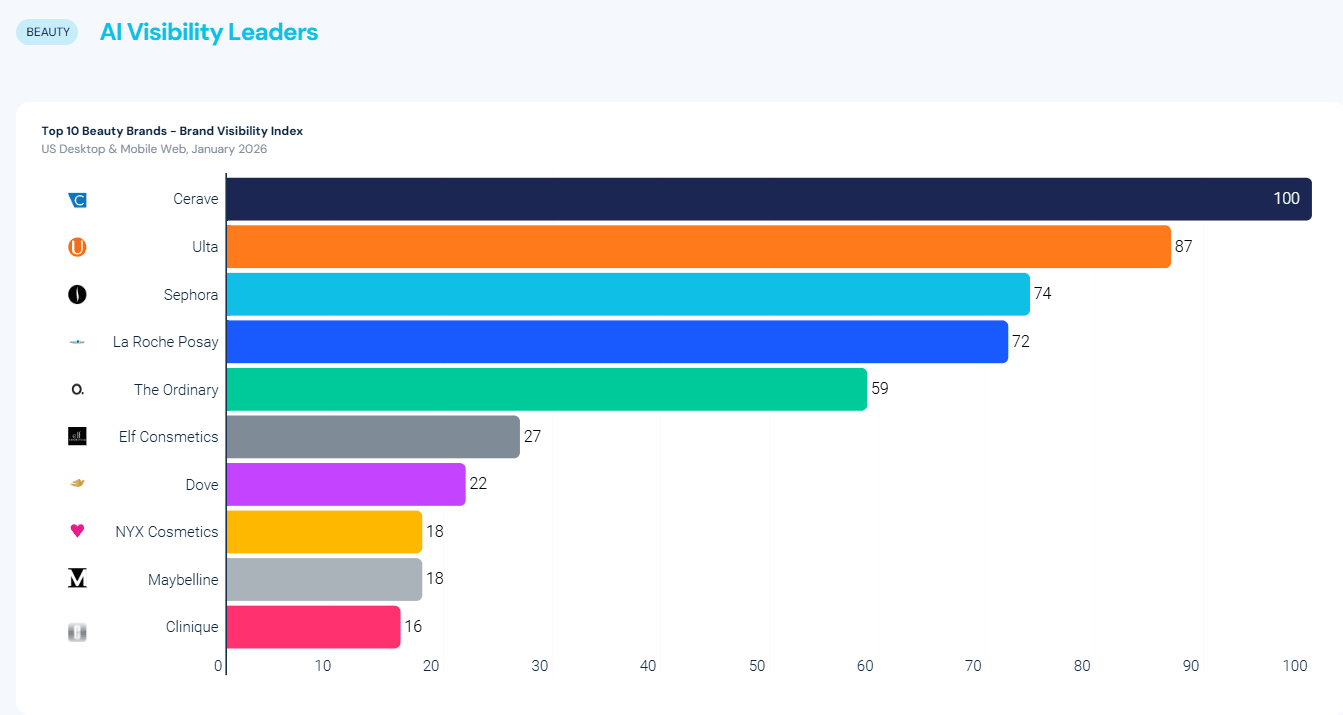
Understanding and growing your AI brand visibility is now a measurable part of channel strategy. You can track which AI platforms are sending traffic to your competitors through Similarweb’s AI Traffic Tracker.
Measurement just got easier on the analytics side, too. In May 2026, Google Analytics added “AI Assistant” as a default channel group, automatically tagging traffic from recognized AI referrers like ChatGPT, Gemini, and Claude with an “ai-assistant” medium without any manual setup required. Previously, all of this traffic landed in the Referral bucket or as Direct when referrer headers were stripped. GA4 property owners no longer need custom regex patterns to separate it out. One gap remains: AI traffic that arrives without a referrer header (common through mobile apps and in-app browsers) still lands in Direct.
What to track: Gen AI traffic share vs. competitors; which AI platforms send the most traffic in your category; AI brand mention share; AI visibility growth rate over time.
To make the framework above concrete, here’s what Similarweb’s Marketing Channels data looks like applied to a real brand. Nike.com is a useful reference because it operates across all 10 channels at scale, which means every column in the data tells you something.
Where does Nike’s traffic actually come from?
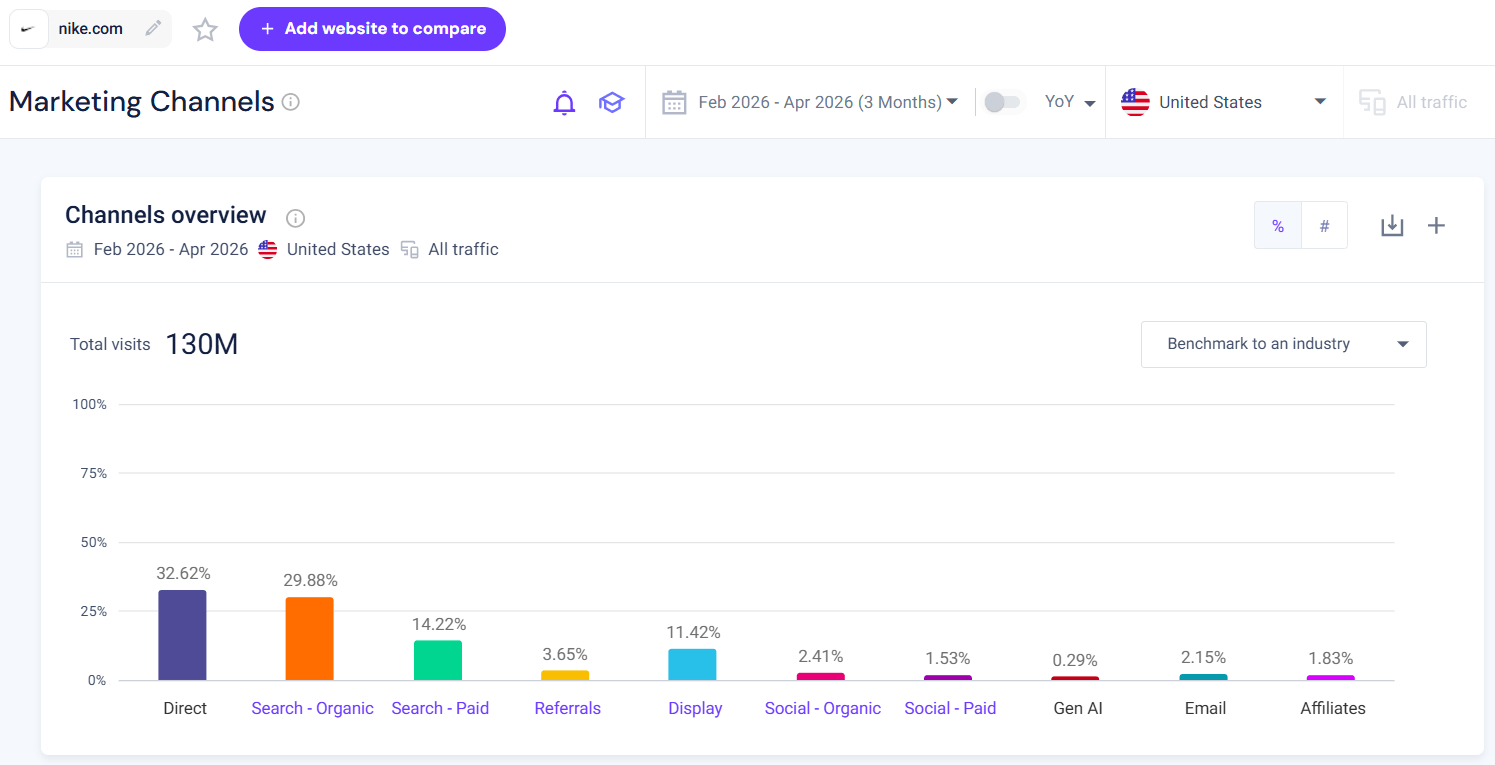
Nike drew 130 million US visits in the three months ending April 2026. Direct traffic led at 32.62%, reflecting a brand strong enough that nearly one in three visitors arrives without any paid prompt. Organic search was close behind at 29.88%, and paid search added another 14.22%. Together, those three channels account for over three-quarters of Nike’s traffic. Display, at 11.42%, is unusually high for a consumer brand and worth noting: Nike is actively using display retargeting to close purchase intent gaps. Social organic (2.41%) and social paid (1.53%) are modest, which makes sense for a brand that doesn’t need social to drive discovery. Gen AI sits at 0.29%, small but measurable and growing.
How has that mix changed in a year?
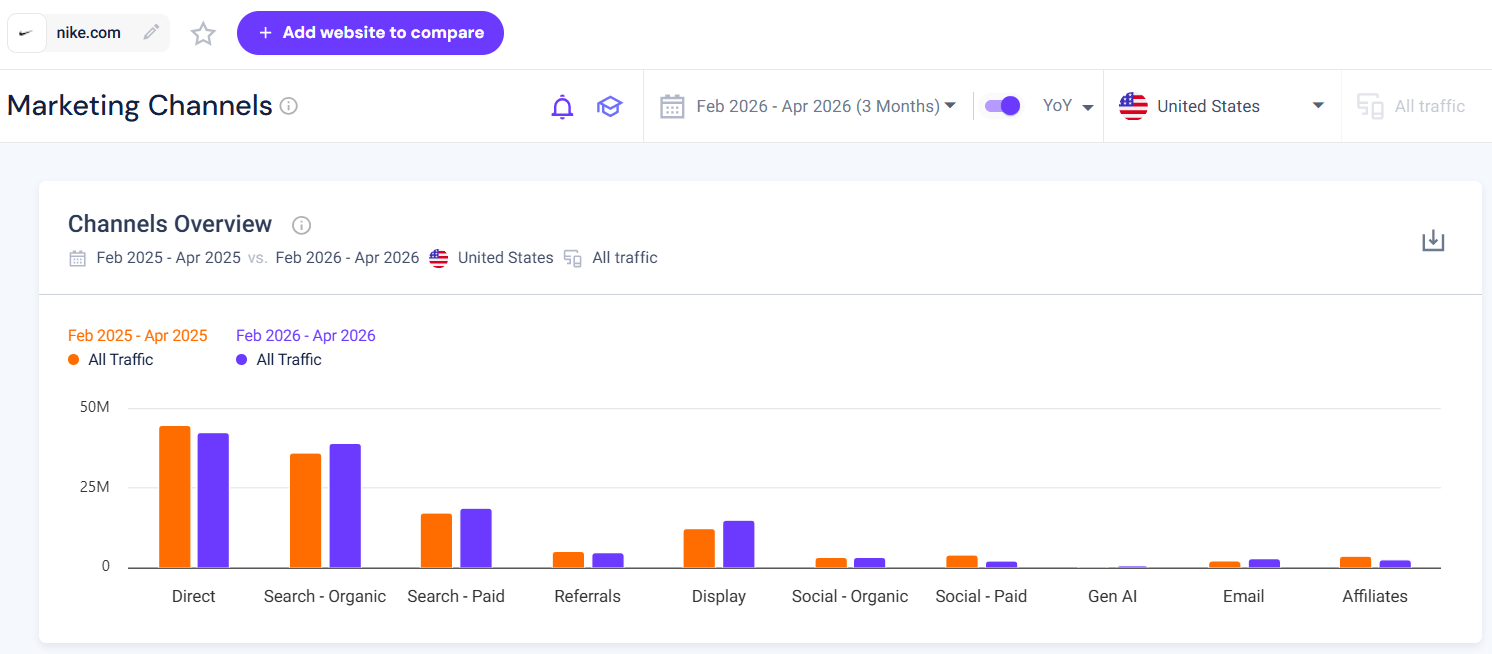
Flipping on the YoY toggle immediately shows where momentum is shifting. Direct traffic is down slightly in absolute terms. Organic search has grown, crossing past Direct in raw visit volume for the first time in this window. Paid search held steady. Display grew. The channel that stands out on the right side: email has grown from near-zero visibility to a visible bar, and Gen AI is a new column that didn’t exist in the prior year’s data. Affiliates, meanwhile, have shrunk notably. One year of data in this view already shows you which channels Nike is investing in and which it’s pulling back from.
How does Nike’s channel mix compare to its competitors?
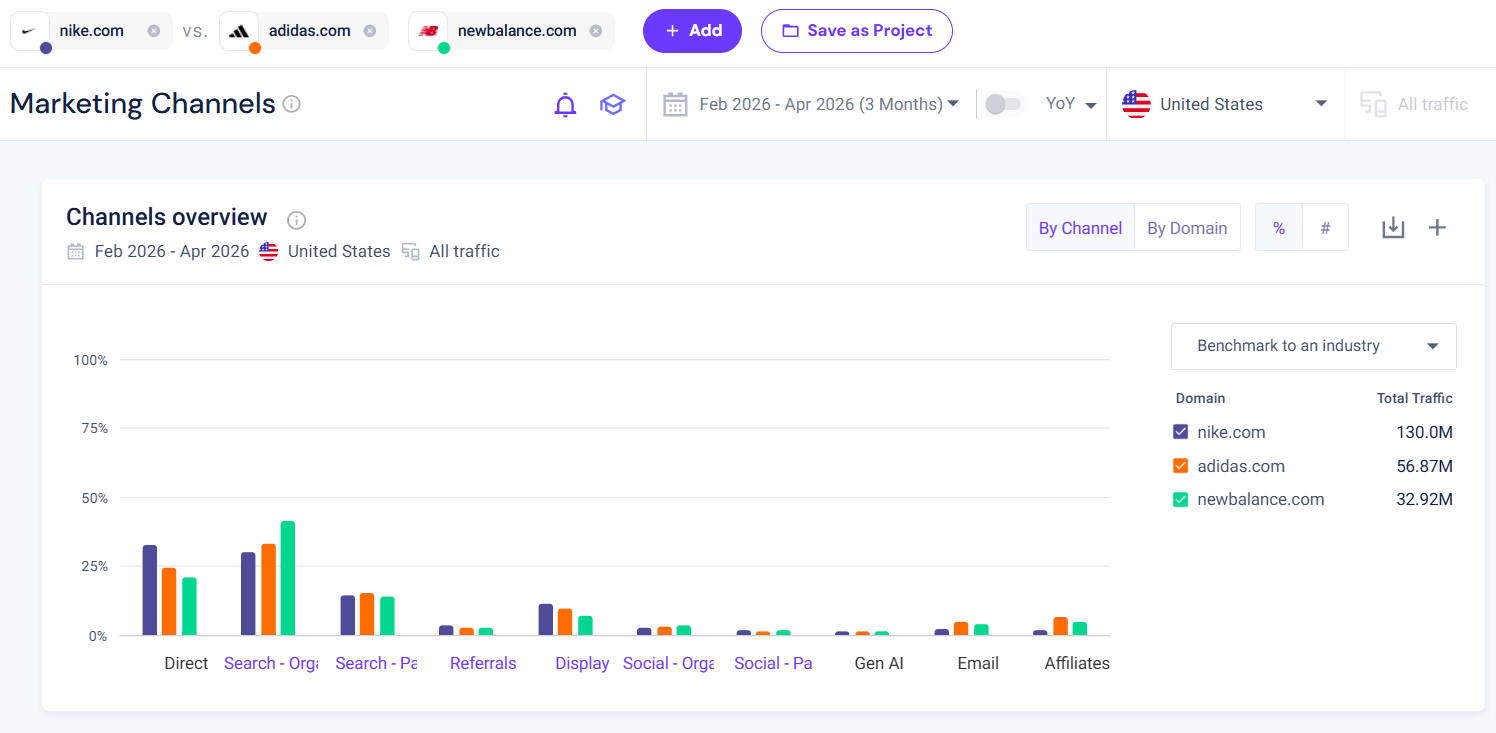
Nike at 130M visits dwarfs Adidas (56.87M) and New Balance (32.92M), but the channel share comparison reveals where each brand’s traffic strategy differs. New Balance has the largest organic search bar of the three, suggesting a heavier SEO investment relative to its overall size. Adidas and Nike are more balanced across direct and organic. Nike’s display share is visibly higher than both competitors, consistent with its retargeting-heavy approach. None of the three shows meaningful social paid traffic, which tells you that paid social is not a primary acquisition channel for footwear at this scale.
Which channels are each brand investing in, and which are they pulling back from?
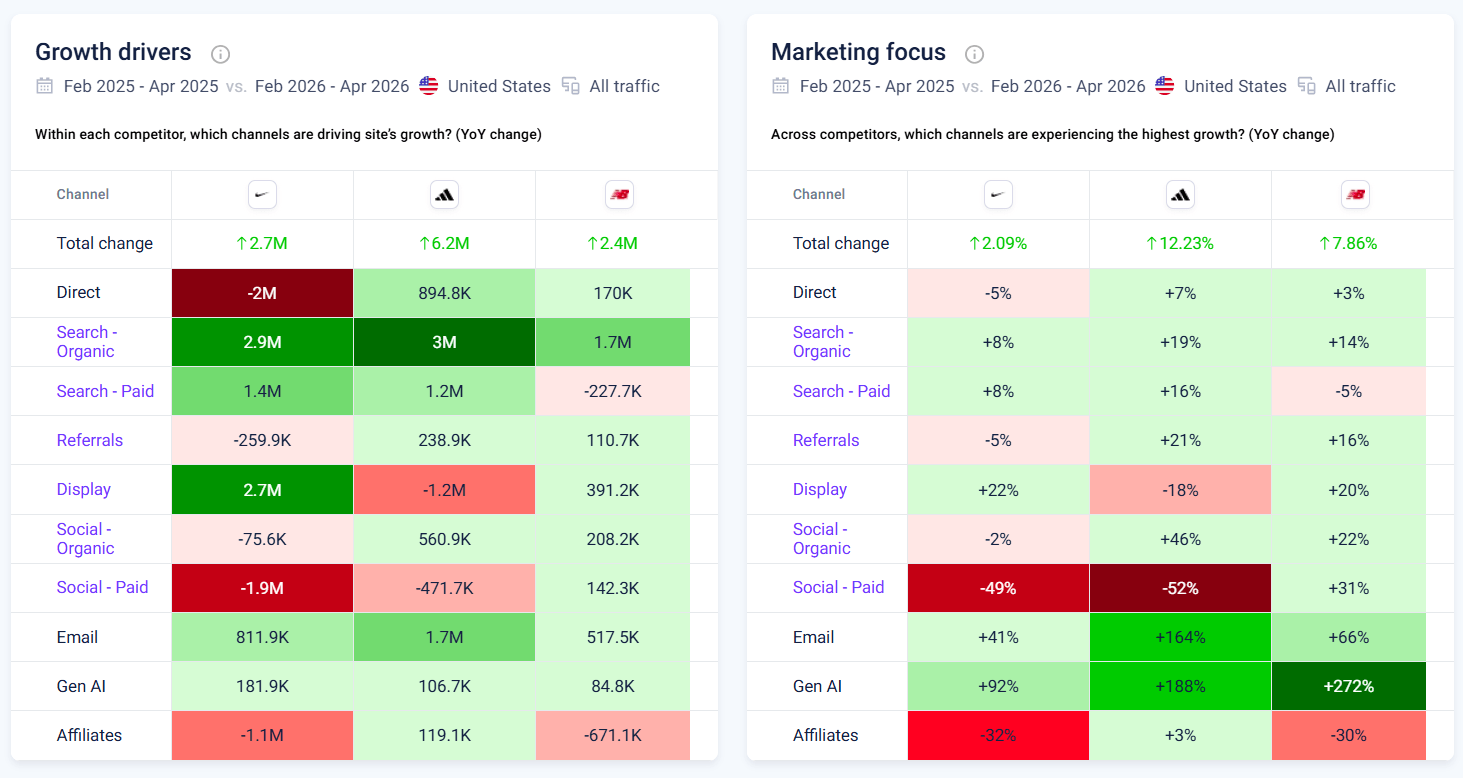
This is where the data gets diagnostic. The Growth Drivers chart (left) shows absolute visit changes. Nike grew 2.7M total visits YoY, but the composition is telling: organic search added 2.9M and display added 2.7M, while direct lost 2M and social paid lost 1.9M. Nike is trading brand spend (social paid, direct) for performance channels (search, display).
The Marketing Focus chart (right) shows percentage change. The two numbers that stand out across all three brands: Gen AI is up 92% for Nike, 188% for Adidas, and 272% for New Balance. Every brand in this category is seeing triple-digit Gen AI channel growth, but New Balance is growing it fastest from its base. The other universal signal: social paid is down 49% for Nike and 52% for Adidas. Both brands pulled significant budget from paid social. New Balance went the other direction at +31%, suggesting it’s using paid social as a growth lever that the larger brands have stepped back from.
How much traffic is Nike getting from AI platforms, and from which ones?
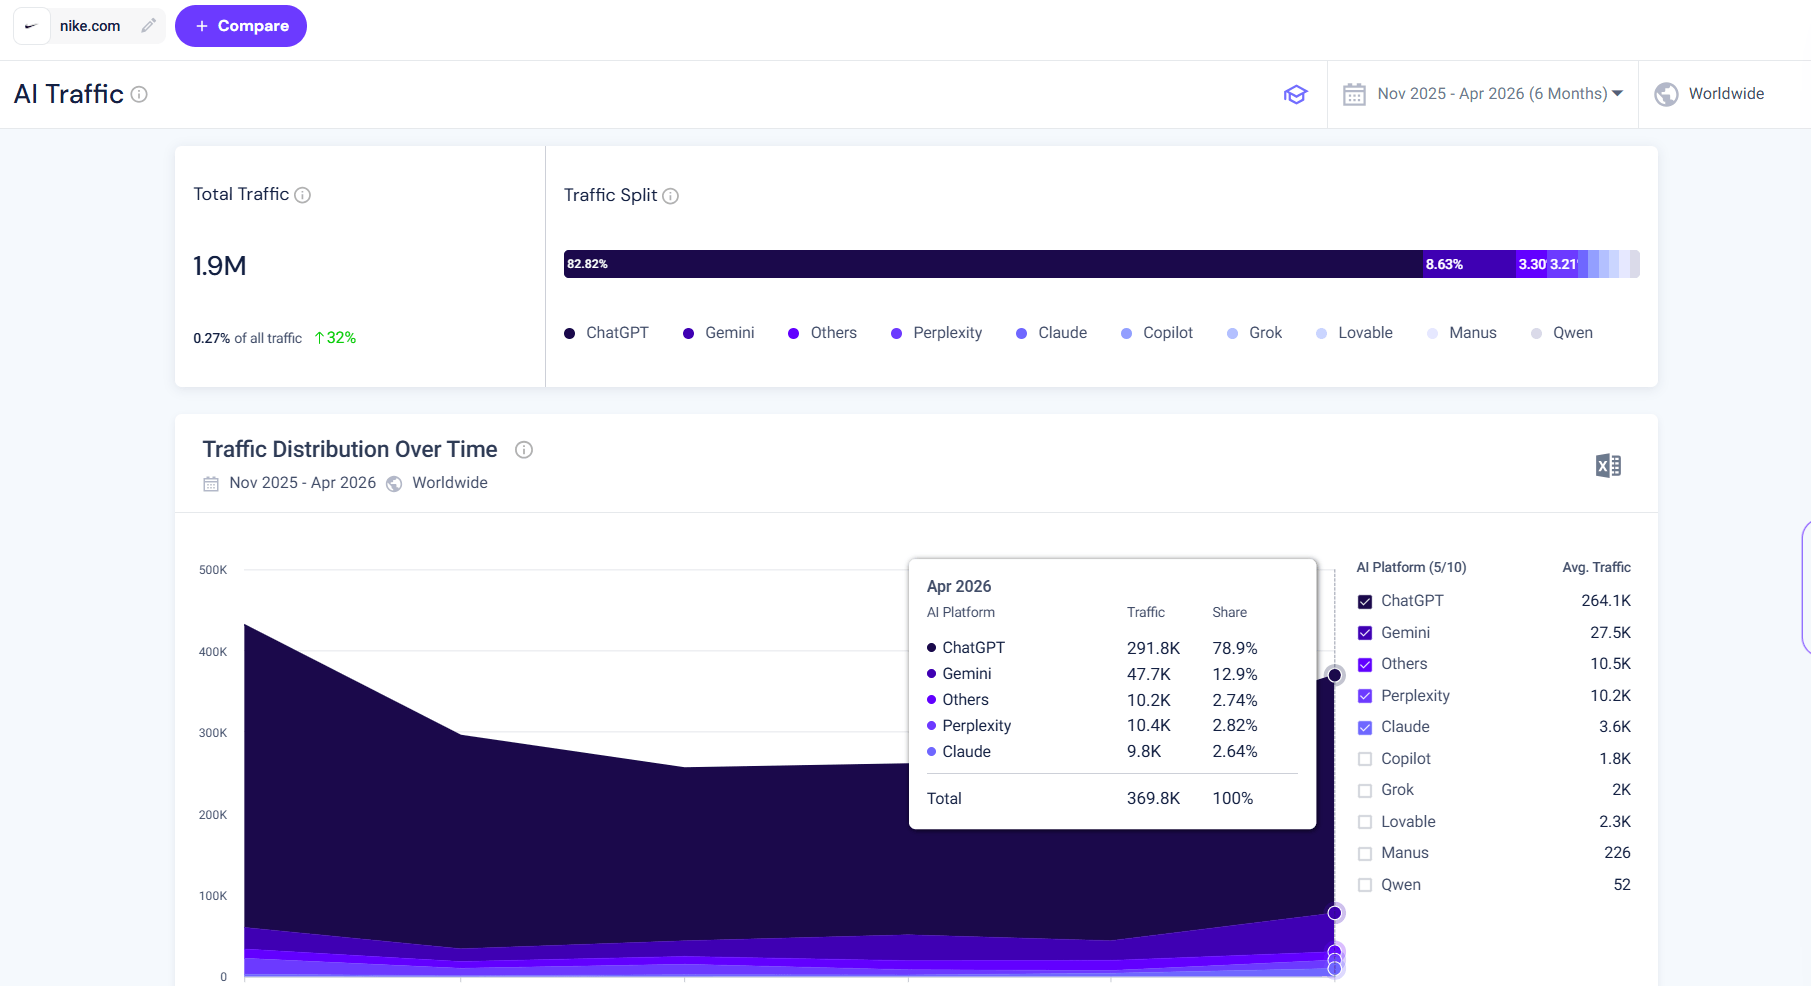
This data comes from the Similarweb AI Traffic Tracker. Over six months, Nike received 1.9M total AI-referred visits worldwide, accounting for 0.27% of all traffic, up 32% over the period. ChatGPT dominates at 82.82% of Nike’s AI traffic. Gemini is second at 8.63%, with Perplexity and Claude each contributing around 3%. In April 2026 specifically, ChatGPT sent 291.8K visits (78.9%), and Gemini sent 47.7K (12.9%). The trend line shows AI traffic peaked in November 2025 and declined through the period before stabilizing, a pattern consistent with the broader finding that AI referral volumes have plateaued even as AI platform usage keeps growing.
Who is actually sending referral traffic to Nike?
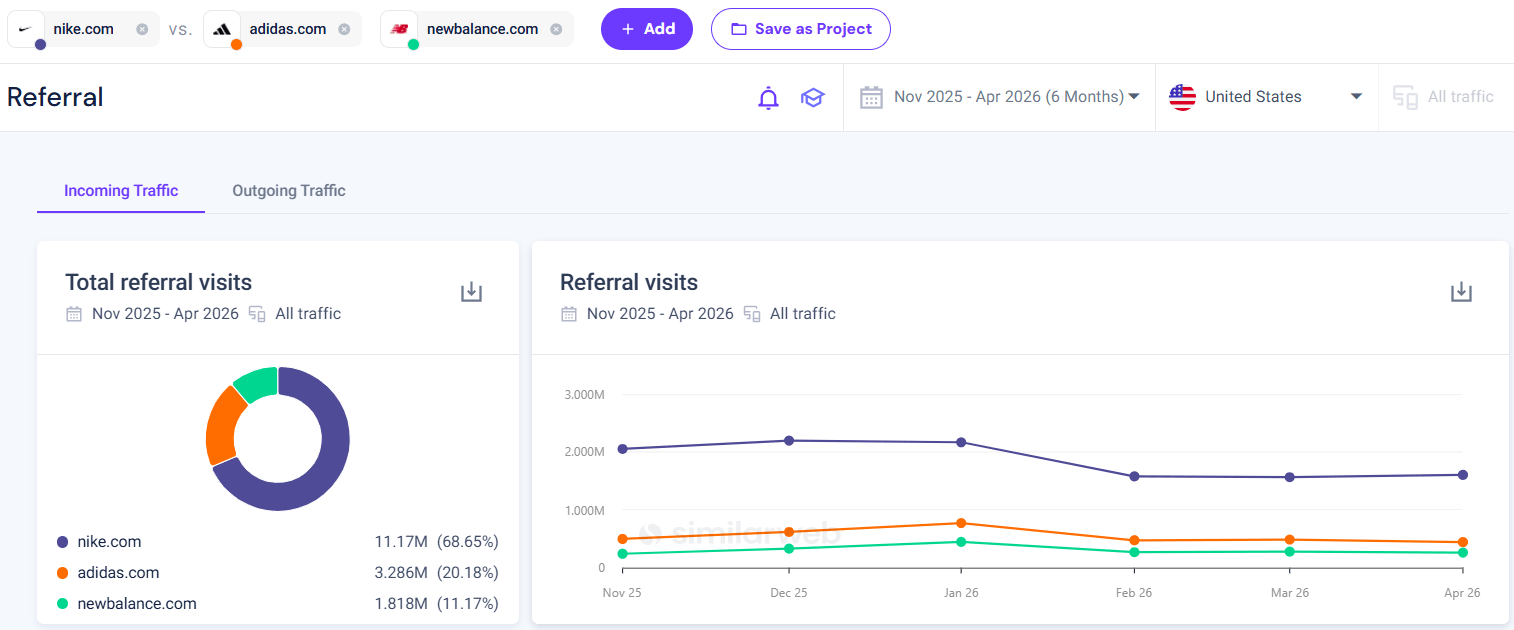
Nike generated 11.17M referral visits over six months, nearly twice Adidas’s 3.29M and three times New Balance’s 1.82M. The time series shows Nike’s referral volume is slowly declining from a high in January 2026, while Adidas is holding steady. The top referring domains for Nike reveal how its referral profile is built:
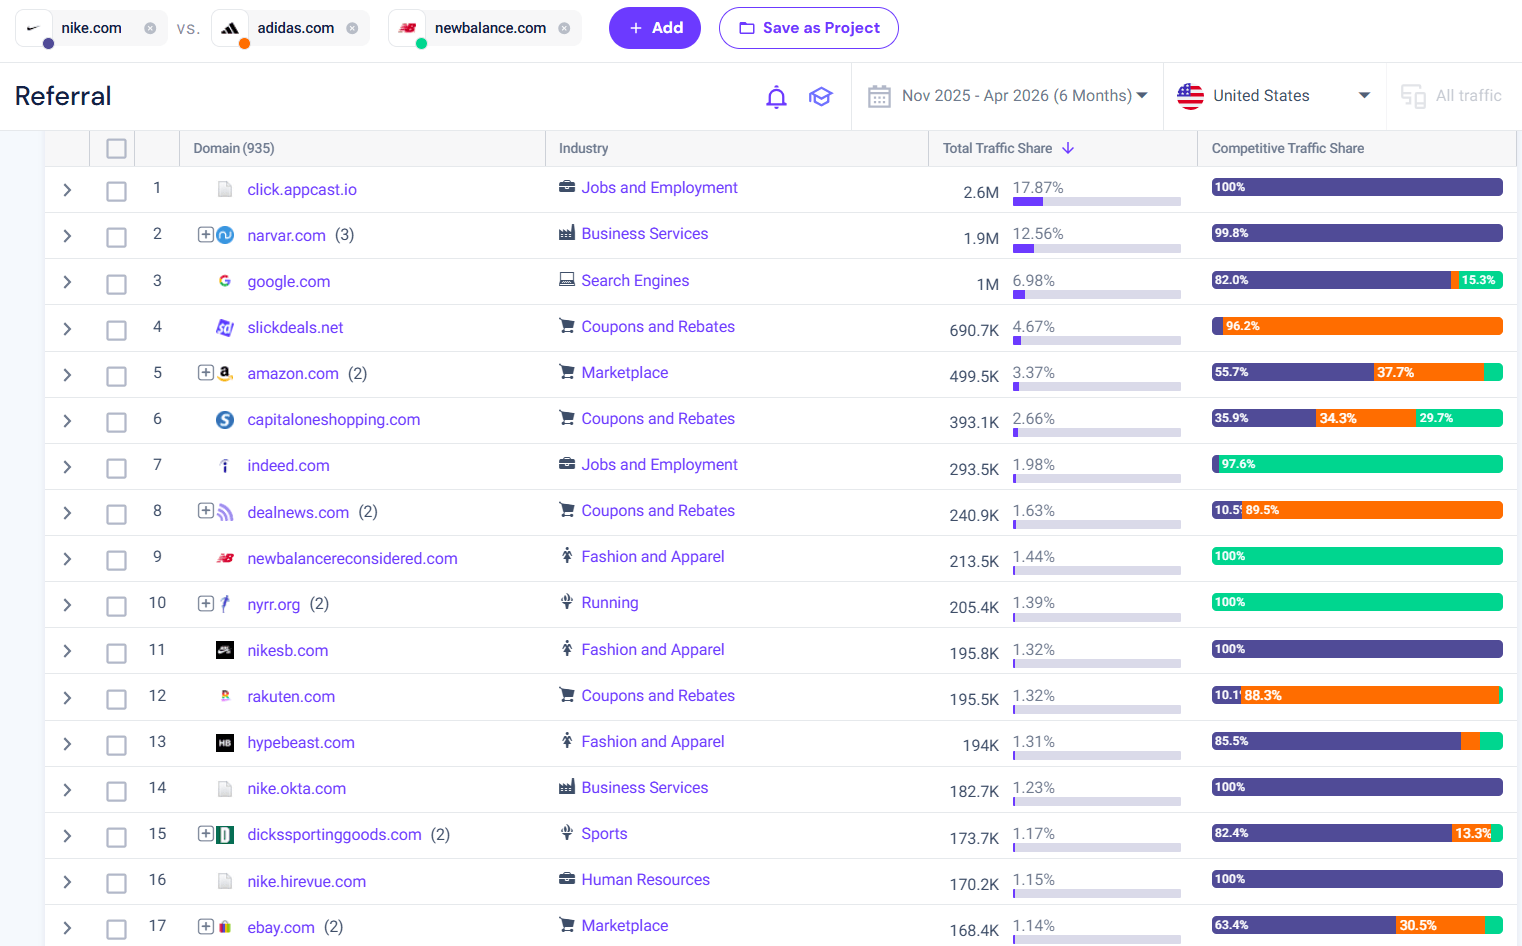
click.appcast.io (#1 at 2.6M, Jobs and Employment) and indeed.com (#7, 293.5K) are recruitment-related, meaning a large share of Nike’s referral traffic comes from job seekers, not shoppers. Narvar.com (#2, 1.9M) is a post-purchase tracking platform, meaning those visits are existing customers checking order status. Slickdeals, CapitalOneShopping, and Rakuten are coupon and cashback affiliates. Google.com at #3 (1M) represents navigational clicks from Google properties outside the organic search channel.
The pattern here is important: Nike’s referral traffic is not primarily driven by editorial coverage or brand partnerships. It’s driven by HR platforms, order tracking tools, and coupon sites. A competitor looking to build referral traffic in this category would need to invest in editorial relationships, running community sites (nyrr.org at #10 confirms the running community is a credible referral source), and review platforms to build the kind of referral breadth that AI platforms reward.
Where is Nike losing organic clicks to Adidas?
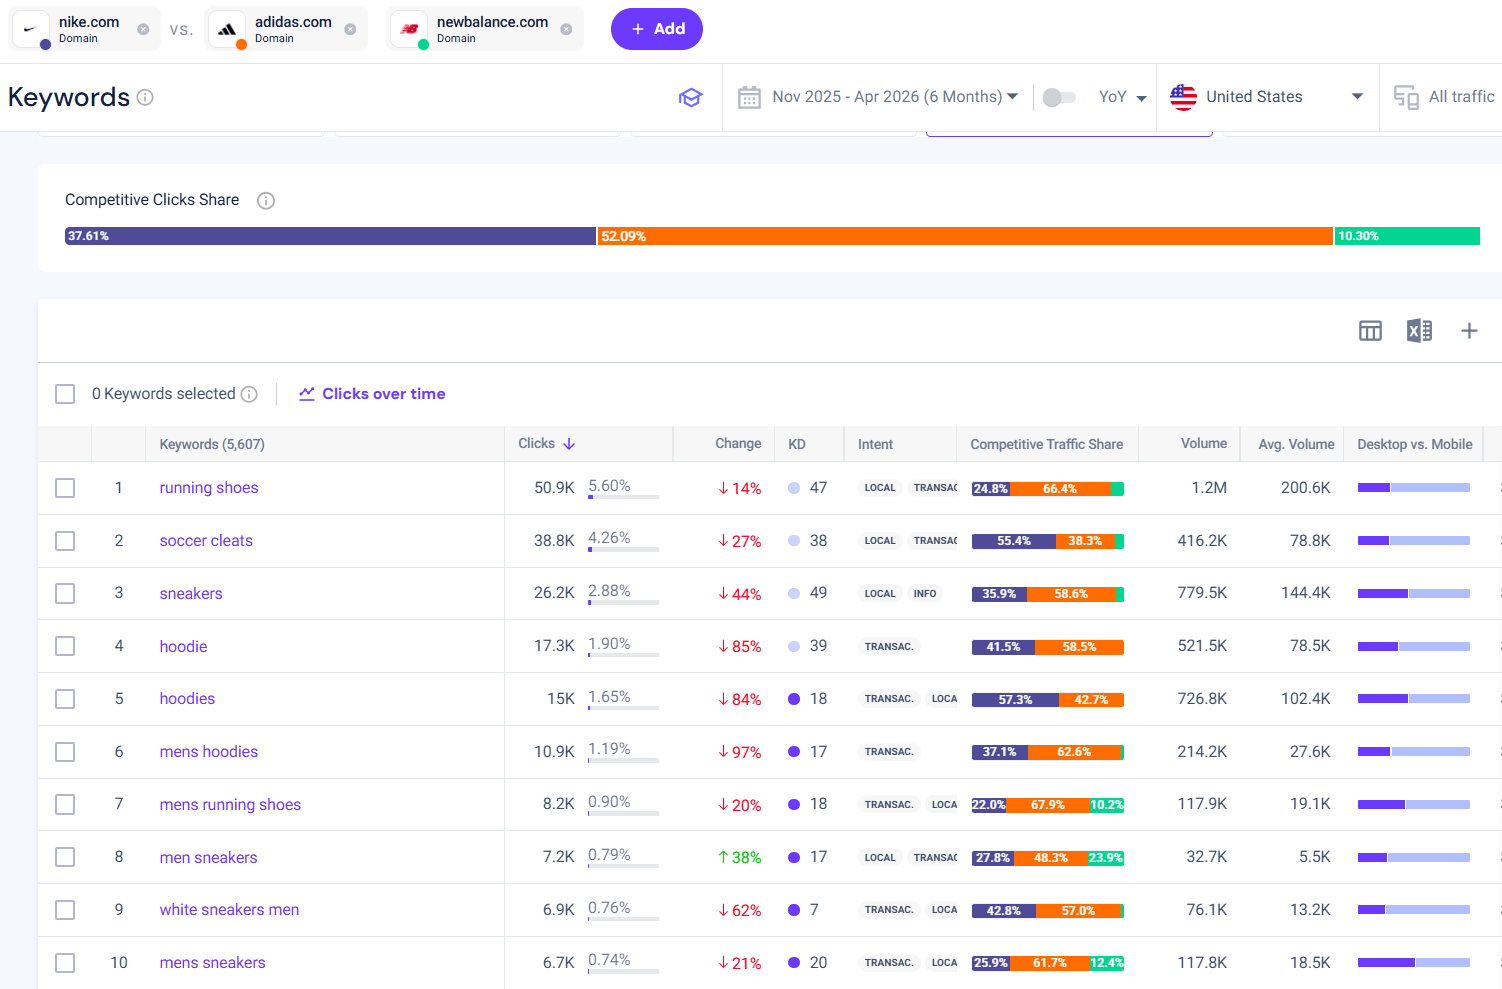
The Competitive Clicks Share bar shows Nike capturing 37.61% of clicks, Adidas 52.09%, and New Balance 10.30% across 5,607 shared keywords. The keyword-by-keyword breakdown shows where that gap comes from: on “running shoes” (1.2M monthly volume), Adidas captures 66.4% of clicks to Nike’s 24.8%. On “hoodie” and “hoodies”, both with 500K+ combined volume, Nike’s click share drops sharply while Adidas dominates. “Men sneakers” is the one bright spot where Nike is gaining ground (+38% change). The output is a concrete action list: which terms to contest, which to concede, and which landing pages need work.
How much are the three brands spending on paid search, and who is getting more for their money?
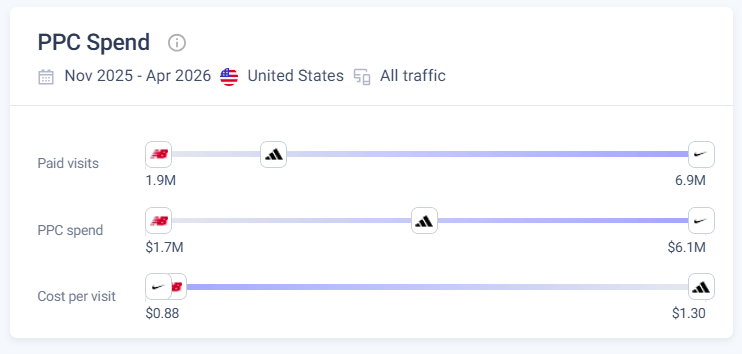
Nike leads with 6.9M paid visits and an estimated $6.1M in PPC spend over six months, while New Balance spent an estimated $1.7M for 1.9M paid visits. The cost-per-visit comparison is particularly useful, Nike pays $0.88 per paid visit vs. Adidas at $1.30, meaning Nike’s keyword mix and quality scores are more efficient. Knowing a competitor pays 48% more per click for similar traffic is a starting point for understanding where your own bidding strategy has room.
What display ads are competitors running, and where are they spending their display budget?
The Display Ads view lets you browse the actual creatives each competitor is running, with format dimensions and how long each ad has been live.
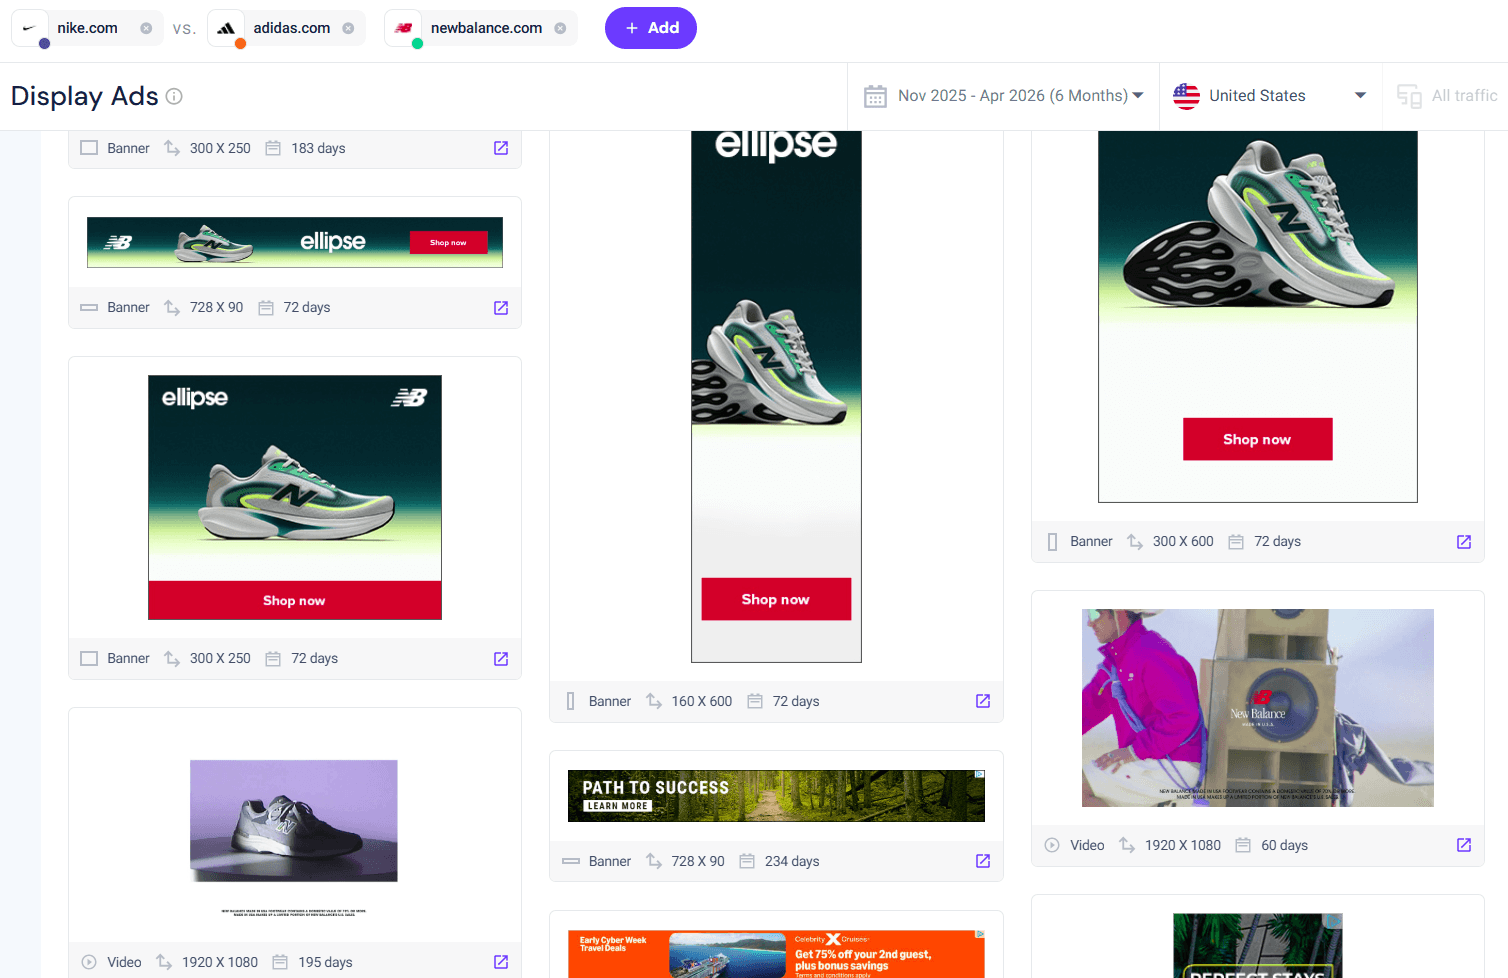
New Balance’s “Ellipse” product line is running across multiple banner formats, 300×250, 728×90, 160×600, some active for as long as 183 days, which signals a sustained campaign rather than a short burst. Seeing what a competitor has been running for six months tells you what’s likely working for them.
The Display Publishers view, sorted by competitive spend share across 802 publishers, shows where each brand is concentrating its display budget.
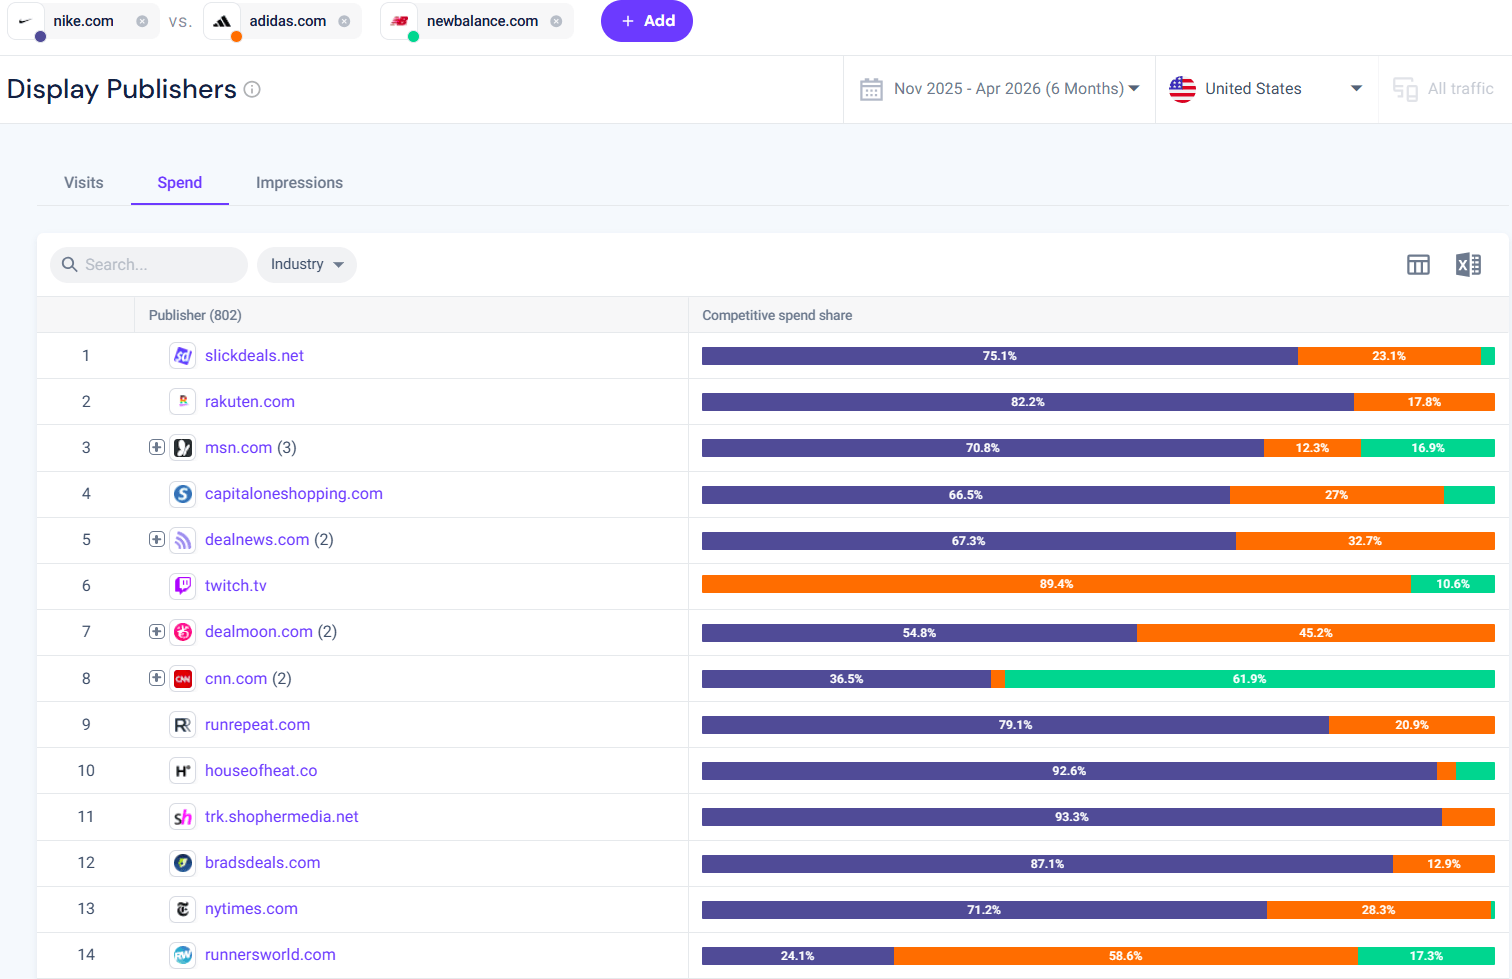
Nike takes the majority of spend on coupon and deal sites (Slickdeals 75.1%, Rakuten 82.2%, CapitalOneShopping 66.5%) and niche footwear publications (houseofheat.co 92.6%, runrepeat.com 79.1%). Adidas dominates on Twitch.tv (89.4% spend share), a signal of investment in gaming and live-streaming audiences that Nike is largely absent from. CNN gives New Balance its strongest share at 61.9%, suggesting a mainstream media presence strategy. RunnersWorld.com is split three ways (Nike 24.1%, Adidas 58.6%, New Balance 17.3%), which is the one specialist publisher where budget competition is direct and measurable.
One of the clearest findings from HubSpot’s 2026 State of Marketing data is that B2B and B2C channel priorities diverge significantly.
Top-performing channels by ROI, B2B: Website/blog/SEO → Email marketing → Paid social media → Organic social → Events and webinars
Top-performing channels by ROI, B2C: Email marketing → Paid social media → Social shopping tools → Content marketing → Website/blog/SEO
For B2B marketers, the long and complex sales cycle means that brand-building channels (content, SEO, events) lay the groundwork for deals that close weeks or months later. For B2C, where the purchase decision often happens in minutes, the channels that win are those with the most direct line to immediate action: email sequences, shoppable social posts, and influencer-driven content.
Neither list should be treated as universal. Audience research, competitive analysis, and your own conversion data will always outperform general benchmarks.
The question isn’t which channels exist. It’s which ones your audience actually uses, and where your competitors are winning. Here’s a practical framework.
Step 1: Benchmark your current channel distribution – Use Similarweb’s website benchmarking tool to see how your traffic mix compares to your top three to five competitors. If your organic share is 45% but the category average is 30%, you have an SEO advantage to protect. If your direct traffic share is below the category average, your brand awareness efforts may need investment.
Step 2: Identify competitor growth drivers – The Growth Drivers heatmap in Similarweb’s Marketing Channels report shows which channels are driving absolute visit growth for each competitor, year over year. If a competitor sees 9 million incremental visits from Display and you see none, they may have found a publisher or network generating exceptional returns. If a competitor’s Gen AI traffic is up 311% (as Adidas’s was in recent Similarweb data), they’re building AI visibility you’re not matching.
Step 3: Map channels to the funnel stage – Every channel does a different job. Organic search and Gen AI primarily drive discovery and consideration. Email and direct traffic drive conversion and retention. Paid search and paid social can work across the funnel, but perform differently at each stage. Building a mix means ensuring coverage at every stage, not just the one you’re most comfortable with.
Step 4: Allocate budget by evidence, not intuition – HubSpot’s data shows 45% of marketers use 10-20% of their budget to test new channels. That protected experimentation budget is what lets successful marketing teams spot changes early, before they show up in quarterly results. Our guide on how to allocate your marketing budget walks through a data-driven approach to this.
Step 5: Track weekly with period-over-period comparison – The Marketing Channels report in Similarweb tracks weekly changes across your competitive set, with period-over-period analysis available at monthly, quarterly, or custom intervals. Channel performance tends to erode slowly, then drop fast. Weekly tracking gives you enough warning to act.
The key to marketing in 2026 isn’t picking the right channels. It’s making them work together. Successful brands use five to eight channels simultaneously, but what separates the best from the average is how deliberately those channels reinforce each other.
A consumer might discover a brand through a TikTok, Google it, read a blog post, subscribe to an email list, and purchase two weeks later after getting a personalized offer. The last click was email, but every earlier touchpoint was essential. Measuring only last-click ROI systematically undervalues the awareness channels that started the journey.
Build your channel mix around the full customer journey, not just the channels closest to conversion. Then use competitive intelligence to verify that your mix matches how your audience actually moves, because your competitors’ traffic data tells you whether your own analytics can or not.
Every analysis in this article, channel benchmarking, YoY comparisons, keyword click gaps, PPC spend estimates, display publisher spend, Gen AI traffic breakdowns, came from Similarweb’s Web Intelligence platform. The Nike example isn’t a case study we commissioned; it’s what any Similarweb user can pull in a few minutes by entering a domain and adding competitors.
If you manage a brand, run a marketing team, or advise clients on channel strategy, this is the data that tells you where to focus and what your competitors are doing that you’re not. Start a free trial of
Similarweb’s Web Intelligence platform and run the same analysis on your own competitive set.
How many marketing channels should a business use?
There’s no universal answer, but HubSpot’s 2026 data shows that 75% of marketers use more than five distinct channels. The more useful question is whether your channel coverage matches your customer journey. If a segment of your audience discovers brands through AI assistants and you have no Gen AI presence, you’re invisible to them, regardless of how many other channels you run. Start by mapping where your audience actually goes, your competitors’ traffic data tells you this more reliably than surveys.
What’s the difference between a marketing channel and a marketing platform?
A channel is a type of pathway, such as organic search, paid social, email, and so on. A platform is the specific service within that channel. Google is a platform within the organic search channel, and Instagram is a platform within the social organic and social paid channels. The distinction matters because you can shift budget between platforms within a channel (say, from Google Ads to Meta) without changing your channel mix. Changing your channel mix means adding or removing a category entirely, which is a bigger strategic decision.
How do marketing channel attribution models affect budget decisions?
Most analytics tools default to last-click attribution, which gives 100% of the conversion credit to whichever channel a user visited last. This systematically undervalues awareness channels like organic social, display, and Gen AI, all of which may have influenced the decision earlier in the journey. If you’re allocating budget based purely on last-click data, you’ll tend to cut exactly the channels that are filling the top of your funnel. Multi-touch or data-driven attribution models give a more accurate picture, though they require more data and setup to run reliably.
Can small businesses compete in channels dominated by large brands?
Yes, but the strategy has to be different. Large brands dominate high-volume, high-competition keywords and pay premium rates for broad display placements. Small brands can compete by targeting long-tail keywords where competition is lower, building referral profiles through niche communities and specialist publishers, and investing in email as a retention channel that doesn’t require ongoing ad spend. Gen AI is also a channel where brand size matters less than content quality and topical authority, a smaller brand with genuinely useful, well-structured content can earn AI citations ahead of a larger brand with thinner coverage.
How often should you review your channel mix?
At a minimum, quarterly, enough time to see meaningful trends without reacting to short-term noise. That said, weekly monitoring of period-over-period changes lets you catch significant moves early, such as a competitor suddenly scaling a channel you’d deprioritized. The marketing focus heatmap in Similarweb’s Marketing Channels report is built for exactly this: a single view of which channels are accelerating or declining across your competitive set, updated weekly.

by Roie Gortler
Senior Product Marketing Manager
With 15+ years in product marketing, strategy, branding, and PR, Roie has driven growth at top agencies and tech firms through product launches and go-to-market strategies.
The Top 100 Most Visited Websites in the USA (August 2026)
Similarweb Named in Forrester's Answer Engine Optimization Technologies Landscape, Q3 2026
Anthropic IPO: What Claude's Web and App Data Show
The ultimate solution to help you build the best digital strategy
