





Similarweb Named in Forrester's Answer Engine Optimization Technologies Landscape, Q3 2026
by Rice Tong6 Min.
Sep 28, 2026

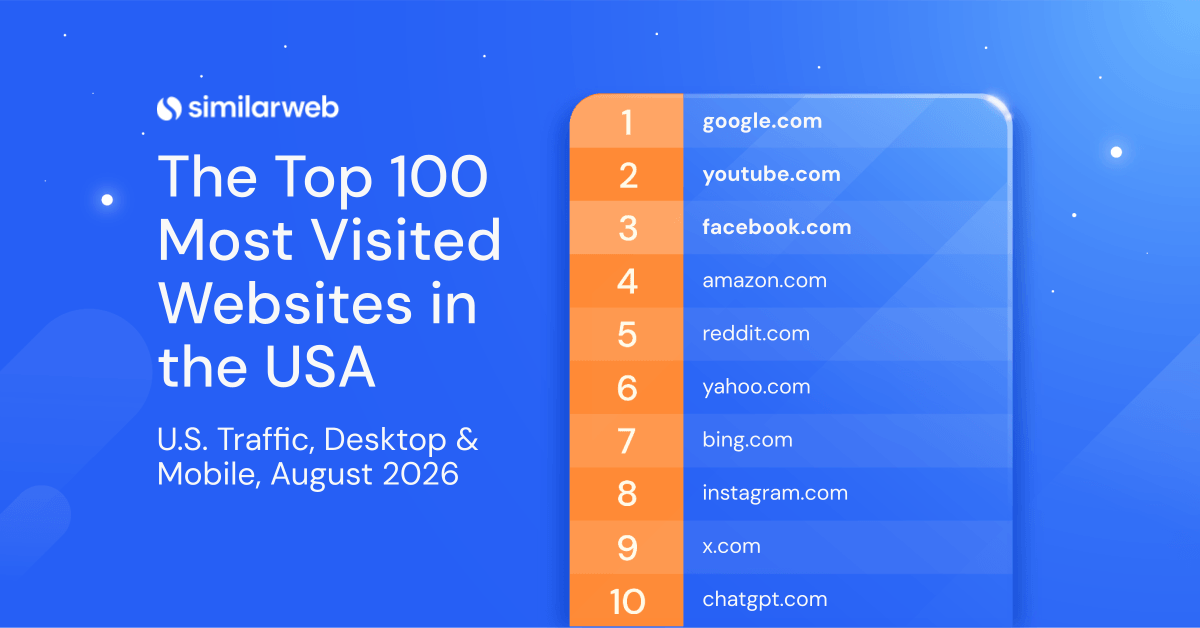
August 2026 pulled Americans in several directions at once. A record-hot July finally broke, millions of students went back to class, and a major gaming platform’s engagement kept cooling for a third straight quarter. Similarweb U.S. web traffic data for the month captures each of these moves, from a pullback in weather searches to a jump in learning platforms and a steep decline in one streaming app’s numbers. This monthly ranking of the most visited websites in the US uses total visits across desktop and mobile web to rank the top 100 sites for August 2026.
Google holds the #1 spot in August 2026 with 16.58 billion visits, though even the world’s biggest search engine did not escape the month untouched, slipping 0.13% from July. Google’s lead over the rest of the list stays enormous no matter what moves beneath it, a reminder that for most Americans, the search bar remains the default doorway to everything else on this list.
The table below ranks all 100 sites by total monthly visits for August 2026, along with each site’s month-over-month change.
| # | Domain | Monthly Visits | MoM traffic change | Yearly Change |
| 1 | google.com | 16.6B | -0.13% | 3.07% |
| 2 | youtube.com | 5.9B | -2.33% | 4.50% |
| 3 | facebook.com | 2.6B | -2.11% | 8.73% |
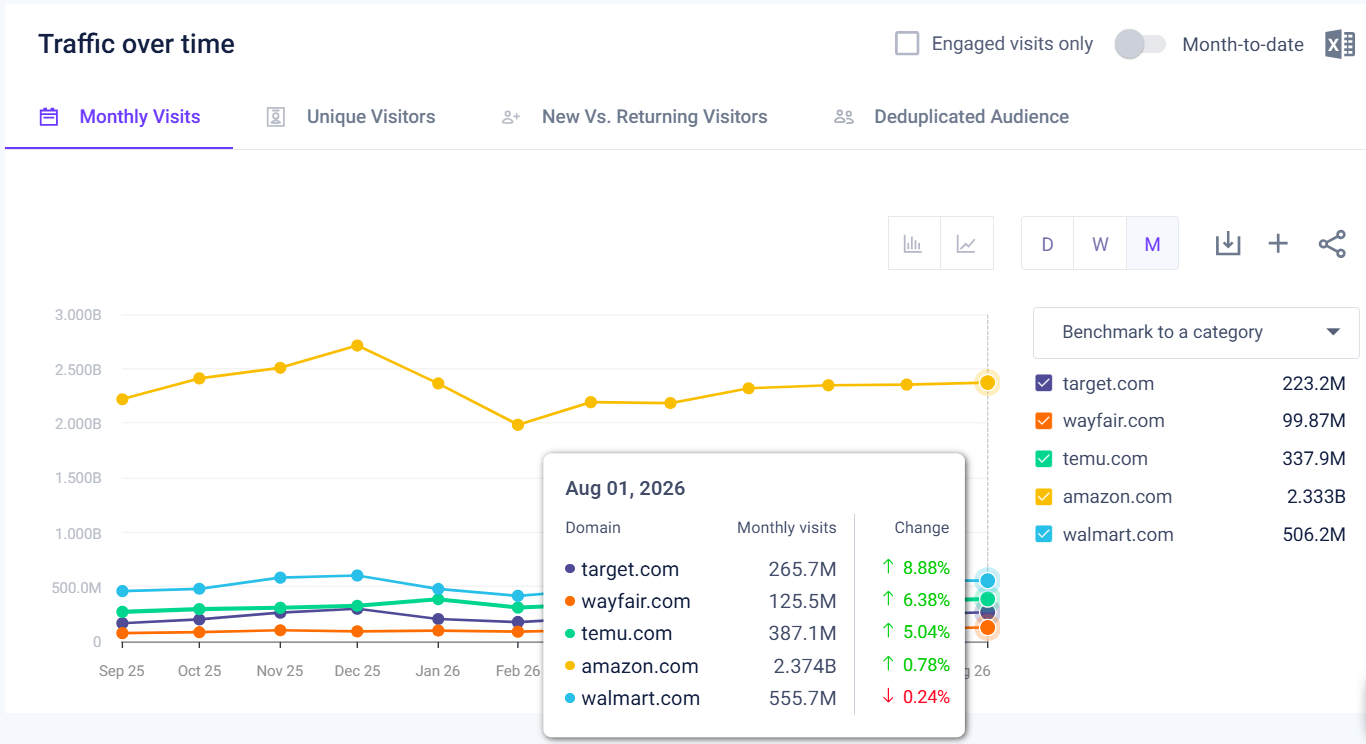
| 4 | amazon.com | 2.4B | 0.78% | 2.81% |
| 5 | reddit.com | 2.0B | -5.07% | 1.20% |
| 6 | yahoo.com | 1.5B | -2.61% | -1.67% |
| 7 | bing.com | 1.5B | -3.26% | -15.26% |
| 8 | instagram.com | 1.2B | -1.18% | 15.22% |
| 9 | x.com | 1.1B | -4.46% | 27.54% |
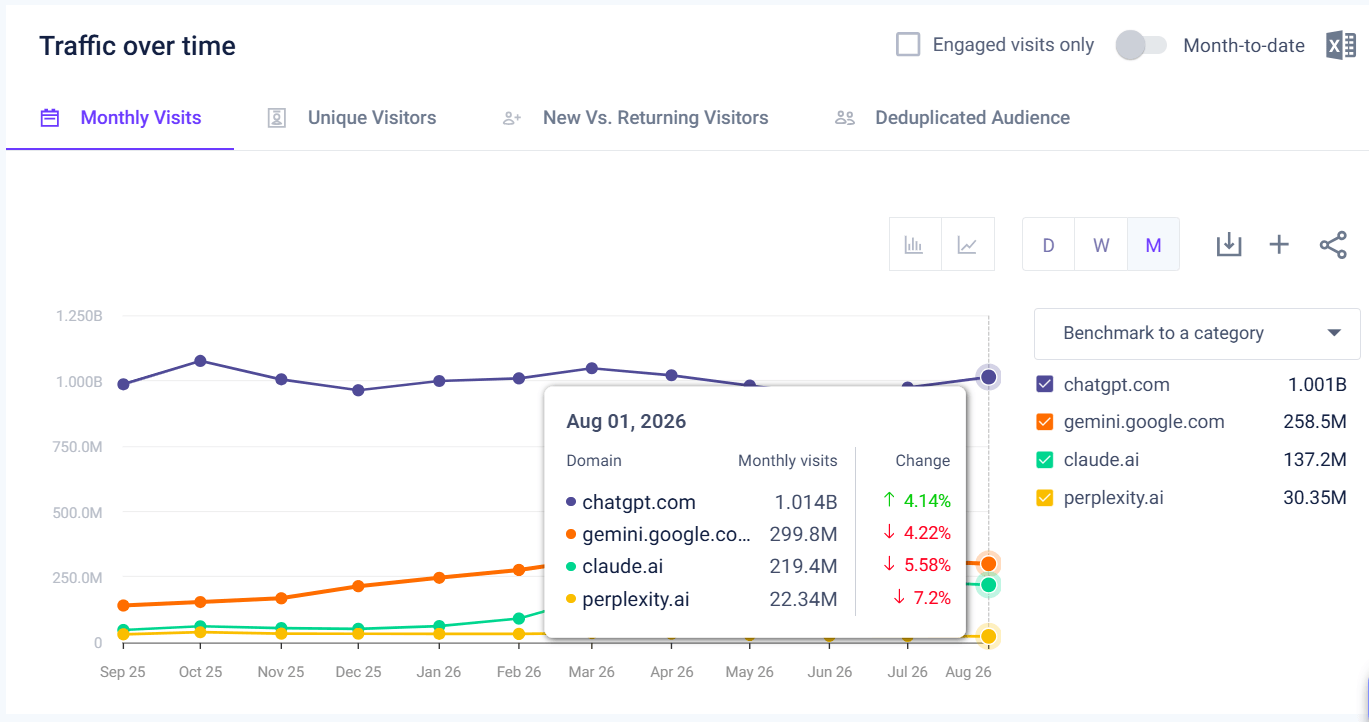
| 10 | chatgpt.com | 1.0B | 4.14% | 30.79% |
| 11 | wikipedia.org | 705.9M | -2.56% | 3.44% |
| 12 | linkedin.com | 598.4M | 2.69% | 6.81% |
| 13 | walmart.com | 555.8M | -0.24% | 11.16% |
| 14 | tiktok.com | 553.2M | -2.09% | 20.66% |
| 15 | ebay.com | 539.5M | -0.64% | 6.89% |
| 16 | cloud.microsoft | 525.0M | 21.17% | 212.01% |
| 17 | espn.com | 425.5M | -1.17% | 4.25% |
| 18 | weather.com | 418.4M | -15.14% | 12.73% |
| 19 | nytimes.com | 393.6M | -3.14% | 3.58% |
| 20 | temu.com | 387.1M | 5.04% | 4.03% |
| 21 | pinterest.com | 359.9M | 6.32% | 41.46% |
| 22 | zillow.com | 350.0M | -4.17% | 8.71% |
| 23 | usps.com | 345.1M | -4.85% | 6.83% |
| 24 | fandom.com | 334.6M | -7.35% | -2.34% |
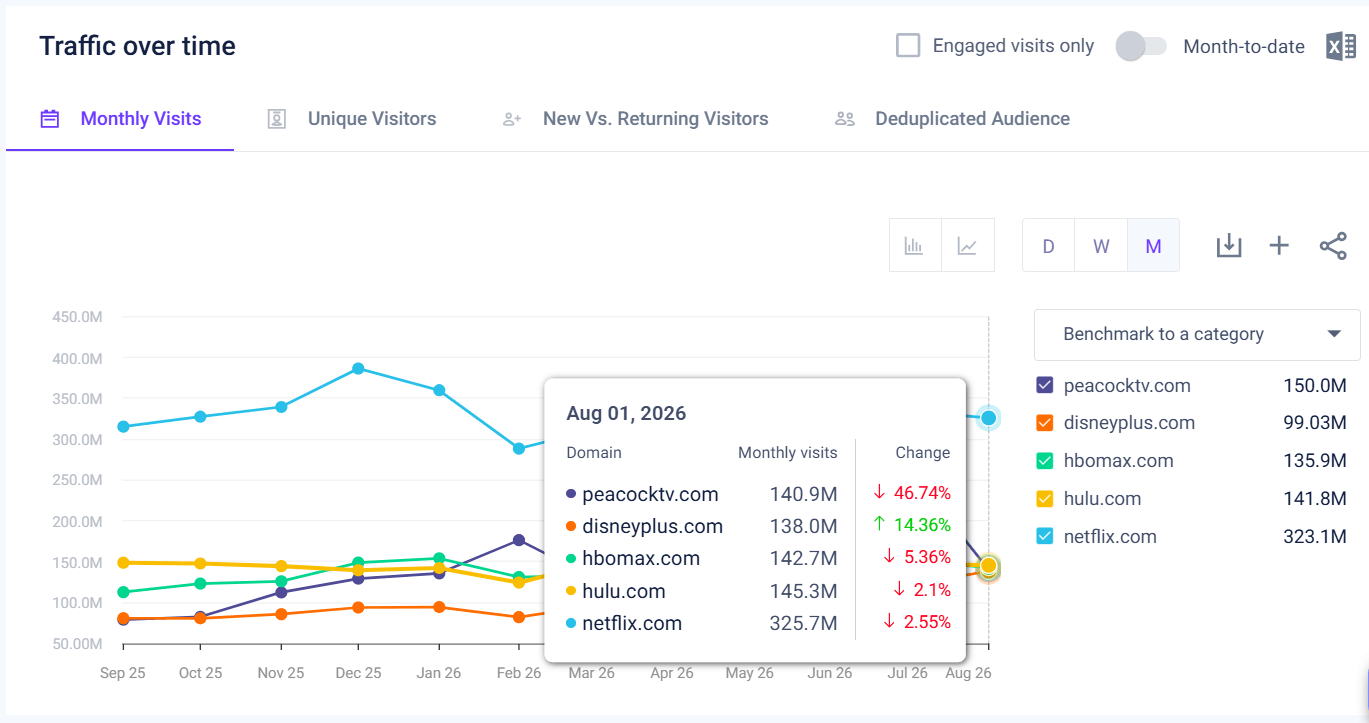
| 25 | netflix.com | 325.8M | -2.55% | 9.52% |
| 26 | duckduckgo.com | 313.6M | -5.22% | 8.24% |
| 27 | gemini.google.com | 299.9M | -4.22% | 103.47% |
| 28 | twitch.tv | 290.1M | 1.09% | 8.98% |
| 29 | live.com | 274.8M | -0.07% | 6.54% |
| 30 | etsy.com | 270.6M | 1.05% | 36.98% |
| 31 | target.com | 265.7M | 8.88% | 48.01% |
| 32 | microsoft.com | 263.2M | 8.04% | 14.70% |
| 33 | shop.app | 228.8M | 5.26% | 98.67% |
| 34 | paypal.com | 222.6M | -0.80% | -2.54% |
| 35 | pornhub.com | 222.1M | -5.63% | -12.94% |
| 36 | instructure.com | 222.1M | 58.11% | 8.02% |
| 37 | claude.ai | 219.5M | -5.58% | 462.72% |
| 38 | xvideos.com | 219.2M | -4.01% | -14.38% |
| 39 | apple.com | 218.8M | 6.35% | 46.33% |
| 40 | homedepot.com | 217.9M | -3.86% | 20.04% |
| 41 | xhamster.com | 212.0M | -5.26% | -4.18% |
| 42 | roblox.com | 208.8M | -12.41% | 7.88% |
| 43 | onlyfans.com | 206.9M | -1.56% | 62.18% |
| 44 | chase.com | 205.4M | -2.54% | 18.15% |
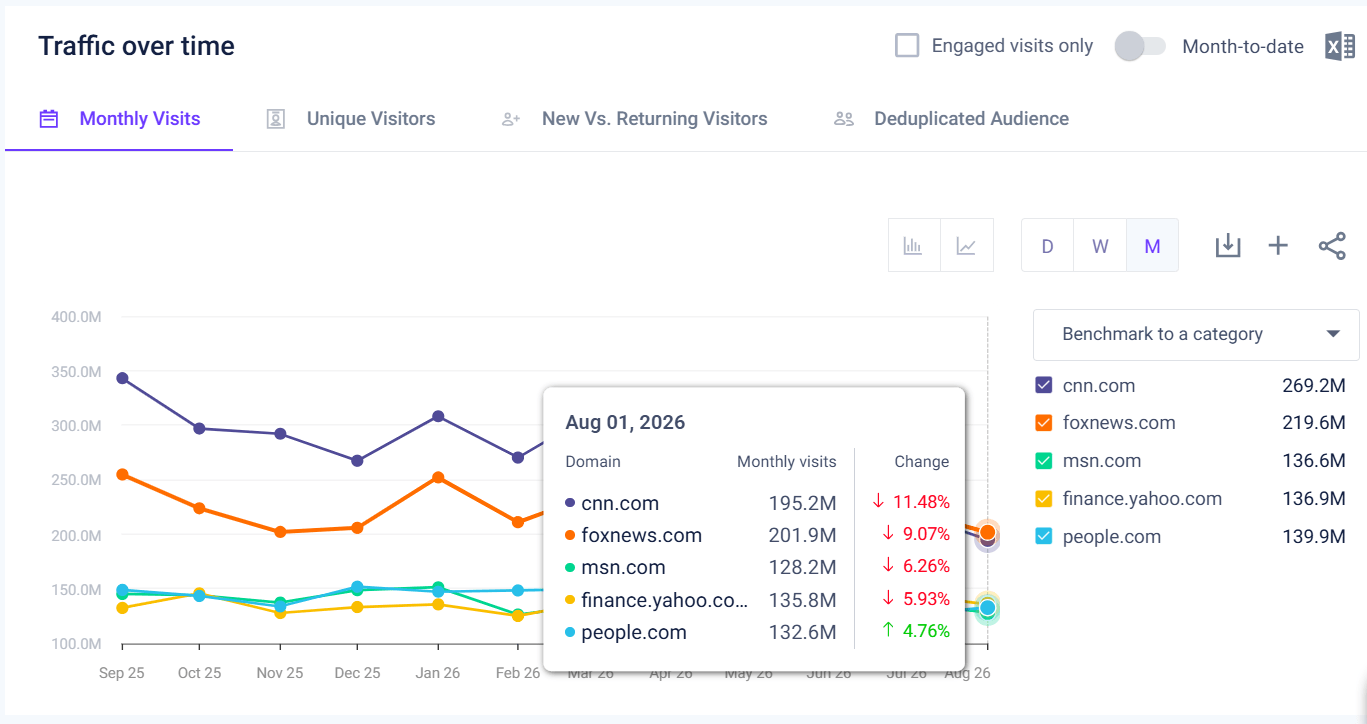
| 45 | foxnews.com | 201.9M | -9.07% | -4.40% |
| 46 | nextdoor.com | 199.8M | -1.13% | 8.46% |
| 47 | discord.com | 198.1M | -4.91% | 19.20% |
| 48 | zoom.us | 196.7M | -0.96% | 8.80% |
| 49 | cnn.com | 195.2M | -11.48% | -23.17% |
| 50 | imdb.com | 186.9M | -0.34% | 15.87% |
| 51 | indeed.com | 178.2M | -0.66% | 1.54% |
| 52 | xnxx.com | 176.0M | -6.83% | -24.24% |
| 53 | fedex.com | 175.7M | -6.61% | 23.18% |
| 54 | duosecurity.com | 174.0M | 34.33% | 4.15% |
| 55 | chaturbate.com | 173.9M | -6.11% | -9.06% |
| 56 | brave.com | 167.6M | -1.18% | 33.96% |
| 57 | aol.com | 166.8M | -9.91% | -32.61% |
| 58 | office.com | 166.7M | 2.47% | -24.27% |
| 59 | capitalone.com | 162.3M | 4.81% | 34.40% |
| 60 | canva.com | 159.2M | 17.35% | 25.45% |
| 61 | ups.com | 158.5M | -2.88% | 17.98% |
| 62 | hulu.com | 145.3M | -2.10% | 0.41% |
| 63 | spotify.com | 145.3M | -0.99% | 13.58% |
| 64 | mlb.com | 143.5M | 8.17% | 14.29% |
| 65 | hbomax.com | 142.7M | -5.36% | 20.42% |
| 66 | citi.com | 141.4M | -4.83% | 7.20% |
| 67 | peacocktv.com | 141.0M | -46.74% | 37.74% |
| 68 | disneyplus.com | 138.0M | 14.36% | 50.94% |
| 69 | stripchat.com | 136.9M | -5.00% | -12.50% |
| 70 | finance.yahoo.com | 135.9M | -5.93% | -6.19% |
| 71 | lowes.com | 133.9M | -9.80% | 13.26% |
| 72 | people.com | 132.6M | 4.76% | 4.88% |
| 73 | t-mobile.com | 130.1M | -1.53% | 18.44% |
| 74 | bestbuy.com | 129.9M | 8.32% | 38.76% |
| 75 | msn.com | 128.2M | -6.26% | -33.49% |
| 76 | yelp.com | 126.1M | -6.14% | 1.87% |
| 77 | wayfair.com | 125.6M | 6.38% | 49.77% |
| 78 | accuweather.com | 125.4M | -15.67% | 22.28% |
| 79 | okta.com | 124.6M | 5.30% | 1.40% |
| 80 | quora.com | 122.6M | -5.07% | -29.25% |
| 81 | shopify.com | 118.0M | 0.90% | 83.39% |
| 82 | fidelity.com | 117.8M | -0.45% | 18.25% |
| 83 | github.com | 113.0M | -2.65% | 24.75% |
| 84 | bankofamerica.com | 112.8M | -2.03% | 14.54% |
| 85 | att.com | 110.5M | -0.54% | 8.32% |
| 86 | doordash.com | 110.2M | -2.32% | 67.02% |
| 87 | costco.com | 107.4M | 1.41% | 20.41% |
| 88 | realtor.com | 107.2M | -3.07% | -11.11% |
| 89 | xfinity.com | 106.6M | -6.47% | 4.61% |
| 90 | wellsfargo.com | 103.9M | -1.94% | 13.09% |
| 91 | shein.com | 102.0M | -6.54% | 10.94% |
| 92 | craigslist.org | 102.0M | -3.71% | -14.64% |
| 93 | adobe.com | 98.7M | 13.22% | 33.40% |
| 94 | narvar.com | 94.8M | -5.28% | 35.84% |
| 95 | substack.com | 93.8M | -2.17% | 25.22% |
| 96 | schwab.com | 92.1M | 0.80% | 10.35% |
| 97 | news.google.com | 91.6M | -0.53% | 3.21% |
| 98 | cvs.com | 90.1M | 3.62% | 9.51% |
| 99 | expedia.com | 90.1M | -7.86% | 26.70% |
| 100 | redfin.com | 89.9M | 1.48% | -4.29% |
#18 in the USA
📉 418.4M | -15.14% MoM
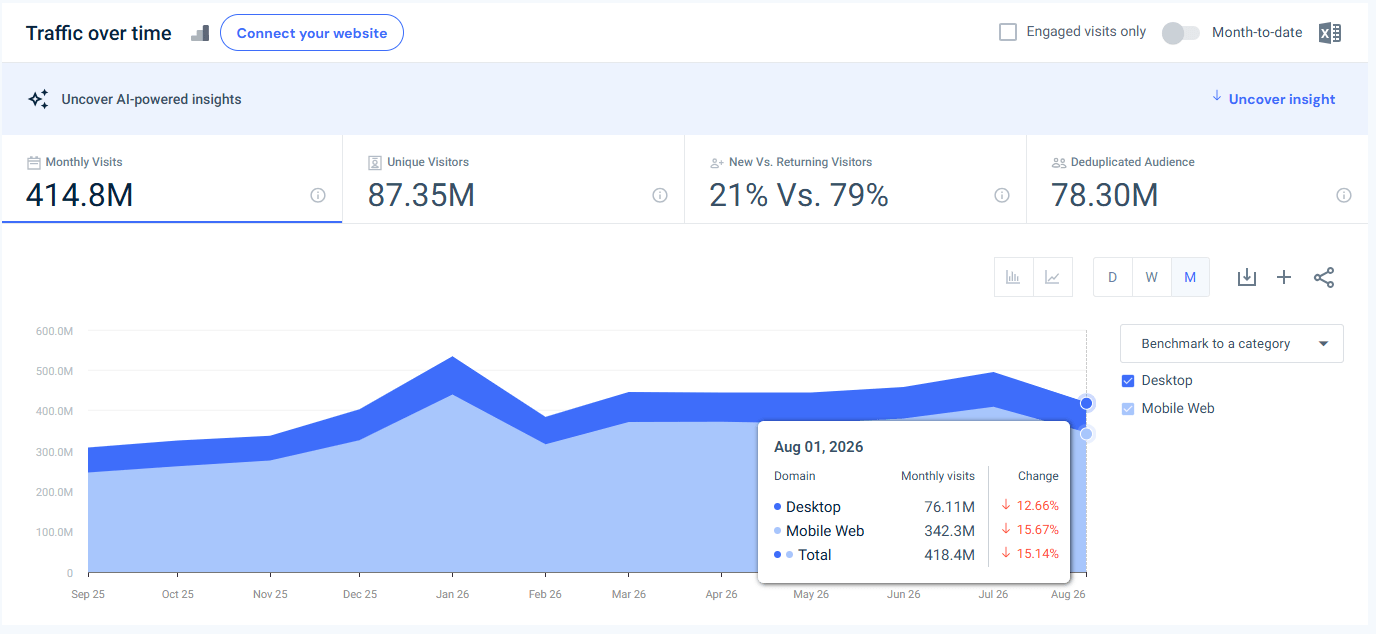
Why it matters: July 2026 was the hottest month on record across the contiguous United States, with an average temperature of 76.89 degrees Fahrenheit that edged out the previous record set during the Dust Bowl in 1936, according to PBS NewsHour. That heat wave sent Americans searching for forecasts and heat advisories in record numbers. August’s more typical late-summer conditions across most of the country pulled that demand back down, a decline that follows an unusually hot prior month rather than any lasting problem for the site.
#31 in the USA
📈 265.7M | +8.88% MoM
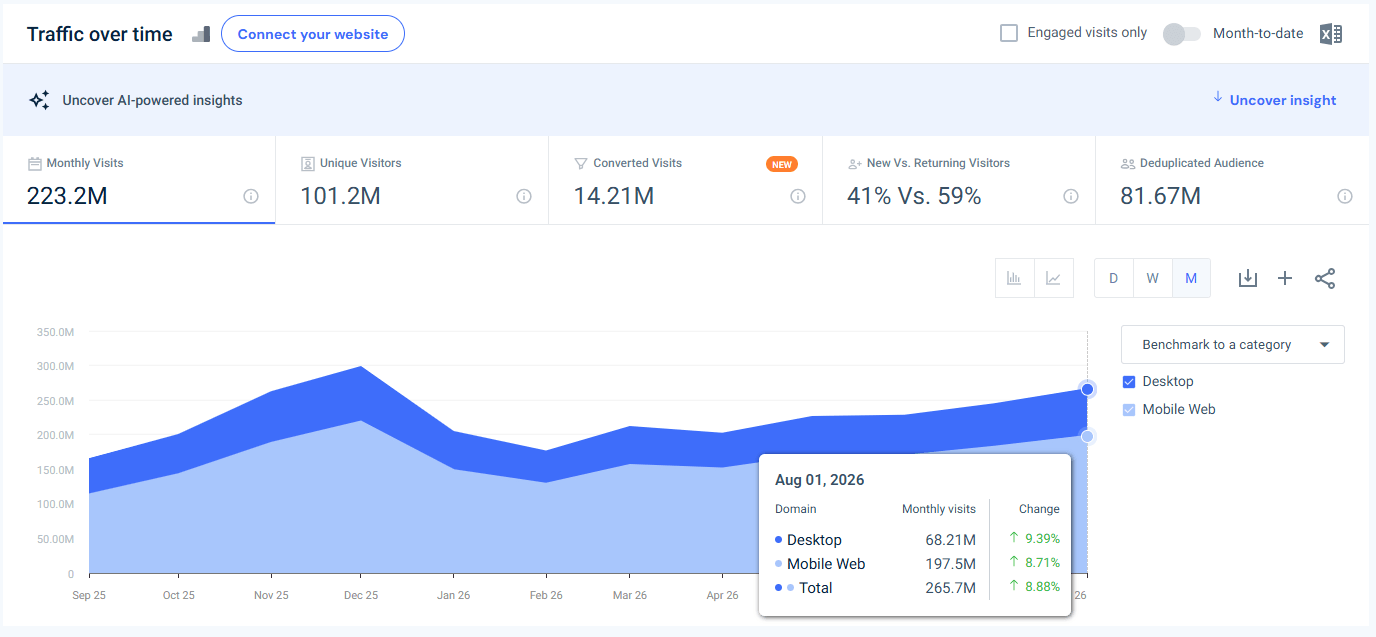
Why it matters: Target reported guest traffic up 3.6% and comparable sales up 3.8% in its second-quarter earnings, with CEO Michael Fiddelke pointing to rising digital traffic from AI platforms like OpenAI’s ChatGPT as part of the retailer’s turnaround, according to PYMNTS. Back-to-school promotions running through August added a second driver, layering seasonal demand on top of the AI-sourced gains.
#36 in the USA
📈 222.1M | +58.11% MoM
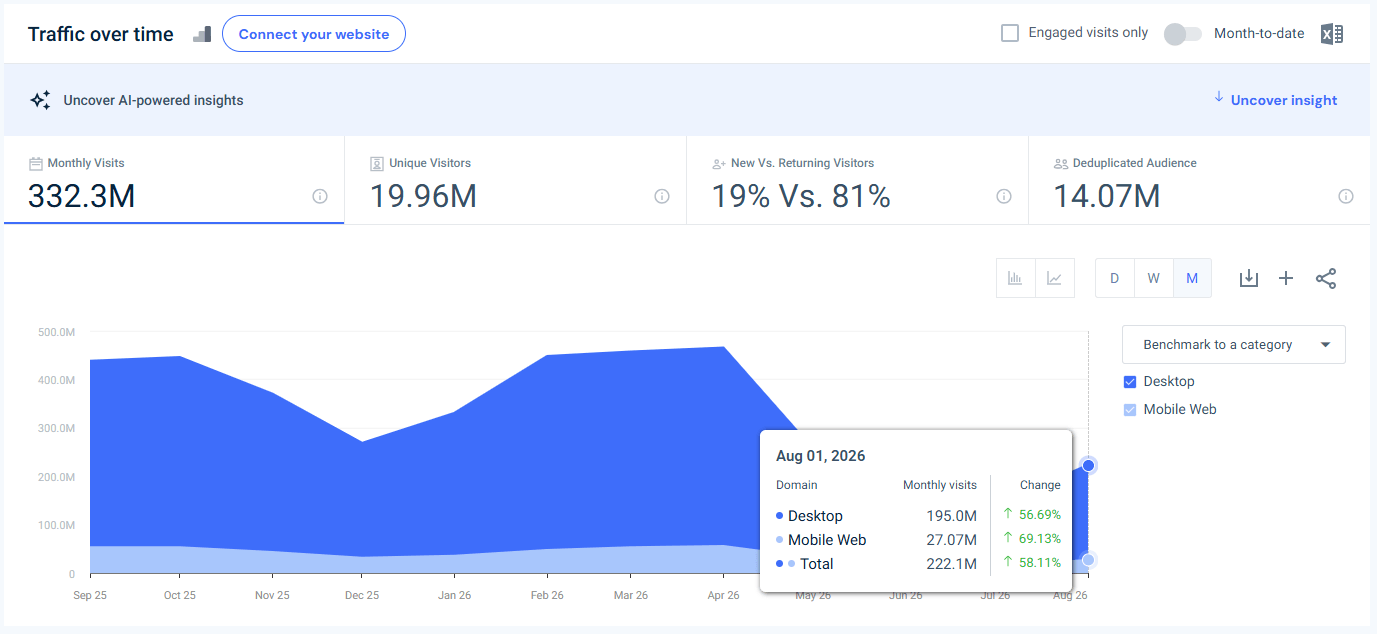
Why it matters: Most US colleges and universities open their fall semester in the last two weeks of August, with schools including UC Berkeley beginning instruction on August 26, 2026, according to its official academic calendar. Canvas serves as the learning management system for a large share of US higher education, so the return of students and faculty at the start of the semester drives a predictable, sharp spike in visits every August.
#37 in the USA
📉 219.4M | -5.58% MoM
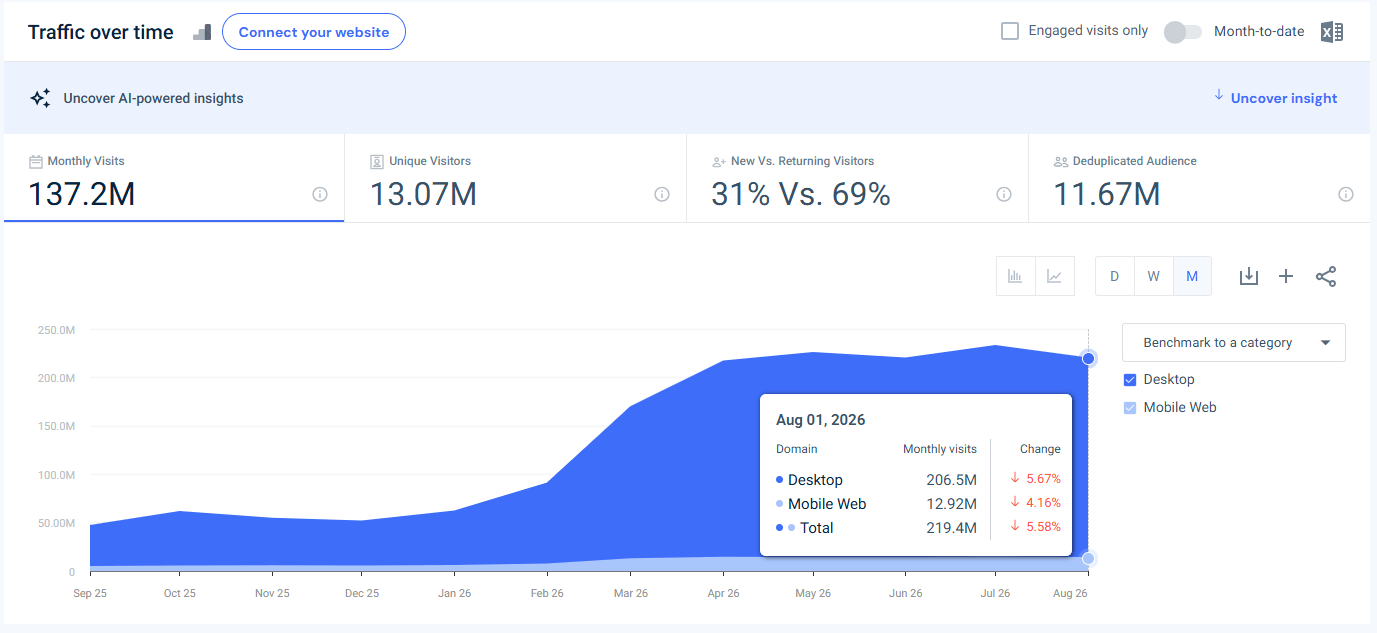
Why it matters: Similarweb data tracking generative AI website traffic shows Claude on a steady upward run over the past year, even as Gemini’s growth plateaued for the first time in over a year, according to OfficeChai. The site-level dip in US visits sits alongside that broader worldwide climb, consistent with normal month-to-month usage swings rather than any change in Claude’s competitive position.
#42 in the USA
📉 208.7M | -12.41% MoM
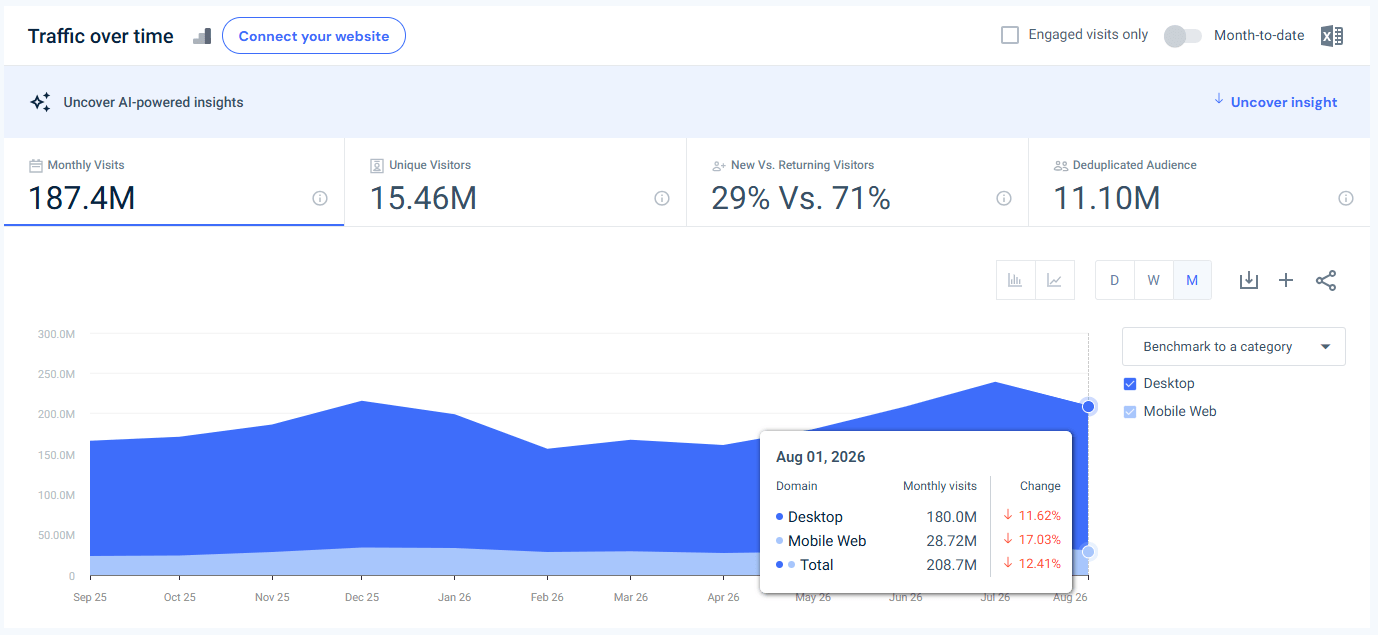
Why it matters: Roblox’s engagement has been cooling in a straight line since a Q3 2025 peak, with daily active users falling sequentially from 152 million to 123 million over the following three quarters, even though usage was still up 10% year over year, according to Shacknews. On the earnings call, CEO David Baszucki pointed to seasonality as a bigger driver of that pattern than the platform’s ongoing age-verification rollout, according to Music Ally. That seasonal read fits August specifically: much of Roblox’s core under-16 audience headed back to school in the back half of the month, the same timing that pushed instructure.com’s traffic up, cutting the usual summer screen-time peak short.
#49 in the USA
📉 195.2M | -11.48% MoM
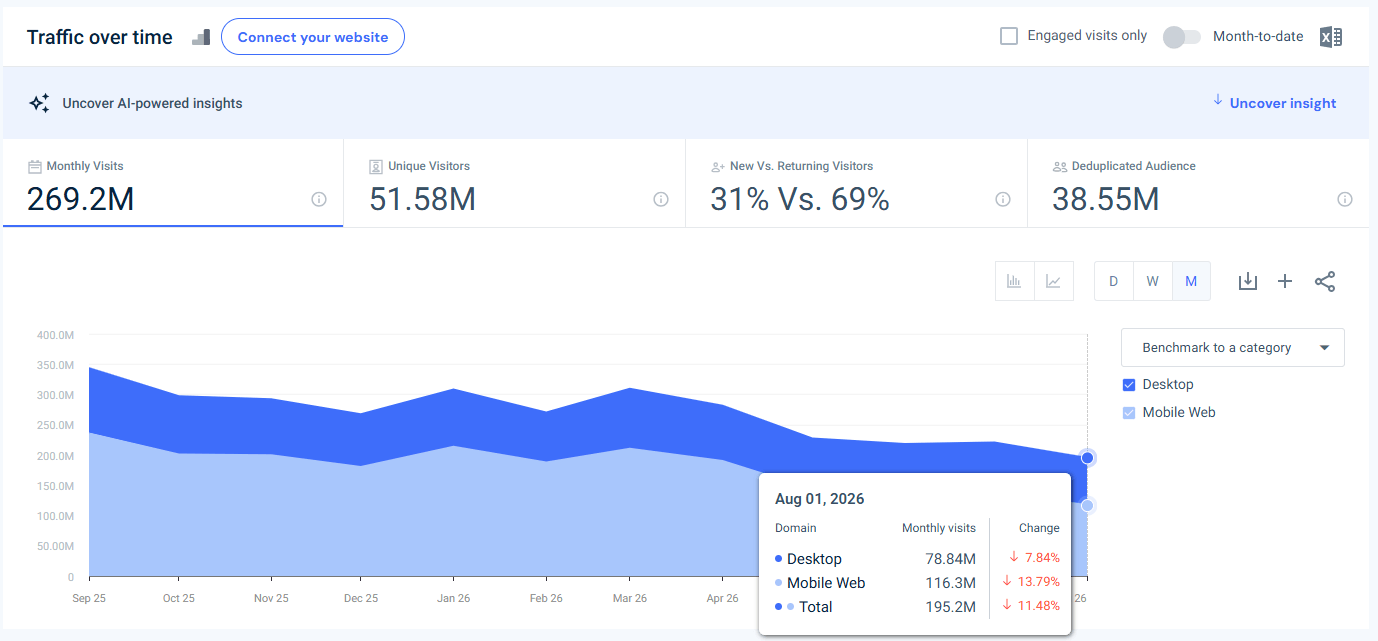
Why it matters: CNN’s traffic fell alongside a broader pullback across the top US news websites in August, when 40 of the top 50 US news sites lost traffic compared to July and 41 were down year over year, according to Press Gazette. The decline fits a longer pattern of shrinking direct traffic to news homepages as more readers get headlines through AI summaries and social platforms instead.
#60 in the USA
📈 159.1M | +17.35% MoM
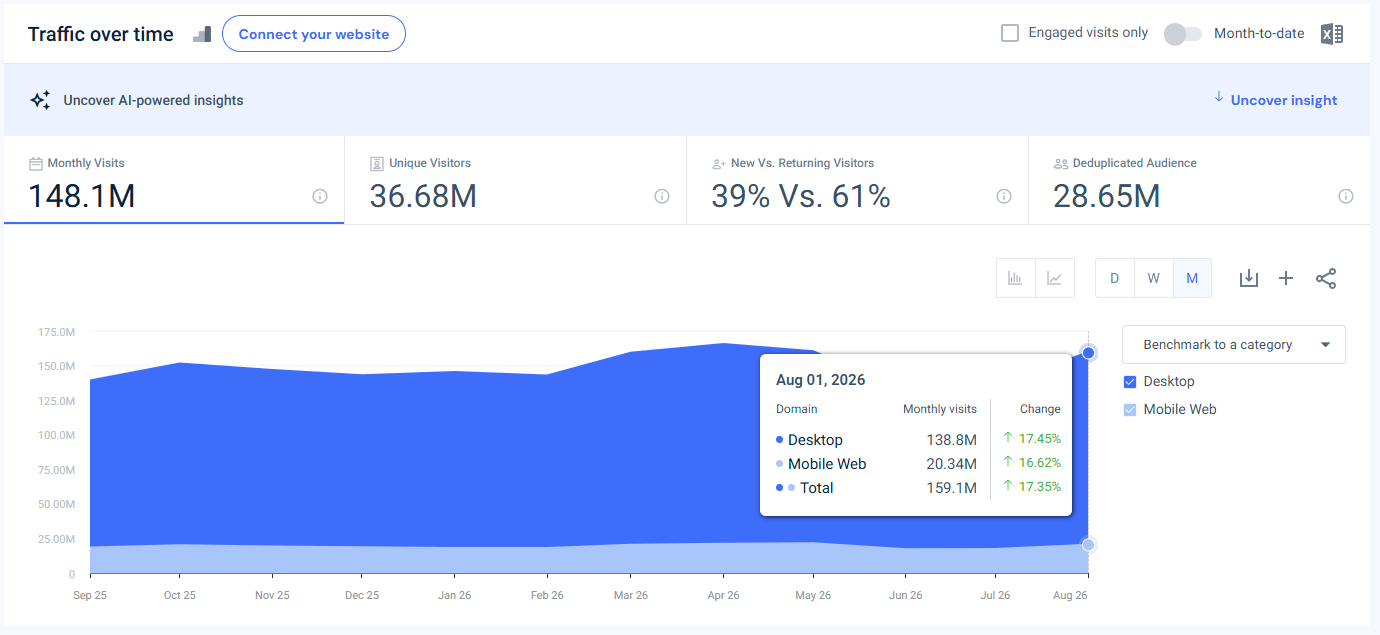
Why it matters: Canva co-founder Melanie Perkins said user demand for the company’s AI features “significantly exceeded” expectations, with Canva AI users now creating three times as many designs as they did on the previous version of the product, according to Fortune. That usage growth arrived as students and teams alike turned to Canva for back-to-school and start-of-year projects.
#64 in the USA
📈 143.4M | +8.17% MoM
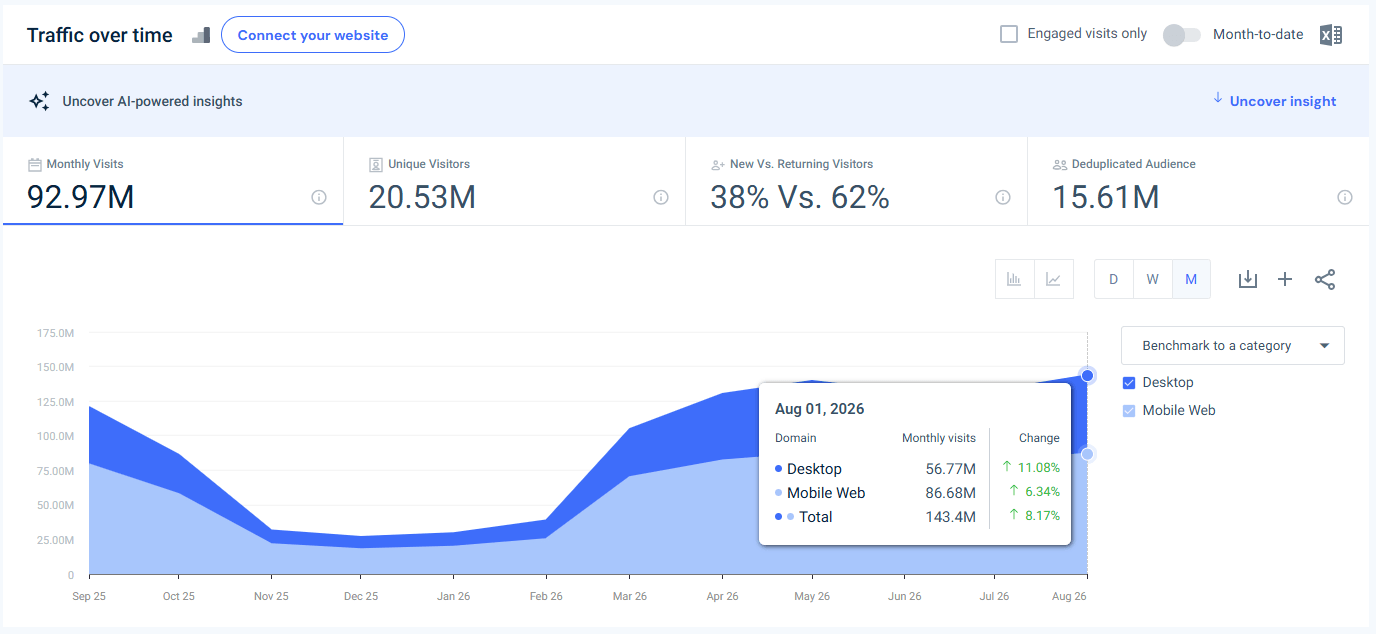
Why it matters: MLB entered the season’s final month with total attendance up 0.9% year over year, on pace for a fourth consecutive season of rising attendance, according to Front Office Sports. Tight divisional and wild-card races through August typically send fans to the site for standings, scores, and highlights, and this year followed that same pattern.
#67 in the USA
📉 140.9M | -46.74% MoM
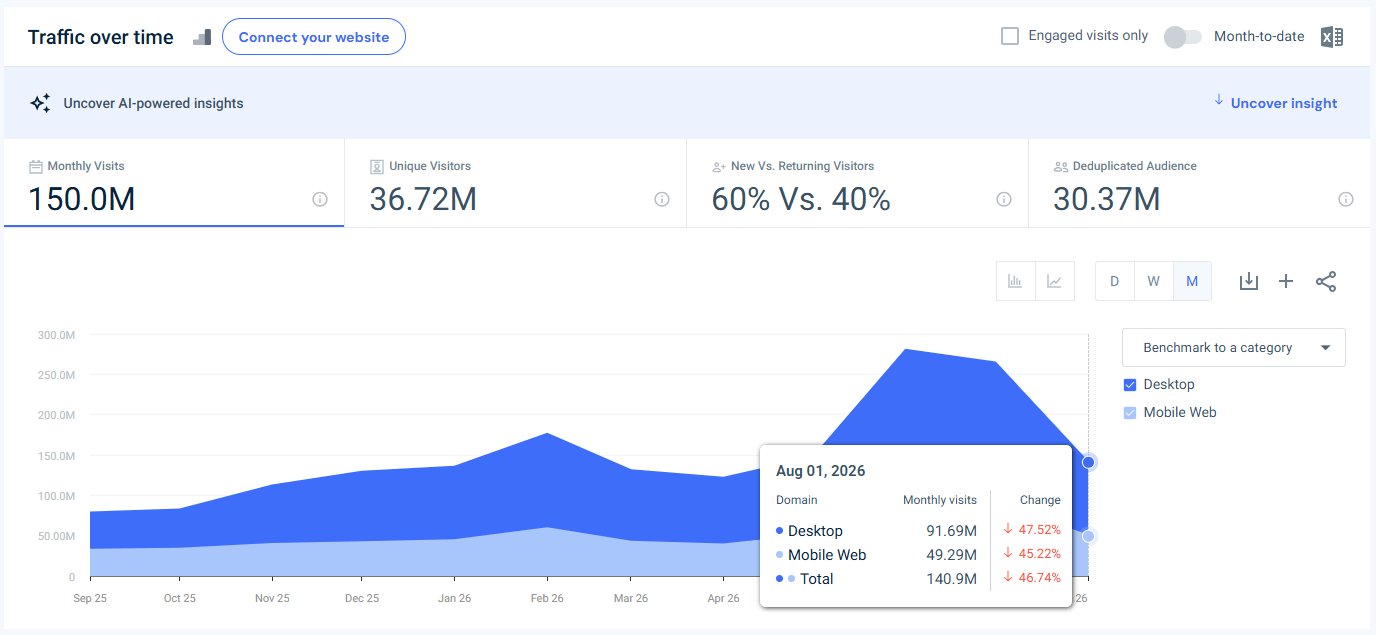
Why it matters: Peacock’s mobile usage jumped 75% above its average in June 2026 on the back of FIFA World Cup 2026 coverage and a Love Island USA reunion special, a peak with nowhere to go but down once the tournament wrapped. Entertainment writers flagged Peacock as one of the easiest streaming subscriptions to cancel in August 2026 given a quiet content slate for the month, according to Yahoo Entertainment.
#68 in the USA
📈 138.0M | +14.36% MoM
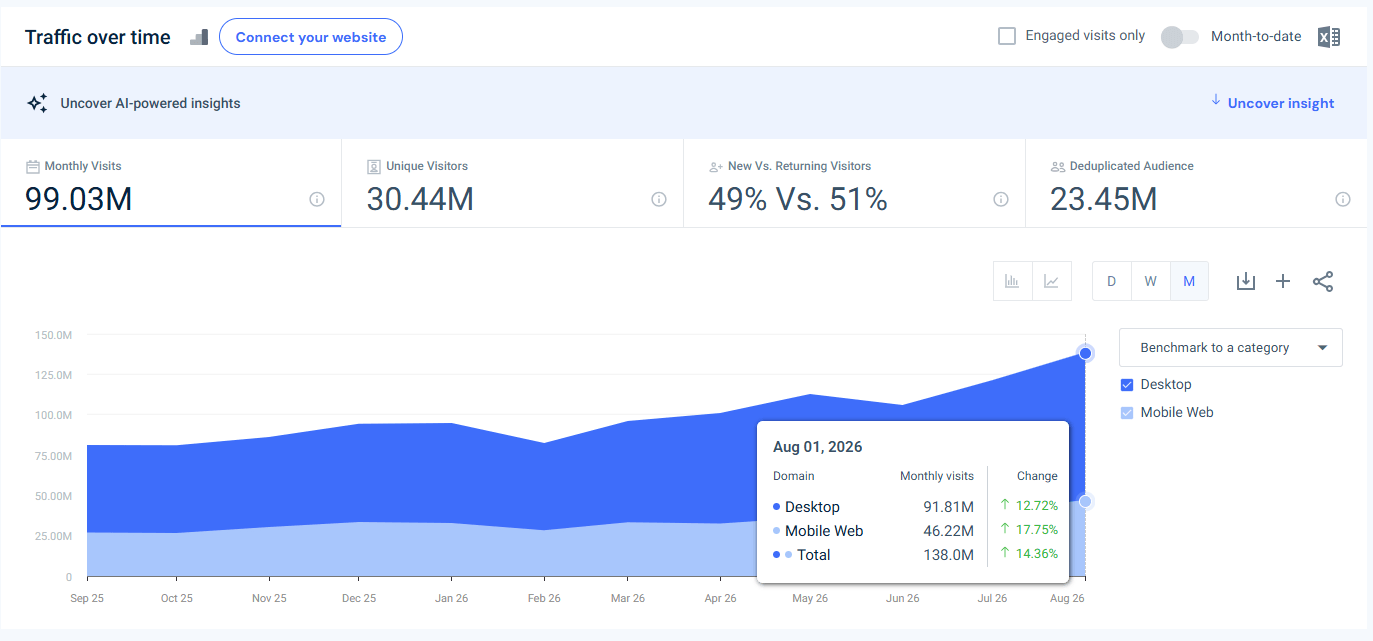
Why it matters: August 2026 brought a full Disney+ release schedule that included new Star Wars content, a Lion King documentary from Jon Favreau, the return of Futurama for its 14th season, and live sports coverage across WNBA and PGA Tour events, according to Disney+ Press. That steady drip of new releases throughout the month kept subscribers coming back.
Streaming had one of its widest swings of the year in August.
ChatGPT grew 4.14% month over month in August, while Gemini slipped 4.22% and Claude eased back 5.58%.
Retail traffic leaned positive in August as back-to-school shopping ran its course.
News sites broadly lost ground in August.
For a closer look at how these numbers break down by site, category, or country, explore Similarweb’s Web Intelligence platform or check Similarweb’s free top websites ranking tool for the latest monthly rankings.
Search engines, social platforms, and video and streaming sites take up most of the top 20 spots on this list. Google, YouTube, and Facebook alone account for a large share of total US visits, with ecommerce, news, and reference sites filling out most of the rest of the top 100.
Visits count every session a person starts on a site within a month, so someone who checks Google ten times in a day generates ten visits. Unique visitors count each person once regardless of how many times they return, making it a better measure of audience reach, while visits better reflect overall engagement.
The top 10 to 15 positions stay fairly stable from month to month, since sites like Google, YouTube, and Facebook hold commanding leads. Further down the list, ranks move more often, as seasonal events, earnings reports, and content releases push mid-tier sites up or down by ten or more places, the way instructure.com and peacocktv.com did this month.
Similarweb estimates monthly visits by combining data from a global panel of monitored devices, direct measurement from websites that share their own analytics, and public data sources, then models that sample up to the full population of internet users in a given country or region.
The top 10 sites in this ranking each pull in well over a billion monthly visits, while sites toward the bottom of the top 100 handle closer to 100 million. That gap reflects how concentrated US web traffic is at the very top of the list, where a handful of search, social, and video platforms absorb a disproportionate share of all browsing activity.

Senior SEO Specialist
Shai, with 10+ years in SEO, holds a Bachelor’s and an MBA. He enjoys TV shows, anime, movies, music, and cooking.
Similarweb Named in Forrester's Answer Engine Optimization Technologies Landscape, Q3 2026

Anthropic IPO: What Claude's Web and App Data Show

What Is Price Intelligence? Definition, Components, and How It Works
Contact us to set up a call with a market research specialist

