





Top Ecommerce Companies in the USA: The 100 Brands Winning the Traffic Race in 2026
by Inbar Eytan6 Min.
Aug 30, 2026
As November fades into December and the holidays take center stage, it’s the perfect time to look back at the digital stories that turned heads last month.
From social media shake-ups to Black Friday winners, November had no shortage of excitement. Here are three standout moments:
While these stories dominated the headlines, we’ve been busy behind the scenes with product updates to keep your strategies sharp and your insights impactful.
Here’s what was new in November:
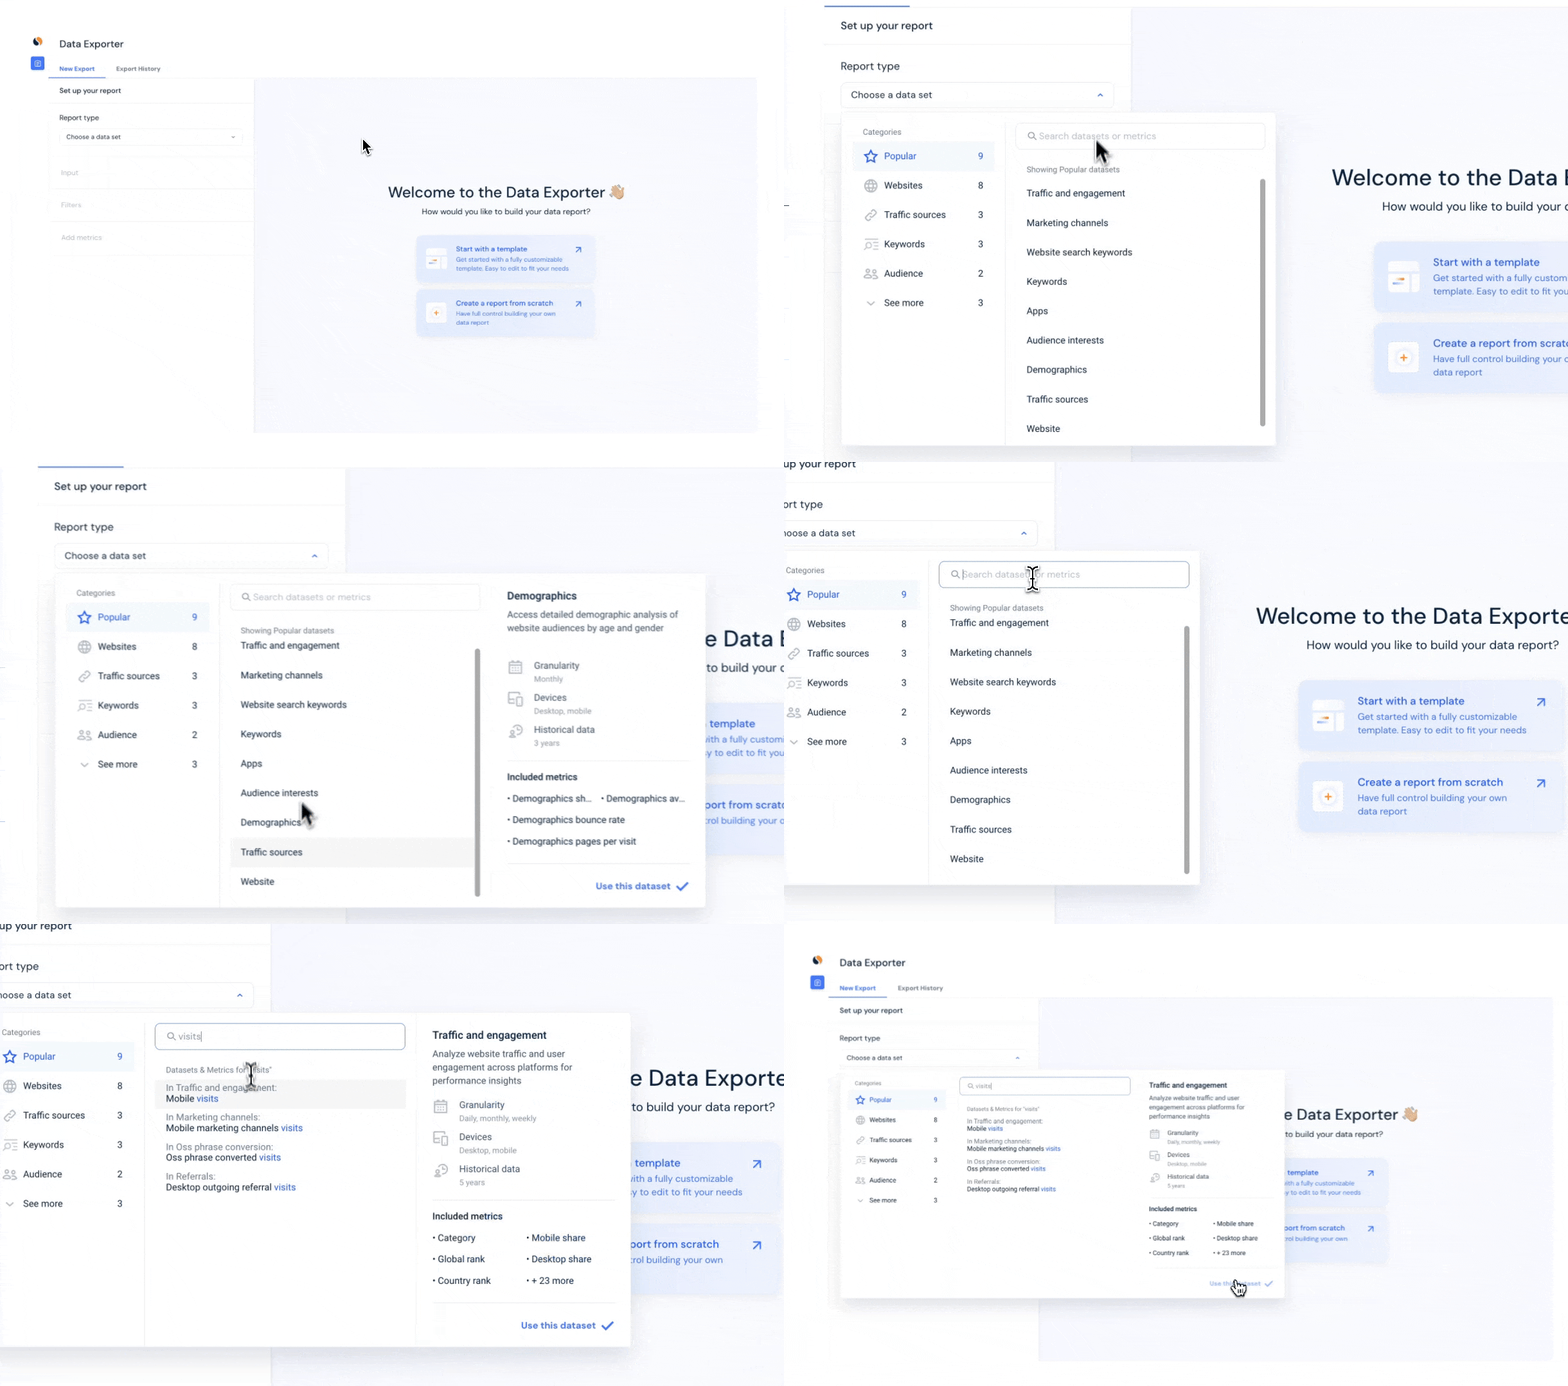
We’ve just rolled out an updated navigation menu in the Data Exporter to make finding datasets and metrics a breeze.
Here’s what’s new:
Start building your reports with the data you need—faster and smarter.
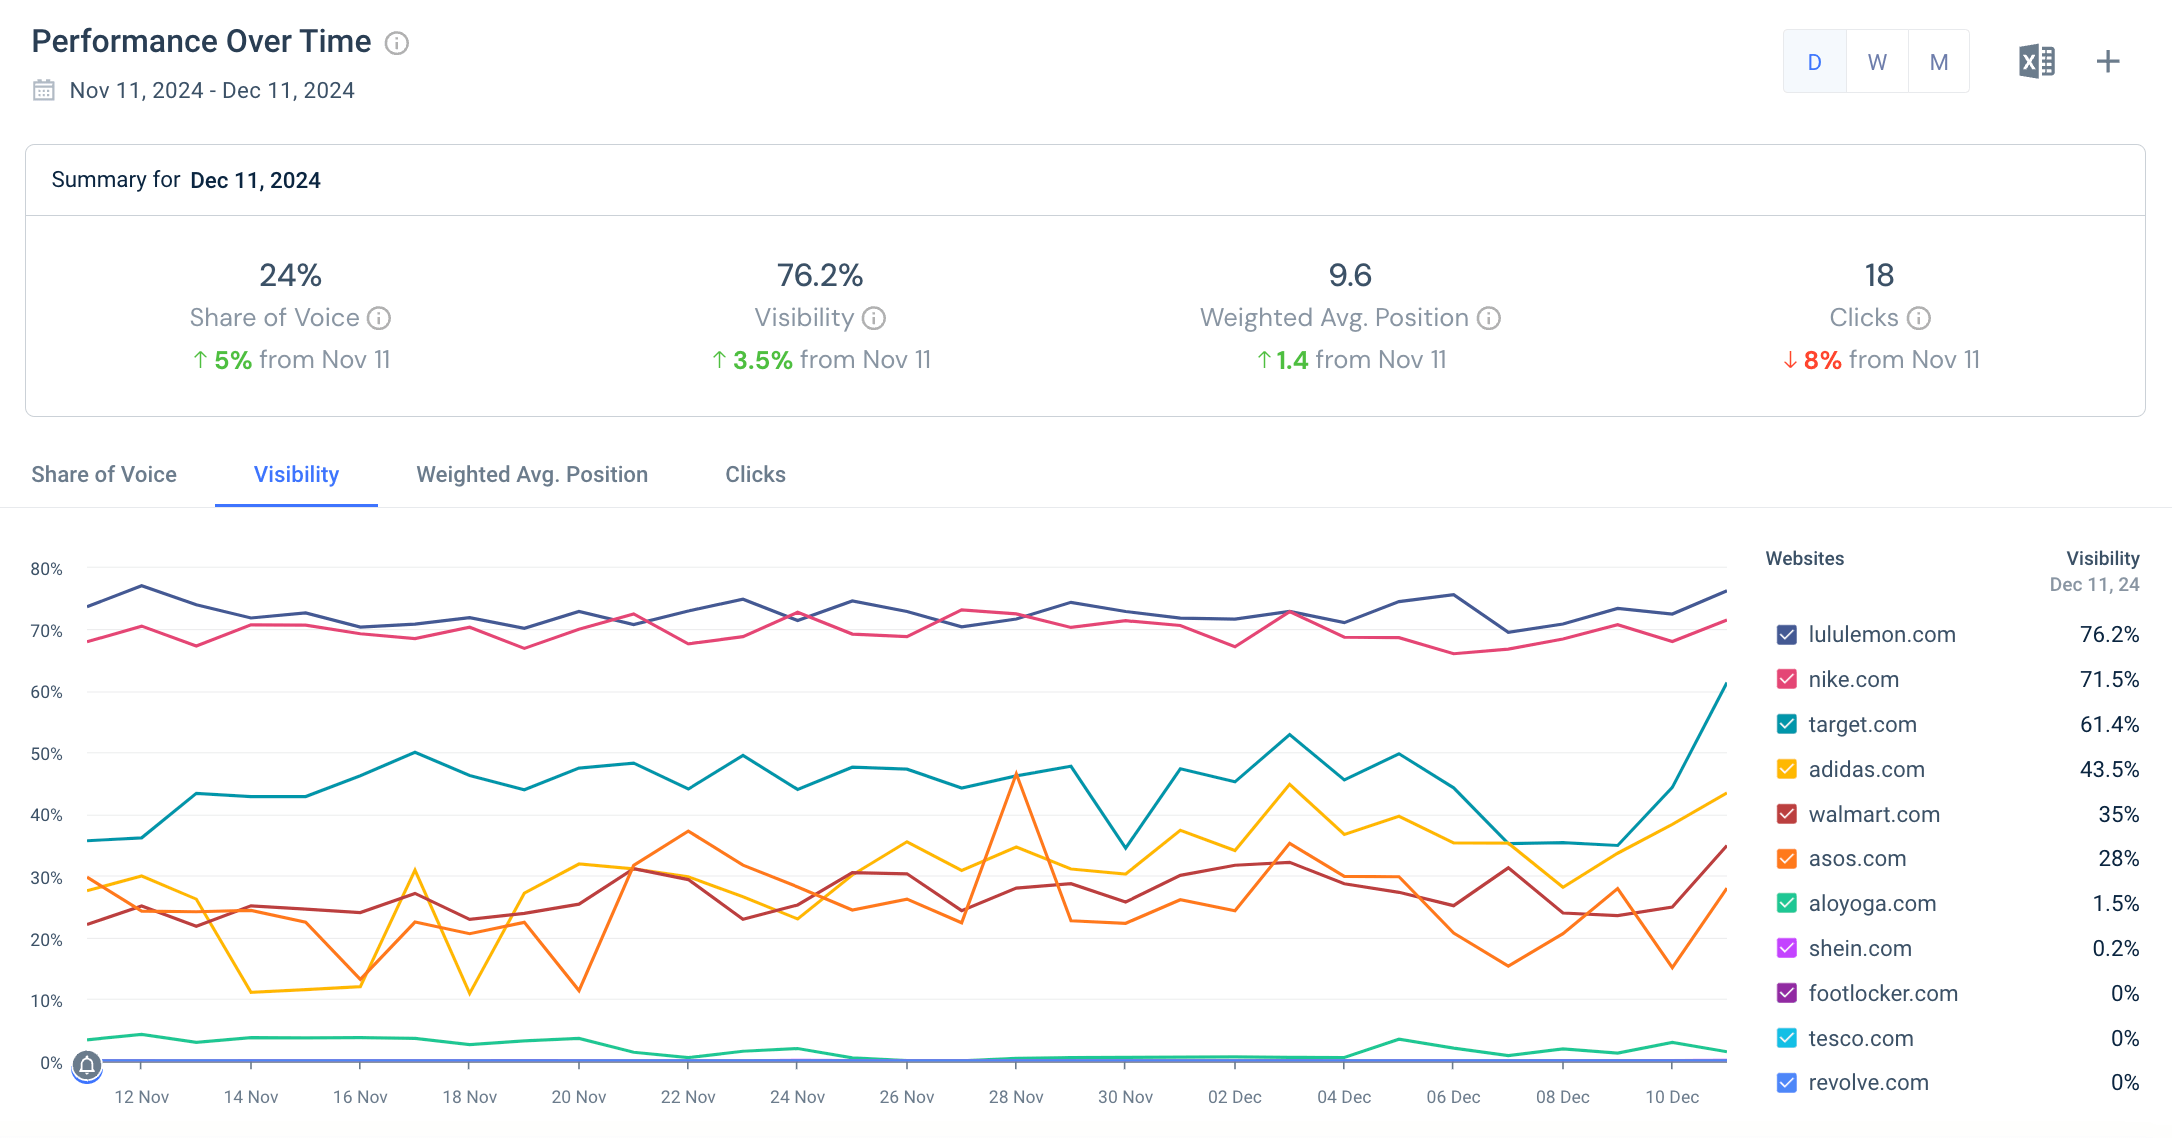
Seeing double on Rank Tracker? Don’t adjust your glasses, we’ve doubled the number of core competitors you can track from 5 to 10. So while the competitive report still shows your top 100 competitors, with core competitor tracking you can keep close tabs on the competitors you care about most.
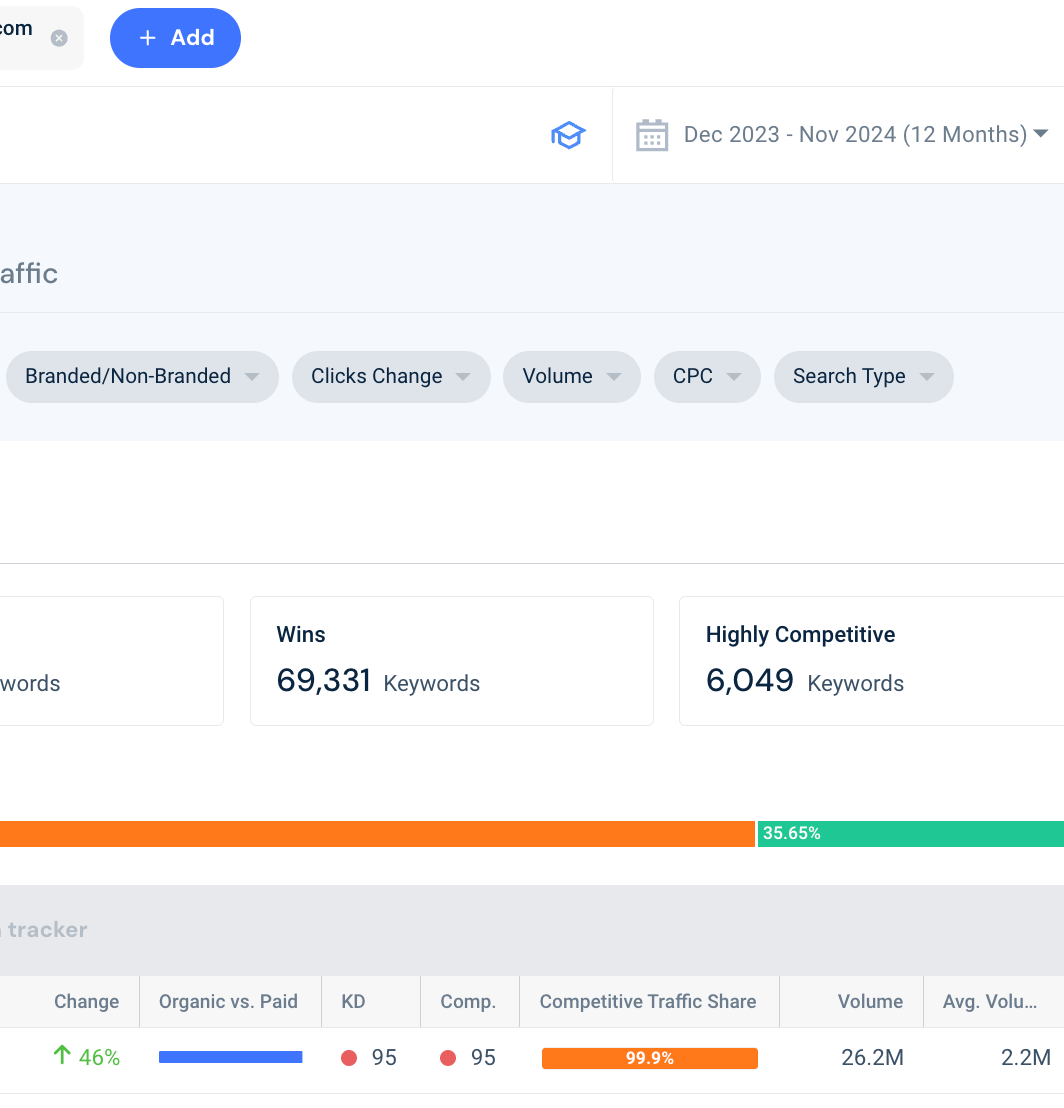
Our Website Keywords feature now lets you dive into historical data with a 12-month date picker. Analyze trends back to January 2023, compare organic, paid, and total search, and spot keyword gaps or opportunities across up to five websites.
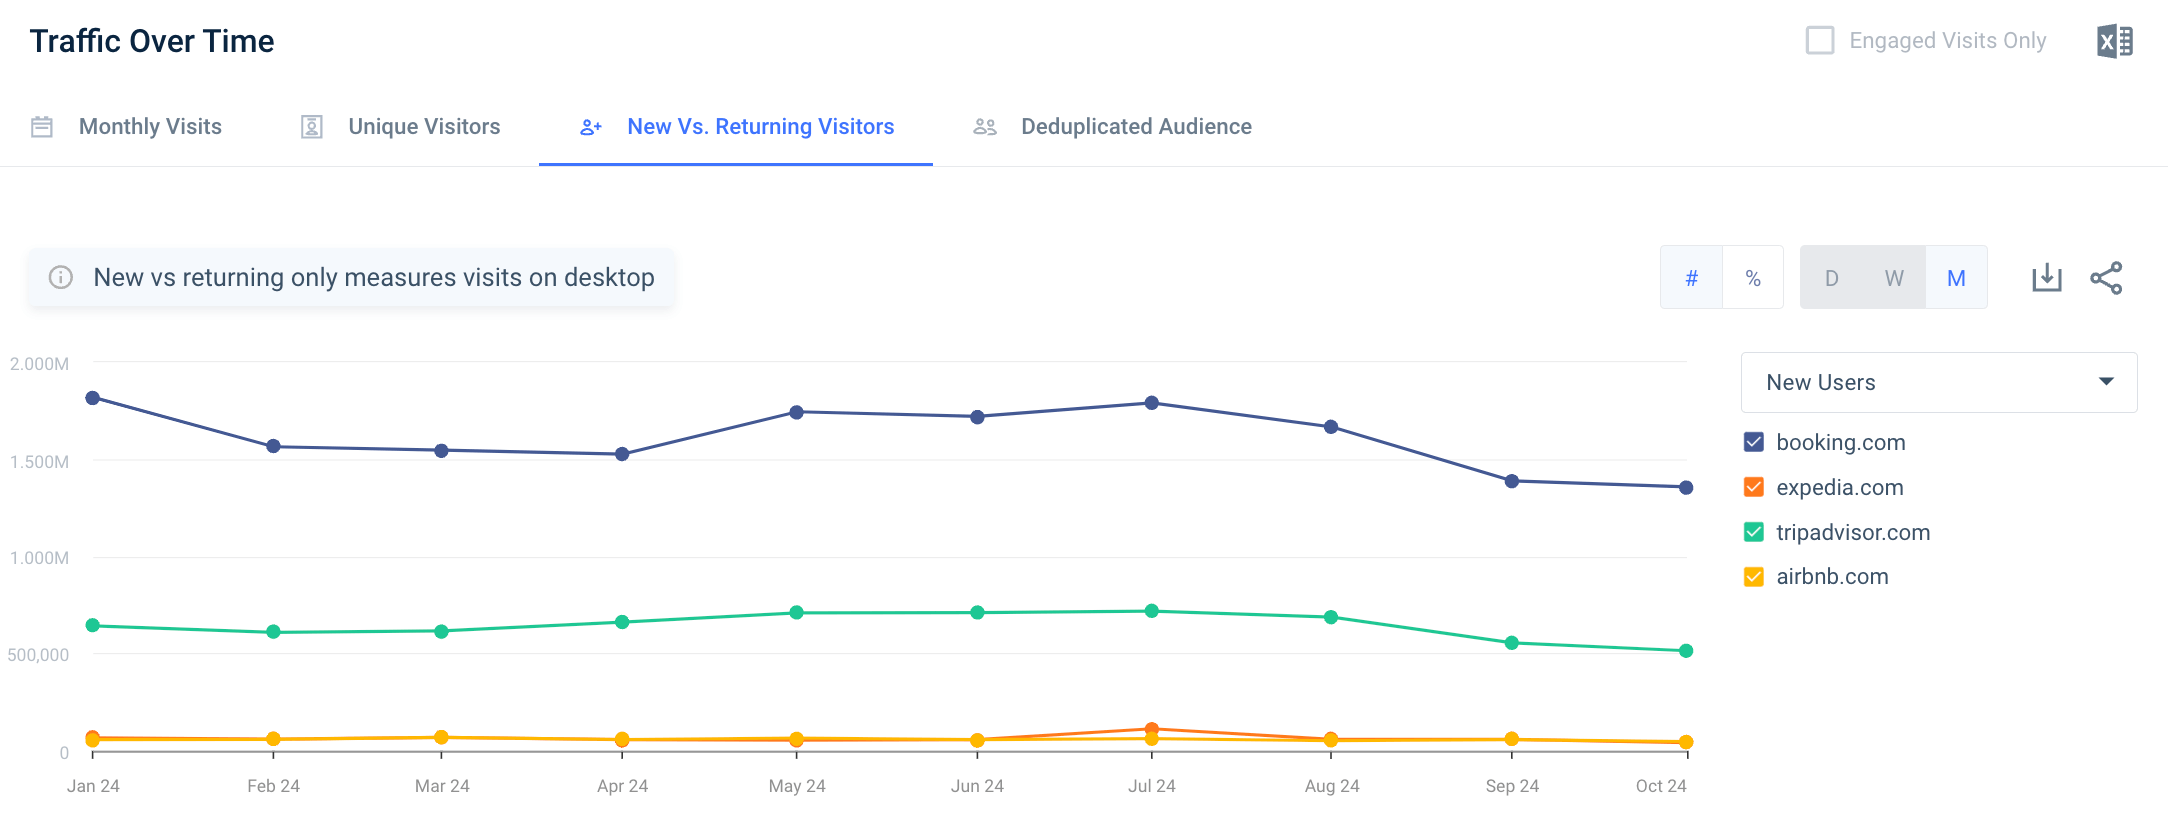
Analyze retention metrics like never before. Now, you can track the ratio of new users vs. returning users over time for your site and the competition. Better yet? The metric is now part of the Traffic & Engagement page, giving you easy access to user trends in the right context.
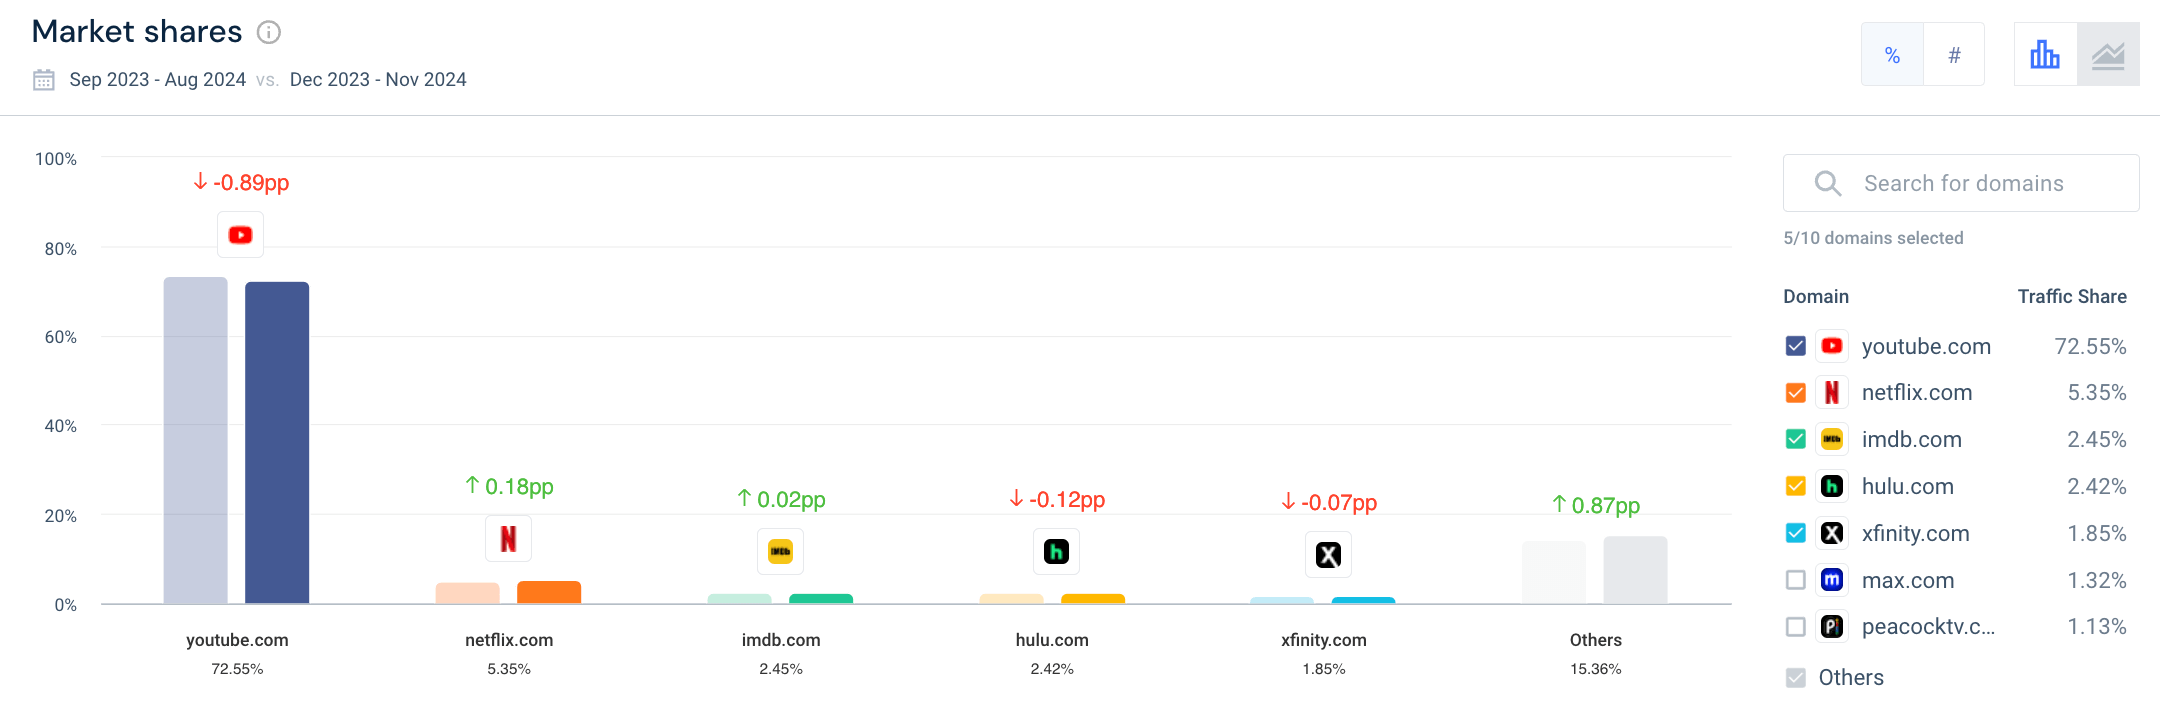
Quickly spot changes in market share and performance with the new period-over-period view on the Market Players page.
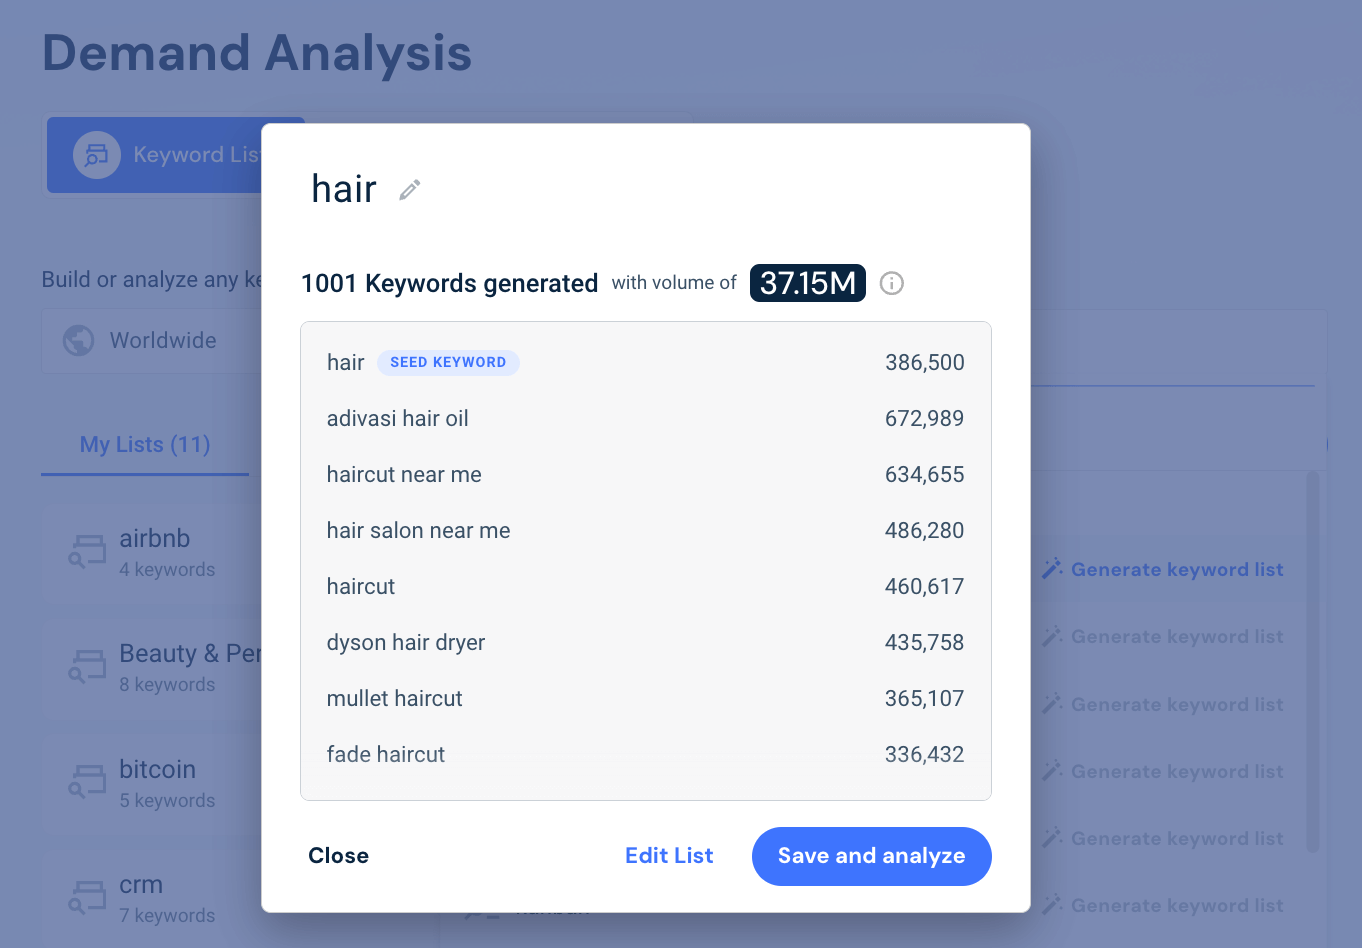
Our Keyword List Generator in Demand Analysis just got even better thanks to a revamped suggestion pop-up. We’ve made it easier than ever to create a keyword list by enhancing both the interface and the suggestions themselves. Now, keyword phrasing and relevance scores are seamlessly combined into a single, optimized list—helping you find the best options in just one click.
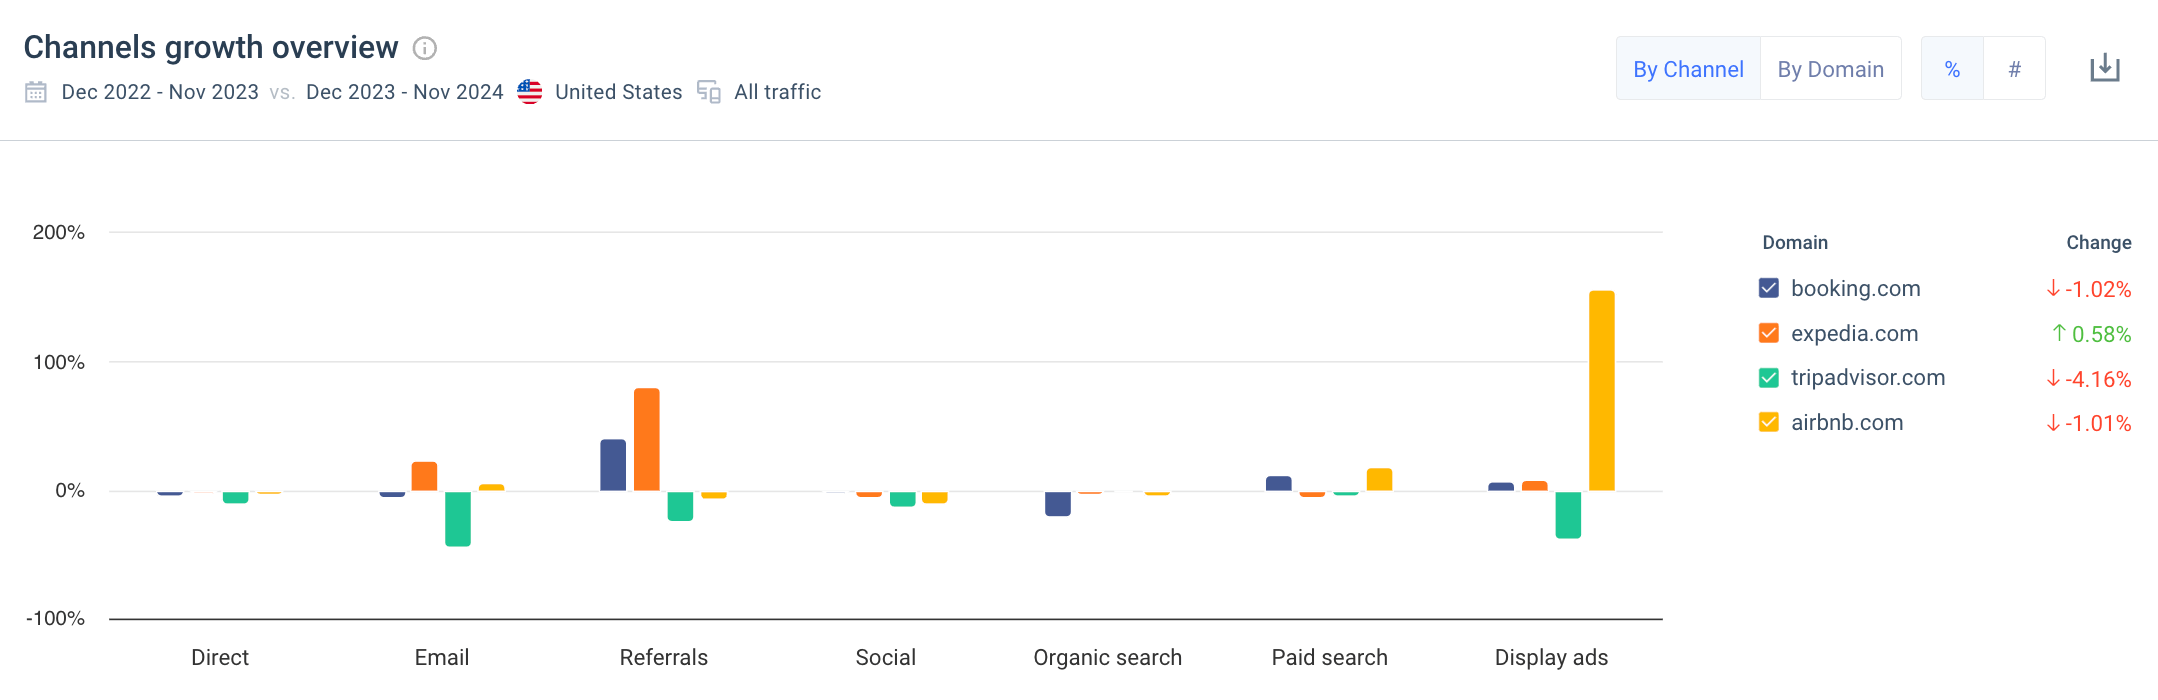
Easily identify and compare shifts in marketing channel performance with our updated Marketing Channels tool. Analyze traffic period-over-period, with detailed breakdowns for both mobile and desktop. Choose how you view channel distribution changes—by percentage or volume—based on your needs. Then, decide whether to analyze the competition by “domain” or by specific “channels,” depending on what information you need.
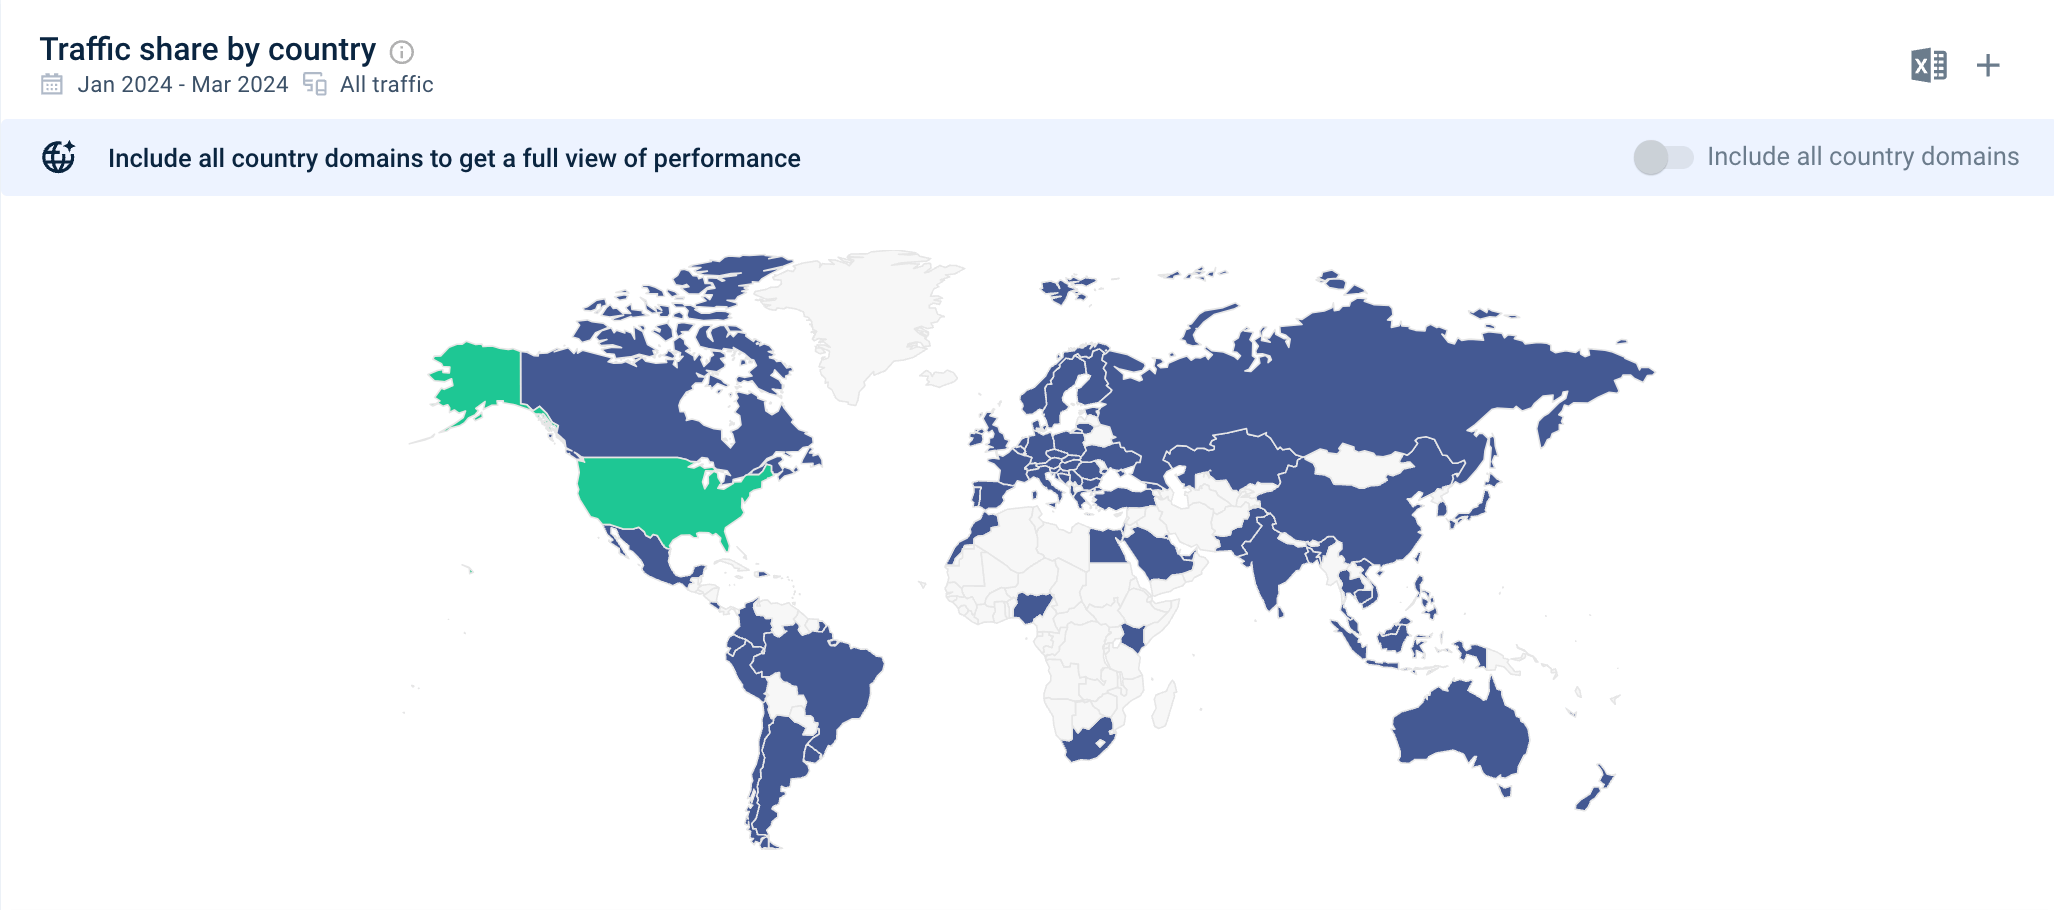
Find a clearer and more tangible visualization of the winning sites by country. With a tangible global map visualization of website traffic per country, you can get a real competitive share of each brand and a better representation of each market, including the ability to include all country domains.

by Adelle Kehoe
Director of Product Marketing
Adelle is the Director of Product Marketing at Similarweb. She works closely with the SEO and Marketing industry to bring meaningful data, stories, and products to life.
Top Ecommerce Companies in the USA: The 100 Brands Winning the Traffic Race in 2026

3 of the Sharpest Minds Weigh in on the State of Gen AI in 2026

Give it a try or talk to our insights team — don’t worry, it’s free!
