


How to Analyze App Retention and 5 Best Practices
App retention is hard: Most users drop off within days of installing an app. But by focusing on the right levers, like onboarding, user experience, re-engagement, and personalization, you can reduce churn and build lasting user relationships.
What is mobile app retention?
App retention measures how many users continue to use a mobile application after their initial download and interaction. It is tracked over a set time frame, with a special focus over the first days and weeks following installation, where most apps lose a majority of their users. Retention serves as an indicator of an app’s ability to deliver ongoing value and meet user expectations.
Experienced app developers understand that succeeding with an app goes beyond download metrics. It is very hard to retain app users, and even small improvements to retention can drive more engagement, generate higher revenue, and contribute valuable feedback necessary for product development. In contrast, low or declining retention signals problems in onboarding, feature design, or overall user experience.
What are average app retention rates and what is considered good retention?
App retention rates vary widely by platform, geography, and app category, but there are some consistent benchmarks that developers can use to evaluate performance. On average, about 25% of users return on day one after installing an app. Studies by Statista, Adjust, and AppsFlyer, cited by Sendbird, all place day-one retention between 24% and 26.5%.
By day seven, the retention rate typically drops by half, averaging around 12%. This period is a critical checkpoint for user engagement, and many developers use targeted campaigns to re-engage users at this stage.
The day 30 retention rate is often viewed as a longer-term indicator of product-market fit and user loyalty. Across industries, this metric averages about 5%, with figures ranging from 3.36% (AppsFlyer) to 6.5% (Adjust). While these averages offer a baseline, meaningful comparisons require segmenting by app category.
It’s also important to consider platform and regional differences. iOS apps currently show higher retention than Android, and developed countries tend to see better long-term retention than emerging markets. For example, Japan averages nearly 5.8% at day 30, while China sees just 1.22%.
In short, a “good” retention rate depends on context, but most developers should aim for 25% on day one and at least 5% by day 30 to stay competitive.
Key app retention metrics to monitor
Day 1, day 7, day 30 retention rates
It is common in the industry to watch retention closely in the first month after it is installed by a user:
- Day 1 retention provides a snapshot of the app’s immediate value and the effectiveness of its onboarding process. It is common for apps to lose 75% or more of their users on day 1. Users who churn at this point didn’t connect with the app’s core value or found the onboarding experience too complicated.
- Day 7 retention is a critical milestone because it reflects whether users are integrating the app into their daily routines or usage habits. At this stage, users should have enough exposure to experience the app’s main value propositions. A low Day 7 retention rate could highlight gaps in user app engagement strategies or the need for more compelling features.
- Day 30 retention is a strong indicator of the app’s long-term value and whether it’s solving a problem or fulfilling a need consistently. Apps with high Day 30 retention typically provide ongoing utility, entertainment, or content that keeps users coming back.
Churn rate
Churn rate quantifies the percentage of users who stop using the app during a specific time period, often monthly or annually. It is essential to monitor churn because it directly impacts the growth of your user base.
A high churn rate suggests that users are dissatisfied, that the app fails to deliver sustained value, or that there are obstacles in the user journey, such as confusing navigation or lack of meaningful updates. There are three main types of churn to consider:
- Voluntary churn: When users actively uninstall or stop using the app.
- Involuntary churn: When users can no longer access the app due to technical issues, device incompatibility, or account problems.
By segmenting churn by user demographics, source, and engagement patterns, businesses can better understand why users leave and take corrective action, whether that’s improving features, resolving technical issues, or refining marketing strategies to target the right audience.
Lifetime value (LTV)
Lifetime value (LTV) is a key metric for understanding the overall revenue potential of a user across their entire relationship with the app. LTV is influenced by several factors, including how long a user remains active, how often they make purchases, and the average value of those purchases.
For apps that offer in-app purchases or subscriptions, LTV is critical for determining the ROI of customer acquisition costs. A higher LTV indicates that users are consistently deriving value from the app and are willing to spend money on premium features, additional content, or other monetization options.
Additionally, LTV can be used to identify the most valuable customer segments and help guide marketing and retention strategies. By improving retention, businesses can increase LTV by fostering deeper user engagement, offering personalized experiences, and creating new revenue-generating opportunities.
Stickiness: Daily vs. monthly active users (DAU/MAU)
DAU and MAU track user engagement by measuring how many unique users interact with the app during a day or month. DAU focuses on immediate, short-term engagement, while MAU provides a broader picture of user activity over time. Both metrics are valuable for understanding the frequency and depth of user engagement.
If a user only opens the app once a month, the app may not be fulfilling an essential, frequent need. A high DAU shows that users are actively engaging with the app on a daily basis, which often translates into better retention rates.
The DAU/MAU ratio (often called “stickiness”) measures how many of the monthly active users are engaging daily, which reflects the app’s ability to keep users coming back regularly. A higher DAU/MAU ratio indicates that users are relying on the app and that it is likely central to their daily activities.
Factors influencing app retention
Here are some of the key factors that can improve app retention.
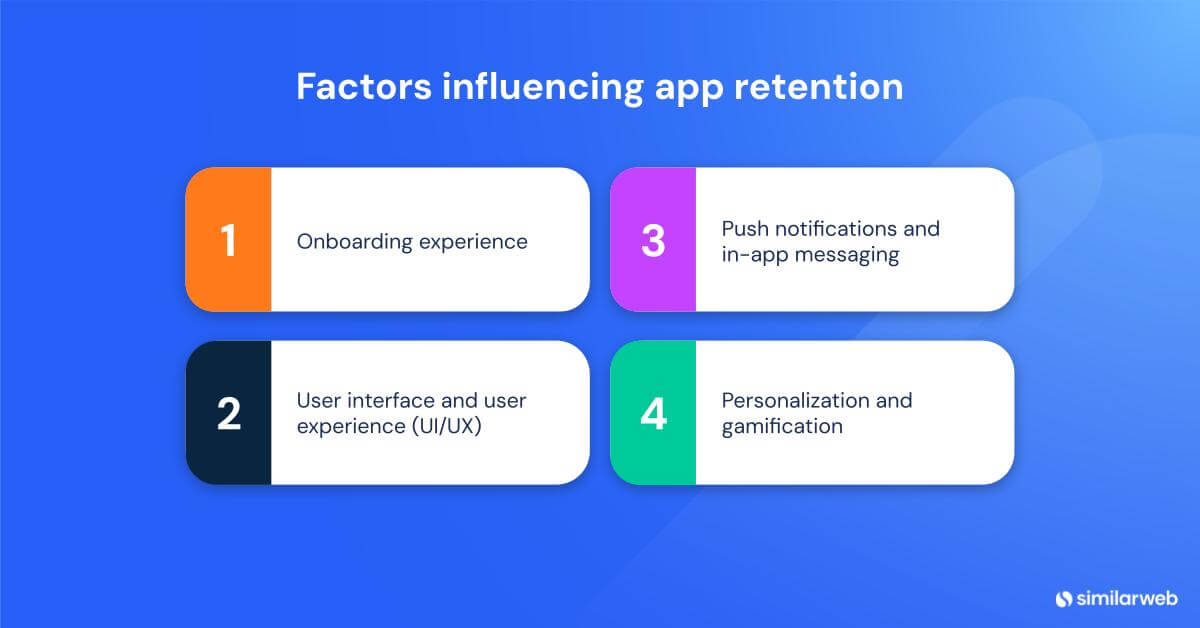
1. Onboarding experience
The onboarding experience is often the first and most critical interaction users have with an app. A seamless and intuitive onboarding process can significantly improve retention, while a confusing or frustrating one may lead to users abandoning the app quickly. The goal of onboarding is to guide new users through the app’s key features, ensuring they understand how to use the app effectively and what value it provides.
Clear instructions, minimal friction, and providing value right away are essential elements. Including features like tutorial screens, tooltips, or interactive walkthroughs can help users get started without feeling overwhelmed.
Offering personalized onboarding experiences based on the user’s preferences or data (e.g., location, interests) can also improve retention by making users feel that the app is tailored to their needs from the start.
2. User interface and user experience (UI/UX)
The design and usability of an app are crucial factors influencing retention. A clean, intuitive user interface (UI) and a positive user experience (UX) make it easier for users to navigate the app and access its features.
Optimizing app navigation, ensuring that key features are easy to find, and minimizing the number of steps required to complete tasks can improve the UX. Responsive design, fast load times, and smooth interactions are key factors in creating a satisfying experience.
3. Push notifications and in-app messaging
Push notifications and in-app messaging are effective tools for re-engaging users and keeping them informed about important app updates, new content, or promotions. Push notifications, when used strategically, remind users about the app’s value and can prompt them to return for time-sensitive offers or updates.
Personalized push notifications, based on user behavior or preferences, are more likely to capture attention and drive engagement. In-app messaging can be used to engage users while they are actively using the app. These messages can provide helpful tips, offer promotions, or guide users through new features, improving the overall experience.
However, it’s important to strike the right balance: too many notifications can annoy users and lead to opt-outs, while too few may result in disengagement.
4. Personalization and gamification
Personalization and gamification are powerful strategies for increasing user engagement and retention.
Offering personalized content, product recommendations, or user-specific notifications increases the relevance of the app, making it feel more valuable and engaging. Personalization can also involve adaptive user interfaces, where the app’s features or layout change based on user behavior or needs over time.
Gamification introduces elements like achievements, leaderboards, challenges, and rewards to the app experience. These elements tap into users’ motivations, encouraging them to return to the app to complete tasks or earn rewards. Gamification increases user engagement by adding a layer of fun, competition, or a sense of progression.
How to analyze app retention?
I used Similarweb App Intelligence tools to analyze the app retention. Here’s how to start:
- Search for your app in the App Intelligence dashboard.
- Select the “User Retention” report from the left-hand menu. This report is only available for Google Play apps.
- Adjust filters for country (e.g., United States) and time range (e.g., Sep 2025). You can also add up to four competitor apps for benchmarking.
- Interpret the charts. The report displays a retention rate line-chart and a historical retention heat-map. The line chart plots Day 0 through Day 30 retention for your app and competitors.
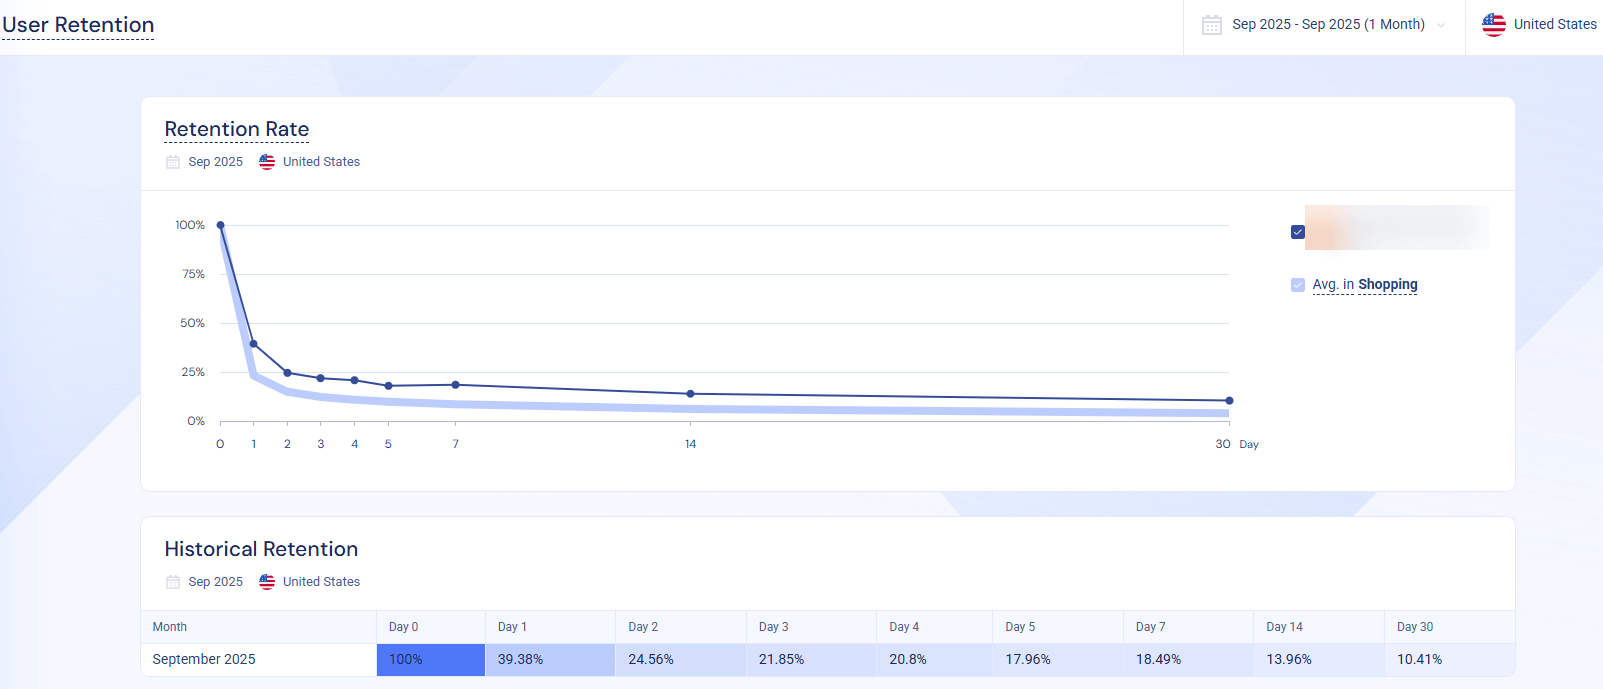
5. Analyze the trend.
- Based on this report, I see that the curve shows a typical “long-tail” retention pattern. After Day 0 (100 % by definition), about 39.4 % of users return the next day. Retention then drops sharply to 24.6 % on Day 2 and 21.9 % on Day 3. By Day 5, around 18 % of the original users remain active. Interestingly, there’s a slight uptick at Day 7 (18.49 %), which suggests weekly promotions or push-notification campaigns may re-engage lapsing shoppers. Retention continues to decline slowly thereafter, reaching 13.96 % by Day 14 and 10.41 % by Day 30.
- Category comparison: The lighter line represents the average retention for the shopping category. Across the entire 30-day period, the app (darker line) consistently outperforms the category average. For example, while the app maintains roughly 39 % of its users on Day 1, the average shopping app appears closer to the low-20 % range. By Day 30, the app retains more than 10 % of its initial users, well above the typical 5–8 % seen across many shopping apps.
- Historical retention table: The table reinforces these findings. It indicates:
- Day 1 retention (39.38 %) is relatively strong for a shopping app, suggesting the onboarding and early value proposition resonate with users.
- Week-long retention (~18 % by Day 7) hints that a core cohort of shoppers finds ongoing value in the app, possibly through gamified deals or daily rewards.
- Day 30 retention (10.41 %) is robust compared with industry benchmarks, implying that the app manages to convert a fraction of new users into loyal monthly shoppers.
Overall, the chart highlights that while the app experiences the expected steep drop-off after installation, its retention curve remains well above the category norm. The slight uptick at Day 7 and the double-digit Day 30 retention suggest effective re-engagement strategies and long-term stickiness.
Best practices for improving your long-term app retention
Here are some of the ways that organizations can improve retention for their applications over the long term.
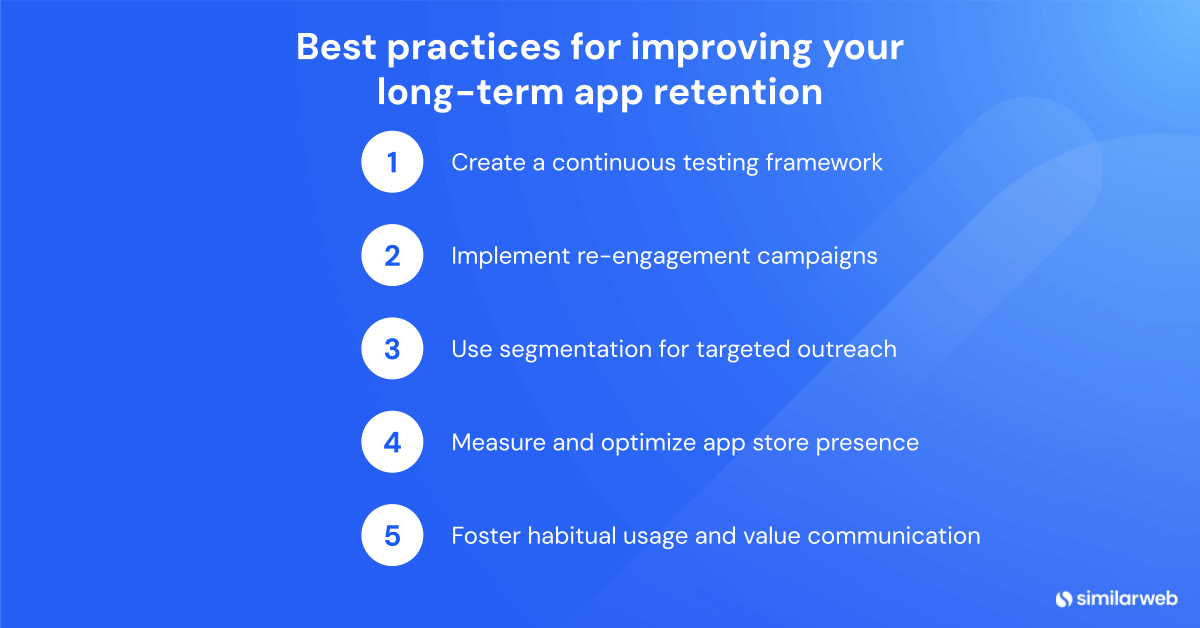
1. Create a continuous testing framework
A continuous testing framework ensures that your app is consistently checked for areas of improvement, allowing you to address issues before they lead to churn. Regular testing should be an ongoing part of the development cycle, including usability testing, performance testing, and A/B testing.
Usability testing helps identify friction points in the user experience, such as confusing navigation or inefficient workflows, which can hinder retention. Performance testing ensures that the app runs smoothly, with minimal crashes or slow load times, factors that can drive users away.
A/B testing, particularly for feature releases or UI changes, allows you to compare different versions of the app to determine which provides the best user experience and drives higher retention. Additionally, automated testing can help ensure that core features continue to function correctly after updates, reducing the risk of introducing new issues.
2. Implement re-engagement campaigns
Re-engagement campaigns are vital for addressing the problem of churn and keeping users actively involved with the app. These campaigns should be tailored to each user’s specific behavior and engagement patterns.
For example, if a user has not interacted with the app for a certain number of days or weeks, you can send a personalized push notification reminding them of the app’s value or offering an incentive to return, such as a limited-time discount or an exclusive feature. Re-engagement strategies can also include offering new content that meets a user’s interests or needs.
Data analysis can help identify the types of content, features, or promotions that users respond to best, allowing for more targeted campaigns. Beyond just notifications, re-engagement can also involve sending emails or text messages offering tutorials, updates, or new functionality. Timing is critical in re-engagement campaigns; sending reminders too soon may seem intrusive, while waiting too long might result in users forgetting about the app.
3. Use segmentation for targeted outreach
Segmentation allows you to divide your user base into meaningful groups to send tailored messages or make targeted improvements. Segmenting based on user behavior, demographics, or lifecycle stage can significantly increase the effectiveness of your retention efforts.
For example, you could group users by how often they use the app (e.g., daily, weekly, infrequent) or the features they engage with most frequently (e.g., messaging, browsing, purchasing). This enables you to create highly personalized outreach campaigns, such as offering special promotions to high-value users, or reminding inactive users of features they previously engaged with.
Another common segmentation technique is based on acquisition channels: users who came from paid ads might need a different message compared to those who signed up organically. You can also segment based on geographical location, allowing for region-specific promotions or offers.
4. Measure and optimize app store presence
The app store serves as the gateway to your app, and its optimization is crucial for both attracting new users and retaining existing ones. A well-optimized app store presence can encourage downloads while reinforcing the app’s value for current users. Start by ensuring that your app’s description is clear, concise, and highlights the core value proposition.
Use keywords strategically to ensure the app is discoverable when users search for relevant terms. In addition, regularly update the app’s screenshots and videos to showcase new features, updates, or seasonal content. This keeps the app store page fresh and encourages users to check back for improvements.
Encourage users to leave reviews and ratings, as high ratings and positive reviews can increase trust and attract more potential users. Responding to user reviews, especially addressing concerns and bugs, shows that you’re actively listening to feedback and improving the app. This level of engagement can also improve user satisfaction and loyalty.
5. Foster habitual usage and value communication
Building an app that users rely on daily is key to improving retention. This requires creating features or content that users can integrate into their regular routines. For instance, apps with daily goals, reminders, or progress tracking foster habitual use, encouraging users to return frequently.
Incorporating features like daily challenges, streaks, or daily login rewards can nudge users to engage every day. Another important aspect is constantly communicating the value the app offers. Regularly sending push notifications or in-app messages that highlight new features, accomplishments, or benefits ensures that users remember the app’s value.
Also, incorporating elements like progress bars, milestones, or achievements gives users a sense of accomplishment, which keeps them coming back. Consistently providing new content or features (e.g., daily news, updates, or offers) adds to the app’s perceived value. Regularly showcasing why the app is worth using will help maintain a high retention rate, as users will continue to see the app as beneficial and integral to their lives.
Boosting app retention with Similarweb
Retention is the clearest signal that your app delivers repeatable value. Watching Day 1, Day 7, and Day 30 behavior reveals where users fall off and which experiences pull them back in. Similarweb can help you identify vital signals that can help improve retention during this critical period.
Improving app retention requires disciplined execution: Fast onboarding, clean UX, relevant messaging, and continuous testing. Small lifts across these areas stack into meaningful gains.
Treat retention as a system, not a campaign. Segment users, measure cohort outcomes, and iterate frequently. The compounding effect of better retention can improve your app’s profitability and improve the ROI of acquisition efforts.
FAQs
Why is app retention important?
Retention shows whether users find lasting value in your app. Higher retention lowers acquisition waste and increases lifetime revenue.
How do you calculate app retention?
Pick a cohort (e.g., users who installed this week) and measure the percentage who return on specific days, commonly Day 1, Day 7, and Day 30.
What is a good retention rate?
Benchmarks vary by category, but a rough target is ~30-40% Day 1, ~15-25% Day 7, and ~5-15% Day 30. Use your own historical cohorts as the primary baseline.
How can you improve retention quickly?
Tighten onboarding to first value, fix top crash/latency issues, clarify navigation, and send behavior-based nudges that bring users back to unfinished actions.
What’s the relationship between retention and LTV?
Better retention increases session count and conversion opportunities, which raises average revenue per user and, ultimately, lifetime value.
How do push notifications affect app retention rates?
Push notifications can significantly improve app retention when they are timely, relevant, and personalized. They help re-engage users by reminding them of valuable features, offers, or unfinished actions. However, excessive or generic notifications can lead to opt-outs or uninstalls, so it’s important to segment users and tailor messages strategically.
What factors cause low app retention rates?
Low retention is often driven by friction in onboarding, poor UI/UX, slow performance, irrelevant notifications, or a weak value proposition. Other common causes include lack of personalization, aggressive ads, and early feature overload. Analyzing churn patterns and user behavior helps pinpoint the exact drop-off moments.
Is app retention different for iOS and Android?
Yes. Industry benchmarks consistently show that iOS apps tend to have higher retention than Android apps. This gap is often attributed to differences in device performance, user demographics, and ecosystem stability. When benchmarking, always compare retention within the same platform and category for the most accurate insights.
How often should you measure app retention?
Retention should be monitored continuously, ideally weekly for short-term metrics (Day 1 and Day 7) and monthly or quarterly for long-term trends (Day 30+). Frequent analysis helps detect sudden drops caused by bugs, UX changes, or marketing shifts, allowing teams to diagnose issues early and optimize faster.

Related Posts


Wondering what Similarweb can do for your business?
Give it a try or talk to our insights team — don’t worry, it’s free!