




by Darrell Mordecai4 Min.
Oct 21, 2026

This is the first edition of a series of blog posts we’ll use Similarweb’s Retail Intelligence to update twice a year – once for H1 and once for H2 2026 – tracking which of America’s biggest retailers are gaining (and losing) share across six categories that make up the bulk of US ecommerce: Electronics, Pet Care, Clothing, Shoes & Jewelry, Home & Kitchen, Sports & Outdoors, and Toys & Games.
Market share here refers to visit share among major US retailers tracked in each category, not GMV, so think of it as where shoppers are spending their attention, not necessarily where the most revenue is being generated.
Amazon is the largest retailer in the US by shopper visits, leading every major category we track, from electronics to toys. But the story changes fast once you look past Amazon: Chewy dominates pet care, Gap and Quince lead apparel, Wayfair leads home goods, and Dick’s Sporting Goods leads sports gear.
Three themes show up across almost every category, so they’re worth calling out up front:
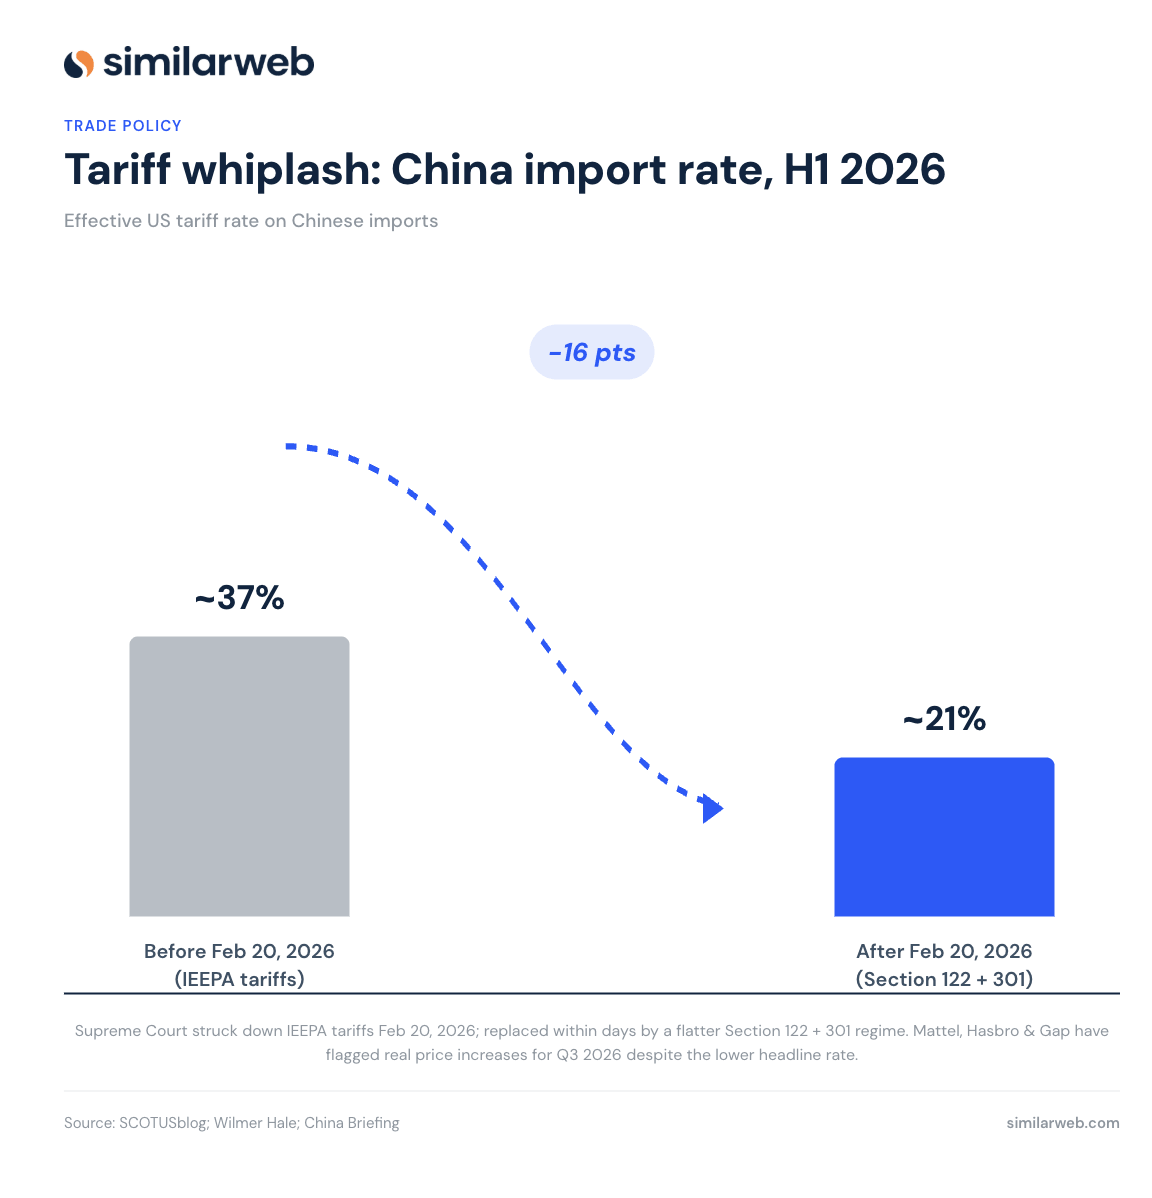
The IEEPA tariffs that shaped 2025 pricing were struck down by the Supreme Court on February 20, 2026, and replaced within days by a flatter 10% global Section 122 tariff plus targeted Section 301 duties.
That cut the effective China rate from roughly 37% to about 21%. Retailers spent most of H1 absorbing the policy whiplash rather than immediately passing costs on to consumers, with several – including Mattel, Hasbro, and Gap – pushing meaningful price increases into Q3.
Amazon retired Rufus on May 13 and replaced it with Alexa for Shopping, an agent that can automatically purchase items once they hit a target price. OpenAI’s ChatGPT Instant Checkout, meanwhile, never gained much traction: only around 30 Shopify merchants were live by February, at a fraction of expected conversion rates, before OpenAI quietly shifted back toward outbound links in March.
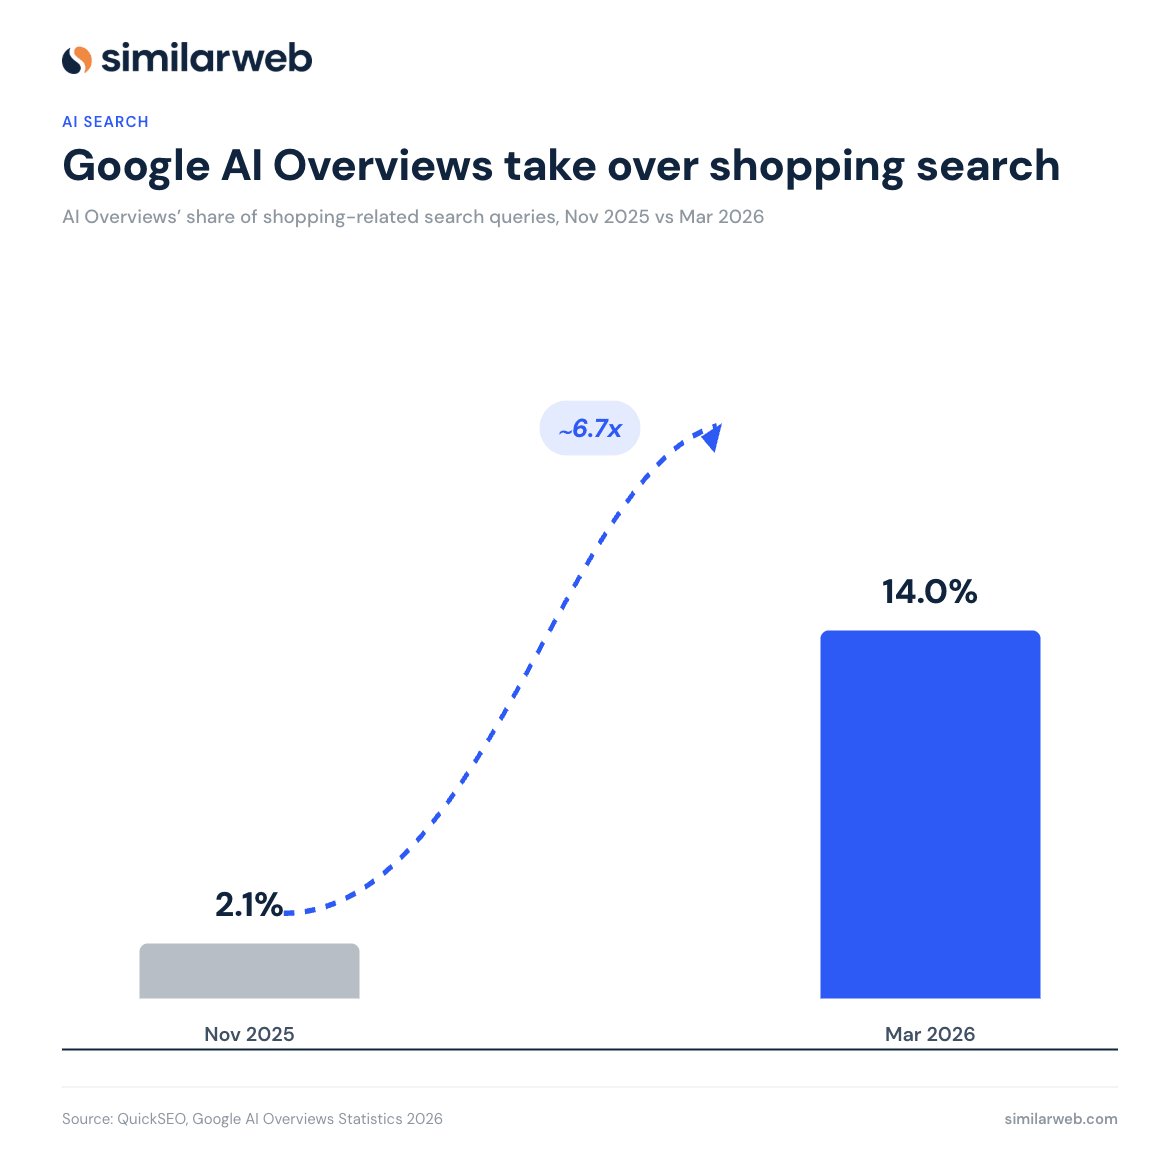
At the same time, Google’s AI Overviews expanded from 2.1% to 14% of shopping queries between November 2025 and March 2026, reshaping how shoppers discover products before they ever reach a retailer.
As America’s largest retailer, Amazon’s overall share of US e-commerce has been roughly flat (around 35.7%, down from its 2021 peak of 41.8%), even as revenue continues to grow. That means H1 share gains increasingly came from specialists like Chewy, Quince, and Dick’s Sporting Goods rather than another broad-based Amazon expansion.
The chart below makes that specialist story concrete – among the #2 retailers in each category, the strongest performers (Chewy, Gap, Wayfair) are pure-play specialists, not generalists chasing Amazon:
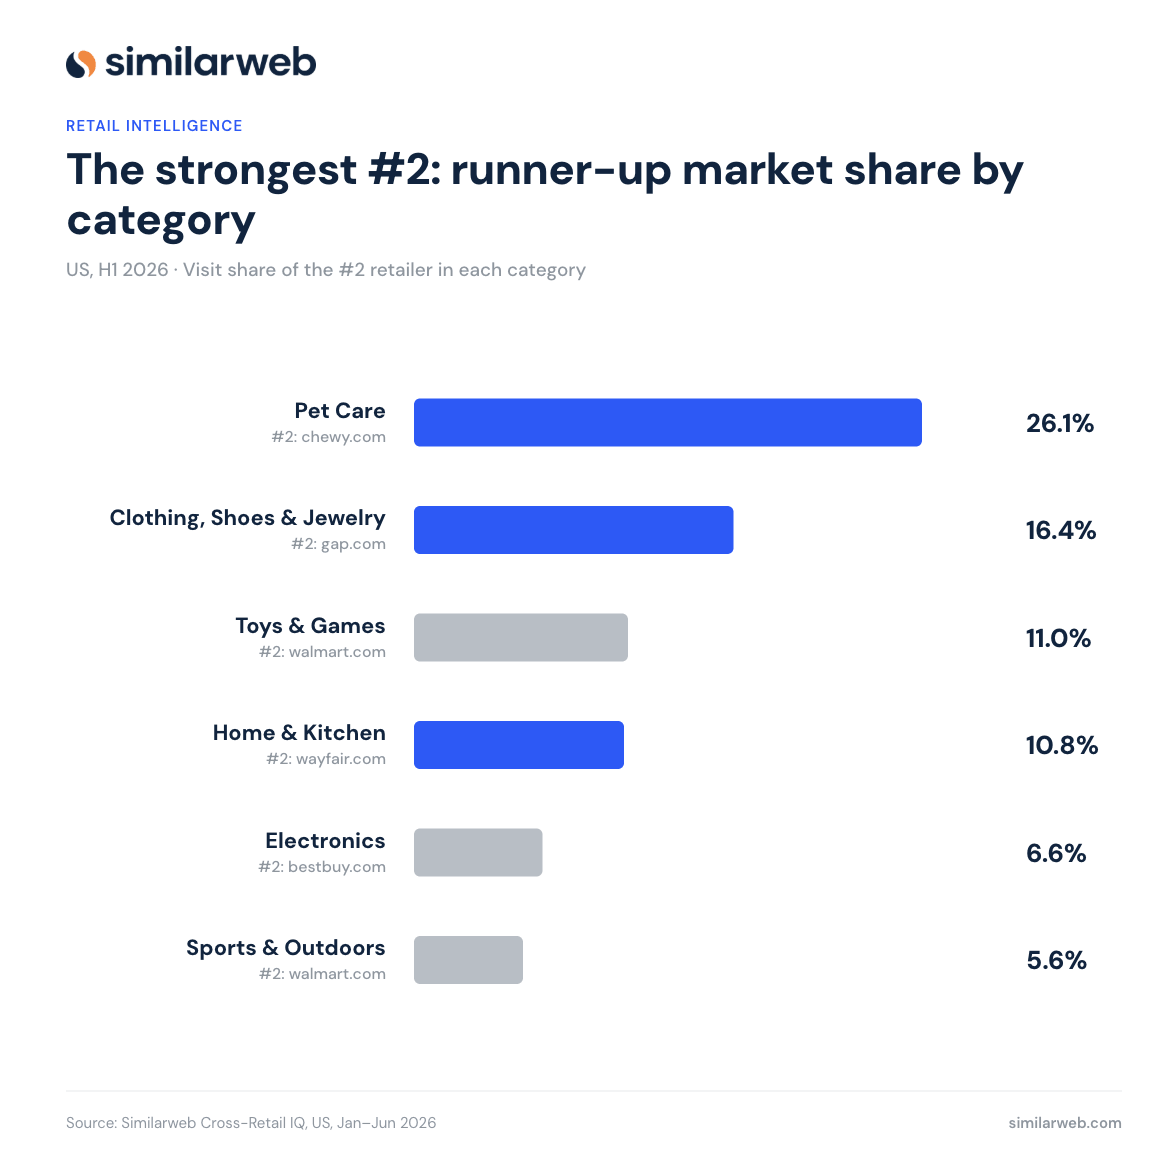
Here’s who came on top within each category.
None of the retailers on that list are trying to become the next Amazon. Chewy owns pet care, Gap owns its namesake apparel niche, Wayfair owns home, each is building toward being the default destination for a single category rather than chasing Amazon’s breadth. That’s arguably the more durable growth path for a challenger: becoming the brand a category’s shoppers reach for by default, rather than trying to match Amazon on assortment.
US, Desktop and Mobile Web, Jan-Jun 2026
| Rank | Retailer | Market Share | Top 5 Brands | Fastest-Growing Subcategories |
| 1 | amazon.com | 76.4% | Apple, Samsung, ASUS, Amazon Renewed, Anker | eBook Readers (-0.1%), Portable Audio & Video (-7.1%), GPS & Finders (-7.1%) |
| 2 | bestbuy.com | 6.6% | Apple, Samsung, ASUS, Lenovo, HP | Accessories & Supplies (+74.8%), Wearable Technology (+57.3%), Cell Phones & Accessories (+32.8%) |
| 3 | walmart.com | 5.0% | Apple, onn., Samsung, HP, ASUS | GPS & Finders (+35.1%), Accessories & Supplies (+25.6%), Car & Vehicle Electronics (+3.2%) |
| 4 | t-mobile.com | 1.8% | Apple, Samsung, Google, Motorola, T-Mobile | Portable Audio & Video (+90.4%), Television & Video (+54.6%), Camera & Photo (+19.6%) |
| 5 | newegg.com | 1.3% | No Brand, MSI, ASUS, Gigabyte, ASRock | Electronics Warranties (+338.5%), Accessories & Supplies (+105.3%), GPS & Finders (+82.3%) |
Amazon’s lead among top US electronics retailers is almost a market-structure fact at this point. The more interesting story is Best Buy.
In June 2026, Best Buy began rolling out its new Meta Lab store-in-store experiences – 900-square-foot spaces dedicated to Ray-Ban Meta glasses, Meta displays, and Quest headsets – to more than 50 locations. At almost the same time, Samsung’s Galaxy S26 launch on February 25 drove shoppers into stores for new phones, with accessories riding along.
Just as notably, Best Buy chose not to build its own AI shopping assistant. Instead, it plugged its catalog directly into ChatGPT and Google’s AI Mode, effectively outsourcing product discovery to whichever assistant the customer already uses. That’s a very different strategy from Amazon’s attempt to own the entire shopping journey.
Newegg tells almost the opposite story. Overall sales were down nearly 12% year over year, yet warranty attach rates surged 338%. That’s a retailer leaning harder on higher-margin services as hardware demand softens. It’s worth watching whether this becomes a durable shift or simply a temporary response to weaker PC and component sales.
Tariffs remain the quiet pressure on the entire category. Effective China electronics duties still sit around 35% after the IEEPA ruling, and Best Buy’s CFO has already pointed to roughly a one-point sales headwind tied to the February tariff changes, with around 60% of the company’s cost of goods still flowing through China.
US, Desktop and Mobile Web, Jan-Jun 2026
| Rank | Retailer | Market Share | Top 5 Brands | Fastest-Growing Subcategories |
| 1 | amazon.com | 55.3% | Amazon Basics, Generic, Blue Buffalo, PetSafe, Friskies | Reptiles & Amphibians (+0.4%), Cats (-3.1%), Fish & Aquatic Pets (-6.1%) |
| 2 | chewy.com | 26.1% | Frisco, Purina Pro Plan, Fancy Feast, Hill’s Prescription Diet, Blue Buffalo | Reptiles & Amphibians (+27.9%), Cats (-11.5%), Horses (-22.9%) |
| 3 | walmart.com | 6.3% | Vibrant Life, Friskies, Special Kitty, Fancy Feast, Ol’ Roy | Reptiles & Amphibians (+27.5%), Cats (-16.4%), Dogs (-22.3%) |
| 4 | petco.com | 4.7% | Petco, Imagitarium, Purina Pro Plan, EveryYay, Aqueon | Small Animals (-0.3%), Reptiles & Amphibians (+1.6%), Dogs (-11.1%) |
| 5 | tractorsupply.com | ~1.9% | No Brand, Retriever, Tractor Supply, Purina, Spectra | Cats (+54.1%), Reptiles & Amphibians (+51.4%), Dogs (+33.0%) |
The headline here isn’t the ranking – it’s that almost every major retailer is seeing shrinking subcategories, with one notable exception.
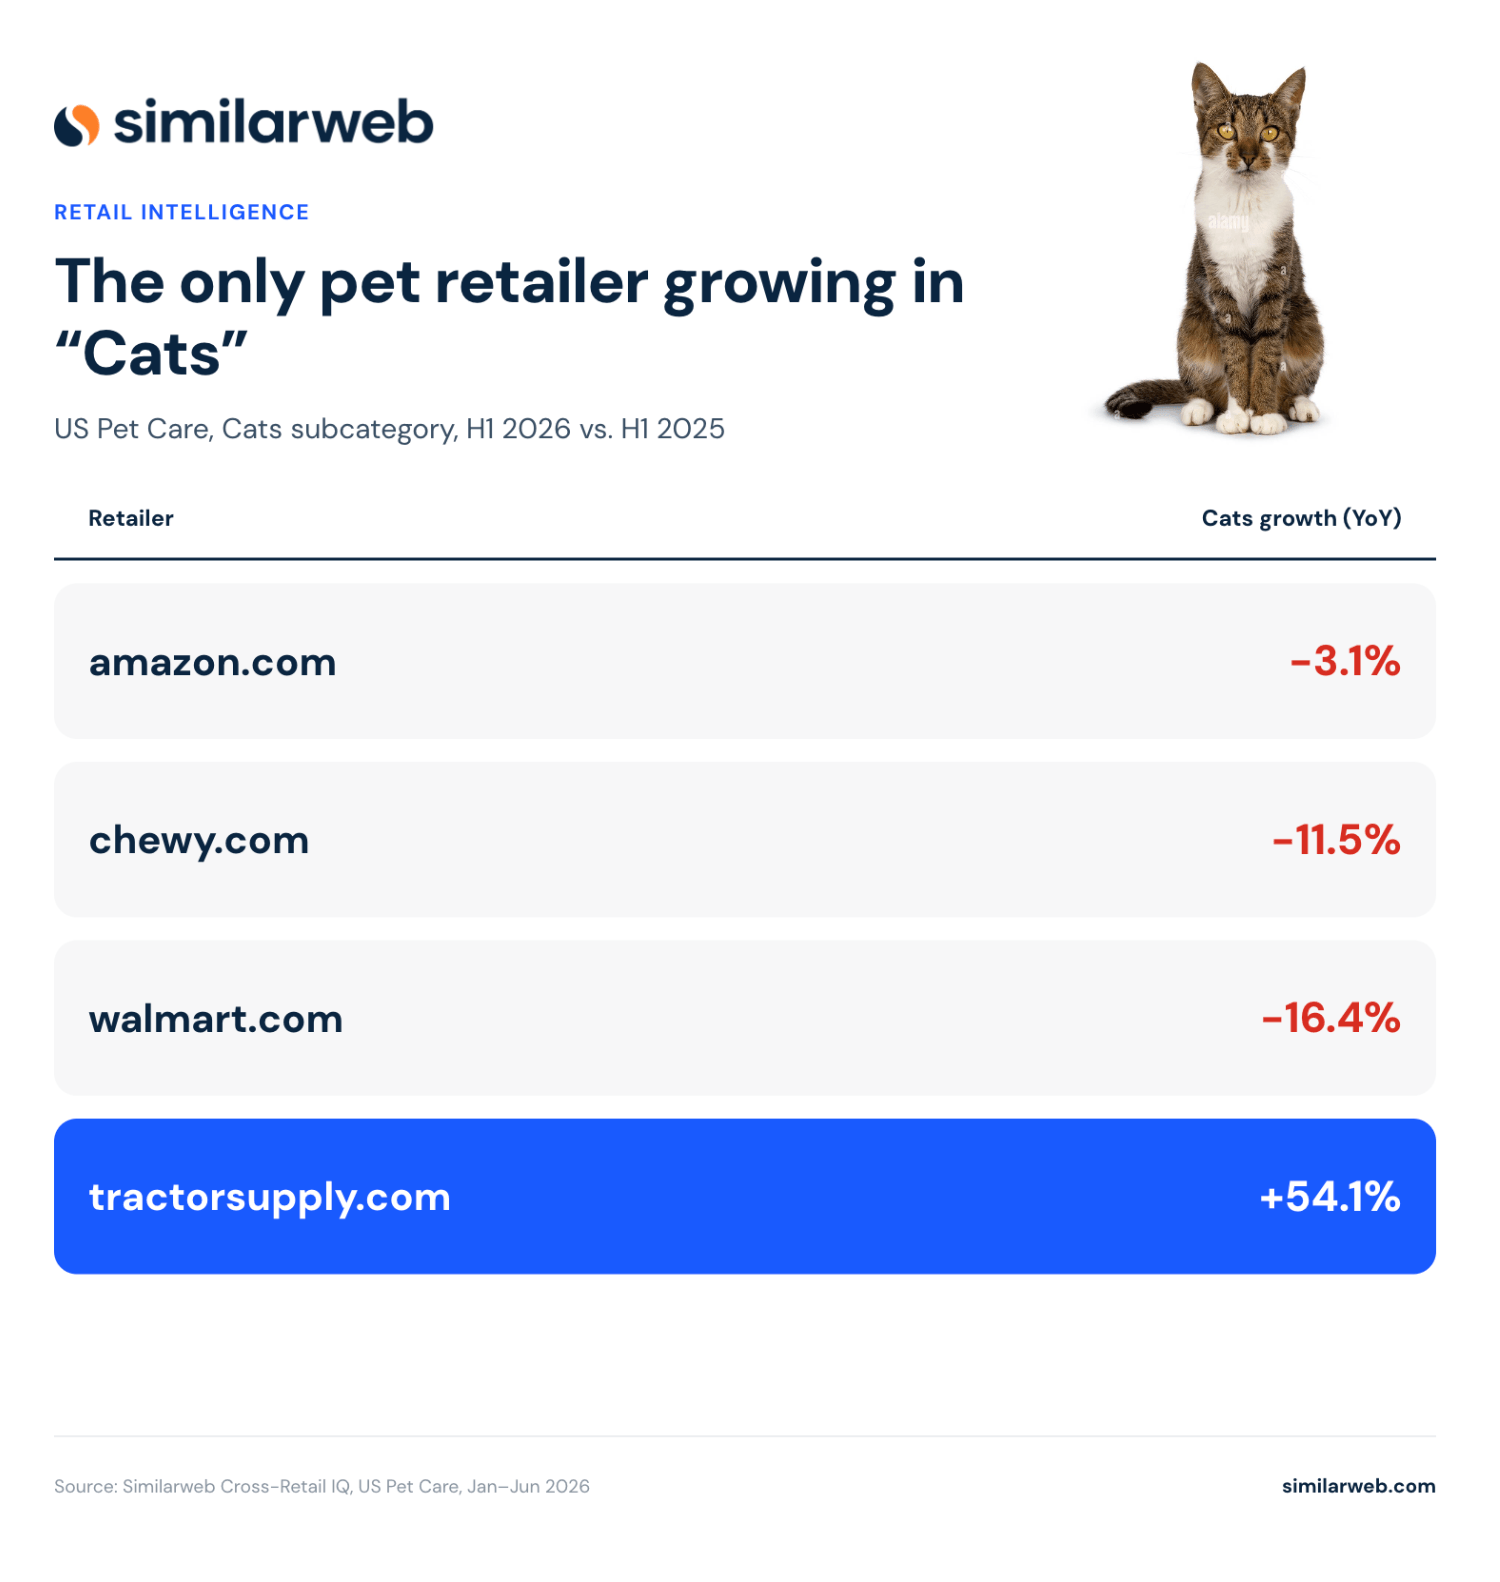
The divergence is stark. Amazon, Chewy, Walmart, and Petco are each seeing softness in at least one major pet subcategory, while Tractor Supply – still just ~1.9% of the category – is growing across nearly all of them.
Management attributed much of that momentum to triple-digit growth in online pet subscriptions, layered on top of an expanded Neighbor’s Club loyalty program that now spans both Tractor Supply and PetSense. In a category where nearly everyone else is flat or declining, Tractor Supply’s loyalty-driven subscription model is setting it apart.
Chewy remains the clear No. 2, but it’s widening the gap through services rather than selection alone. Autoship now accounts for 84% of net sales, and the company announced plans to acquire veterinary network Modern Animal, more than doubling its clinic footprint. At the same time, Chewy consolidated its growing collection of private-label brands under a single Chewy Made umbrella.
The company increasingly looks less like an online pet retailer and more like a vertically integrated pet healthcare platform.
Petco, meanwhile, is still very much in turnaround mode. It completed a debt refinancing in February, plans to close another 15-20 stores this year, and revived its longtime “Where the Pets Go” branding in an effort to rebuild customer affinity. While bankruptcy speculation continues to surface, most analysts still view that outcome as unlikely in the near term.
One broader trend is worth watching. Pet food and treats carry roughly 37% tariff exposure, with an estimated 90% of those added costs eventually passed on to consumers. That puts more pressure on private-label-heavy assortments like Amazon Basics, Walmart’s Vibrant Life, and Petco’s house brands than on Chewy’s branded, Autoship-driven business, which may help explain why Chewy has held share while several private-label-focused competitors have not.
US, Desktop and Mobile Web, Jan-Jun 2026
| Rank | Retailer | Market Share | Top 5 Brands | Fastest-Growing Subcategories |
| 1 | amazon.com | 41.9% | Amazon Essentials, adidas, Hanes, Generic, Skechers | Sport Specific Clothing (+26.0%), Costumes & Accessories (+18.2%), Women (+6.2%) |
| 2 | gap.com | 16.4% | Old Navy, Gap, Athleta, Banana Republic, No Brand | Sport Specific Clothing (+infinity%), “Westlake” (+254.0%), Men (+84.1%) |
| 3 | macys.com | 4.9% | Polo Ralph Lauren, Calvin Klein, DKNY, Style, Tommy Hilfiger | Baby (+39.9%), Costumes & Accessories (+29.1%), Sport Specific Clothing (+20.7%) |
| 4 | quince.com | 4.3% | Quince (99.6% of dept.) | Costumes & Accessories (+infinity%), Swimwear (+102.7%), Men (+108.4%) |
| 5 | walmart.com | 3.9% | No Boundaries, Time and Tru, Wonder Nation, George, Athletic Works | “Westlake” (+322.7%), Swimwear (+19.8%), Sport Specific Clothing (+165.0%) |
Fashion turned into a tale of two retailers inside Gap Inc., and it’s a useful lens for understanding this category’s largest apparel retailers more broadly.
The Gap namesake brand posted a standout first quarter, with comparable sales up 10% and comfortably ahead of expectations. Old Navy – the much larger brand that drives Gap.com’s overall traffic – had a far less successful season, delivering just 1% comparable growth against a 3% target. CEO Richard Dickson pointed directly to weak spring and summer assortments, particularly dresses and swim shorts.
That same swimwear season became Quince’s breakout story. Swimwear traffic surged more than 100% – roughly 5 times Walmart’s swimwear growth rate – fueled by a $500 million Series E that lifted the company’s valuation to $10.1 billion and helped fund its first international expansion into Canada in January 2026.
Two retailers were competing for the same seasonal shopping dollars. One clearly captured demand, while the other missed it – and Similarweb’s traffic data shows where many of those shoppers ended up.
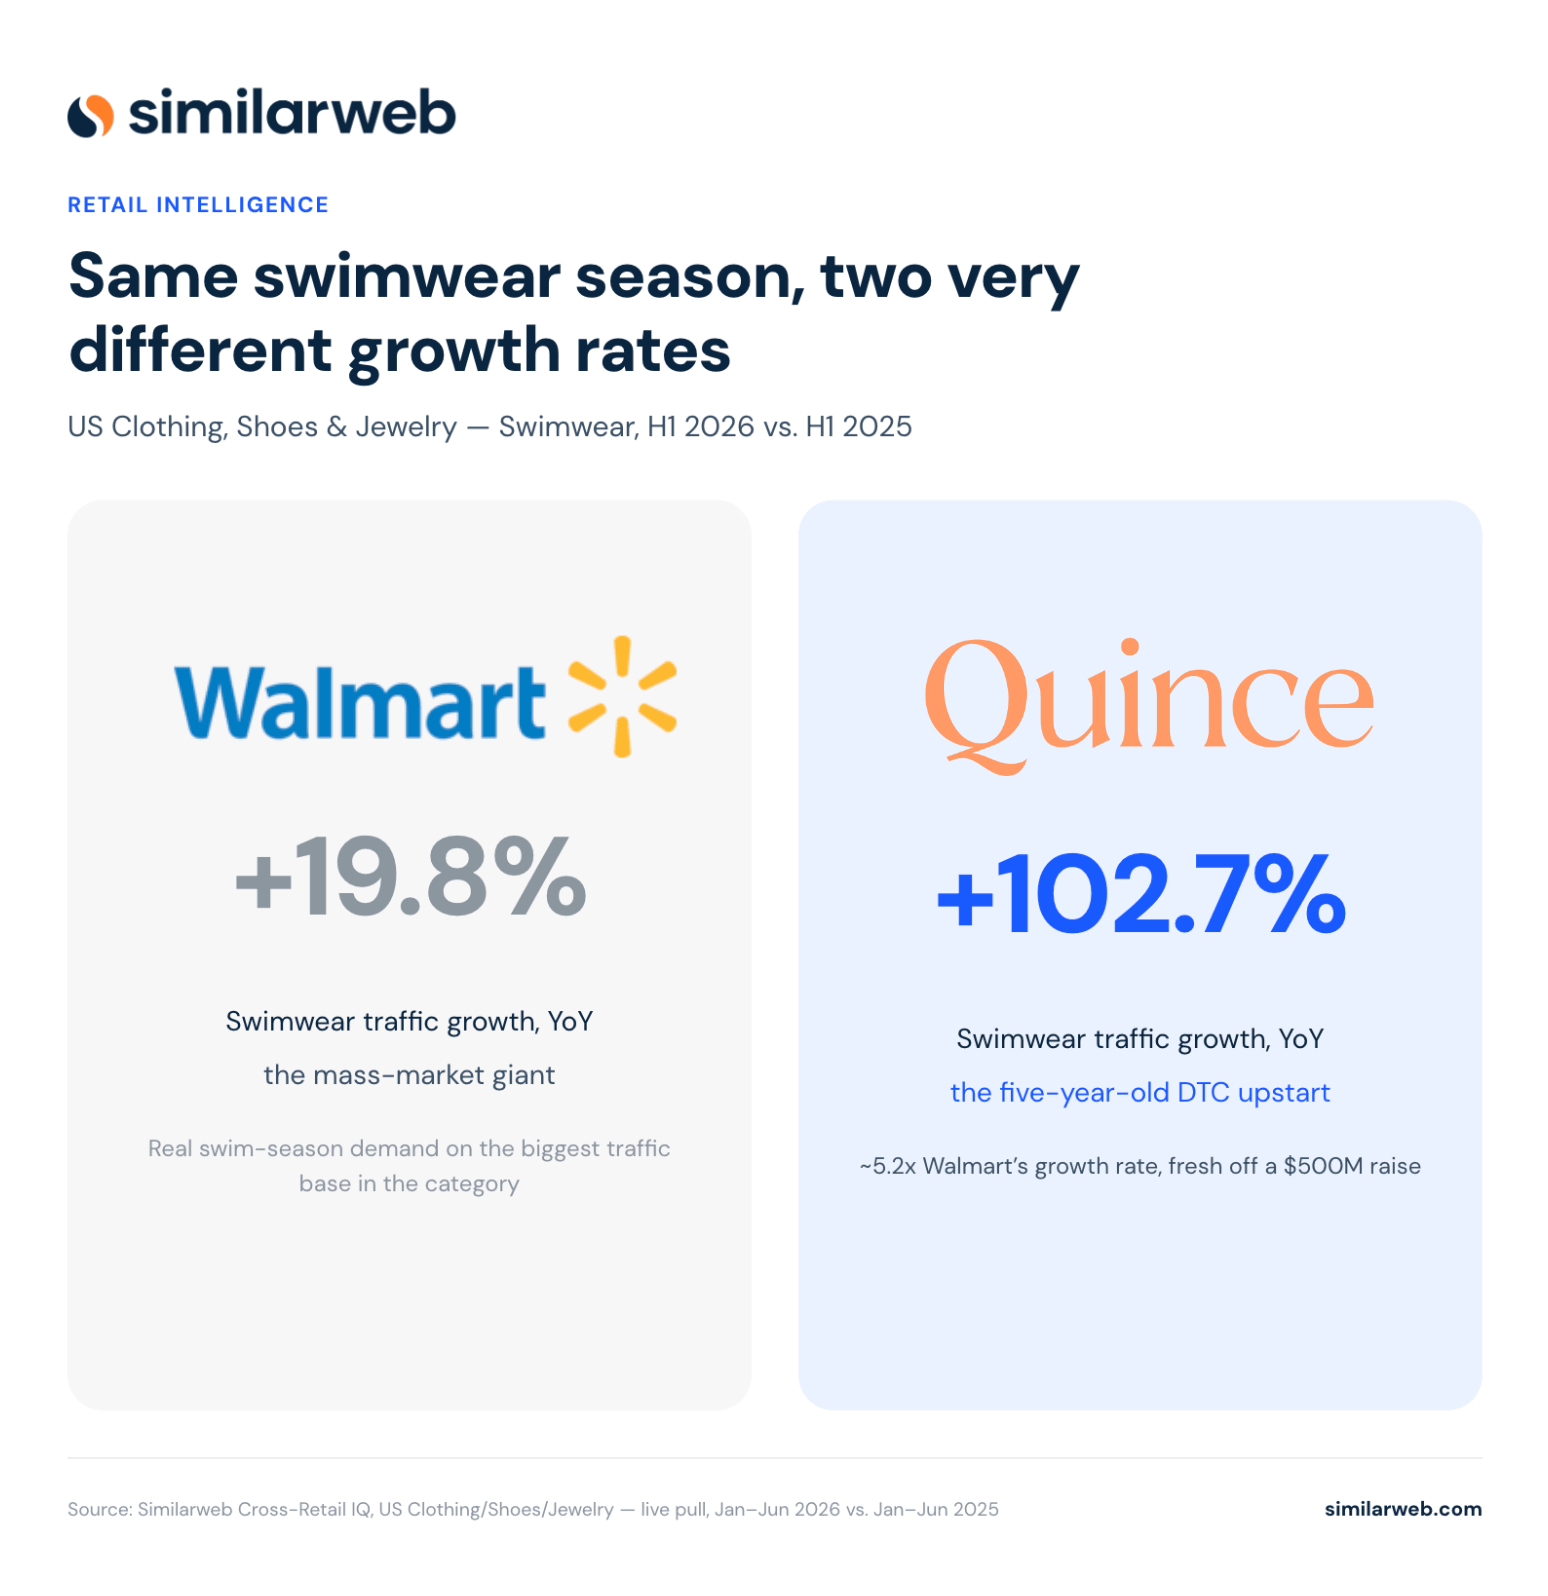
Walmart’s swimwear traffic grew 19.8% in H1, a healthy number on the category’s largest traffic base. Quince, the five-year-old direct-to-consumer upstart, grew swimwear traffic 102.7% over the same stretch – more than five times Walmart’s rate – backed by a $500 million raise that valued the company at $10.1 billion and funded its first international launch, in Canada. Scale didn’t decide the winner in swimwear this season; assortment optimization did.
Macy’s increasingly looks like a turnaround story rather than a decline story. The company is now roughly 80% through its plan to close 150 stores, and remodeled locations under its Reimagine strategy continue to outperform the rest of the fleet. Its emphasis on premium national brands like Polo Ralph Lauren, Calvin Klein, and Tommy Hilfiger also gives it a clearer point of differentiation against Amazon’s much broader assortment.
Gap has also emerged as one of the apparel retailers moving most aggressively into AI commerce. The company announced plans to support checkout directly within Google’s Gemini alongside AI-powered fit tools, making it one of the first major fashion retailers willing to let transactions happen inside someone else’s AI interface rather than insisting shoppers visit its own website.
US, Desktop and Mobile Web, Jan-Jun 2026
| Rank | Retailer | Market Share | Top 5 Brands | Fastest-Growing Subcategories |
| 1 | amazon.com | 58.0% | Amazon Basics, Generic, Bedsure, Levoit, Owala | Event & Party Supplies (+19.6%), Seasonal Décor (+0.5%), Home Décor (-2.7%) |
| 2 | wayfair.com | 10.8% | Latitude Run, Ebern Designs, Wade Logan, George Oliver, Lark Manor | Irons & Steamers (+48.9%), Storage & Organization (+27.1%), Seasonal Décor (+23.9%) |
| 3 | walmart.com | 7.2% | Mainstays, Better Homes & Gardens, Sterilite, No Brand, Beautiful | Event & Party Supplies (+45.3%), Seasonal Décor (+35.7%), Wall Art (+1.5%) |
| 4 | target.com | 3.4% | Threshold, Brightroom, Room Essentials, Casaluna, Hearth & Hand | Wall Art (+45.6%), Event & Party Supplies (+40.1%), Vacuums & Floor Care (+28.3%) |
| 5 | homedepot.com | 3.1% | Hampton Bay, Home Decorators Collection, HDX, No Brand, Harper & Bright | Wall Art (+40.1%), Event & Party Supplies (+29.2%), Seasonal Décor (+13.3%) |
Wayfair’s No. 2 position reflects a genuine financial inflection point.
FY2025 marked the company’s first-ever year of positive operating income, while Q1 2026 delivered its strongest first-quarter adjusted EBITDA margin (5.2%) in five years, alongside a return to active customer growth. Those financial improvements are backed by real operational investments, not just cost-cutting. Wayfair Rewards expanded into Canada in March, and its CastleGate logistics network now offers consolidated shipping for both small and large items.
The growth here looks earned, not simply recycled traffic.
Target is the retailer to watch in this category. Despite the strength of its overall brand, its 3.4% market share suggests it has room to grow online. That comes during an unusually turbulent year for the company: a CEO transition saw Michael Fiddelke replace Brian Cornell on February 1, while an ongoing consumer boycott debate continued to generate headlines, even as organizers disagreed on whether the campaign had effectively ended.
Still, strong growth in Wall Art and Vacuums & Floor Care looks more like pockets of momentum than a broad-based recovery.
The broader category trend is easier to explain. Event & Party Supplies and Seasonal Décor grew across nearly every major retailer, reflecting a calendar packed with Mother’s Day, graduation season, Memorial Day, and early summer entertainment. Sometimes the simplest explanation really is the right one.
US, Desktop and Mobile Web, Jan-Jun 2026
| Rank | Retailer | Market Share | Top 5 Brands | Fastest-Growing Subcategories |
| 1 | amazon.com | 64.3% | Generic, adidas, CAP Barbell, Owala, Amazon Basics | Water Sports (+264.3%), Fan Shop (+18.1%), Sports & Fitness (-7.9%) |
| 2 | walmart.com | 5.6% | Ozark Trail, Athletic Works, Fantaslook, BalanceFrom, CAP | Water Sports (+562.3%), Fan Shop (+25.3%), Sports & Fitness (+6.4%) |
| 3 | dickssportinggoods.com | 4.6% | Nike, adidas, DSG, Under Armour, Patagonia | Fan Shop (+121.8%), Water Sports (+35.9%), Outdoor Recreation (-0.3%) |
| 4 | rei.com | 4.1% | REI Co-op, Black Diamond, Patagonia, Nemo, Osprey | Fan Shop (+11.6%), Outdoor Recreation (+8.0%), Clothing (+6.8%) |
| 5 | anthropologie.com | 3.6% | Saucony (95.9% of dept.), Mare Mare, Anthropologie, Daily Practice, Pilcro | Water Sports (+115.5%), Sports & Fitness (+92.5%), Clothing (+82.6%) |
There are two real stories here, and one likely data artifact.
The biggest business story belongs to Dick’s Sporting Goods. Following its $2.4 billion acquisition of Foot Locker in September 2025, H1 2026 is the first period where the combined company’s performance shows up cleanly in the data. Q1 net sales jumped 62.7% year over year, while the company rolled out its Fast Break remodel program across 250 Foot Locker, Champs, and Kids Foot Locker locations. The remodeled stores expanded sneaker displays and licensed merchandise just ahead of the back-to-school season, helping explain the category’s 121.8% growth in Fan Shop.
The second story is much broader. The 2026 FIFA World Cup, running from June 11 through July 19 across the United States, Canada, and Mexico, created a powerful tailwind for licensed merchandise. Fanatics, the tournament’s exclusive on-site retailer, projects roughly $5 billion in merchandise sales, making simultaneous Fan Shop growth at Amazon, Walmart, and Dick’s look far less like coincidence.
Then there’s Anthropologie. Its appearance at No. 5, with Saucony accounting for nearly 96% of department brand share, is almost certainly a taxonomy quirk rather than evidence of a major athletic apparel strategy. We looked for a Saucony collaboration or dedicated running category at Anthropologie and found none. Its primary footwear partnership remains Gola.
The more likely explanation is that Similarweb’s Sports & Outdoors classification captures only a narrow slice of Anthropologie’s overall assortment. Within that relatively small universe, Saucony simply happens to dominate.
Rather than smoothing over the anomaly, we’re calling it out. Good data analysis acknowledges the outliers as well as the patterns.
US, Desktop and Mobile Web, Jan-Jun 2026
| Rank | Retailer | Market Share | Top 5 Brands | Fastest-Growing Subcategories |
| 1 | amazon.com | 72.2% | LEGO, Pokémon, Amazon Renewed, Funko, Magic: The Gathering | STEM Toys (+2,348%), Action Figures (+304.9%), Novelty & Gag Toys (+47.3%) |
| 2 | walmart.com | 11.0% | Pokémon (23.3% of dept.), LEGO, NeeDoh, Barbie, Disney | STEM Toys (+674%), Action Figures (+573.7%), Novelty & Gag Toys (+197.0%) |
| 3 | target.com | 10.0% | Pokémon (49.7% of dept.), LEGO, NeeDoh, BTS, Gigglescape | Novelty & Gag Toys (+821.1%), Learning & Education (+172.1%), Action Figures (+160.0%) |
| 4 | bestbuy.com | 1.4% | Pokémon (55.2% of dept.), Riftbound, Wizards of the Coast, LEGO, Bandai | Baby & Toddler Toys (+infinity%), STEM Toys (+32,975%), Arts & Crafts (+2,400.5%) |
| 5 | macys.com | 0.6% | Pokémon (51.9% of dept.), LEGO, Barbie, Geoffrey’s Toy Box, Disney | STEM Toys (+500%), Collectible Toys (+174.4%), Action Figures (+169.7%) |
Collectibles continue to outperform traditional toy demand.
Pokémon’s remarkable brand share, more than 50% at Target, Best Buy, and Macy’s, reflects a trading-card boom that still hasn’t cooled. The Pokémon Company printed roughly 10 billion cards between March 2025 and March 2026 and still struggled to meet demand. Prices have climbed roughly 1,350% since 2020, prompting both manufacturers and retailers to introduce ID-based purchase limits to slow bots and scalpers.
Best Buy’s STEM Toys growth of nearly 33,000% looks unbelievable until you look at what’s actually selling. Before including a number that large, we pulled the underlying brands driving the category, expecting to find a miscategorized trading card game or a fluke SKU skewing the average. Instead, the growth held up: PicassoTiles magnetic building sets are now the category’s largest brand on bestbuy.com by a wide margin, followed by LEGO’s Technic and Ideas lines and MEGA BLOKS construction sets, genuine STEM and construction toys, not a classification artifact.
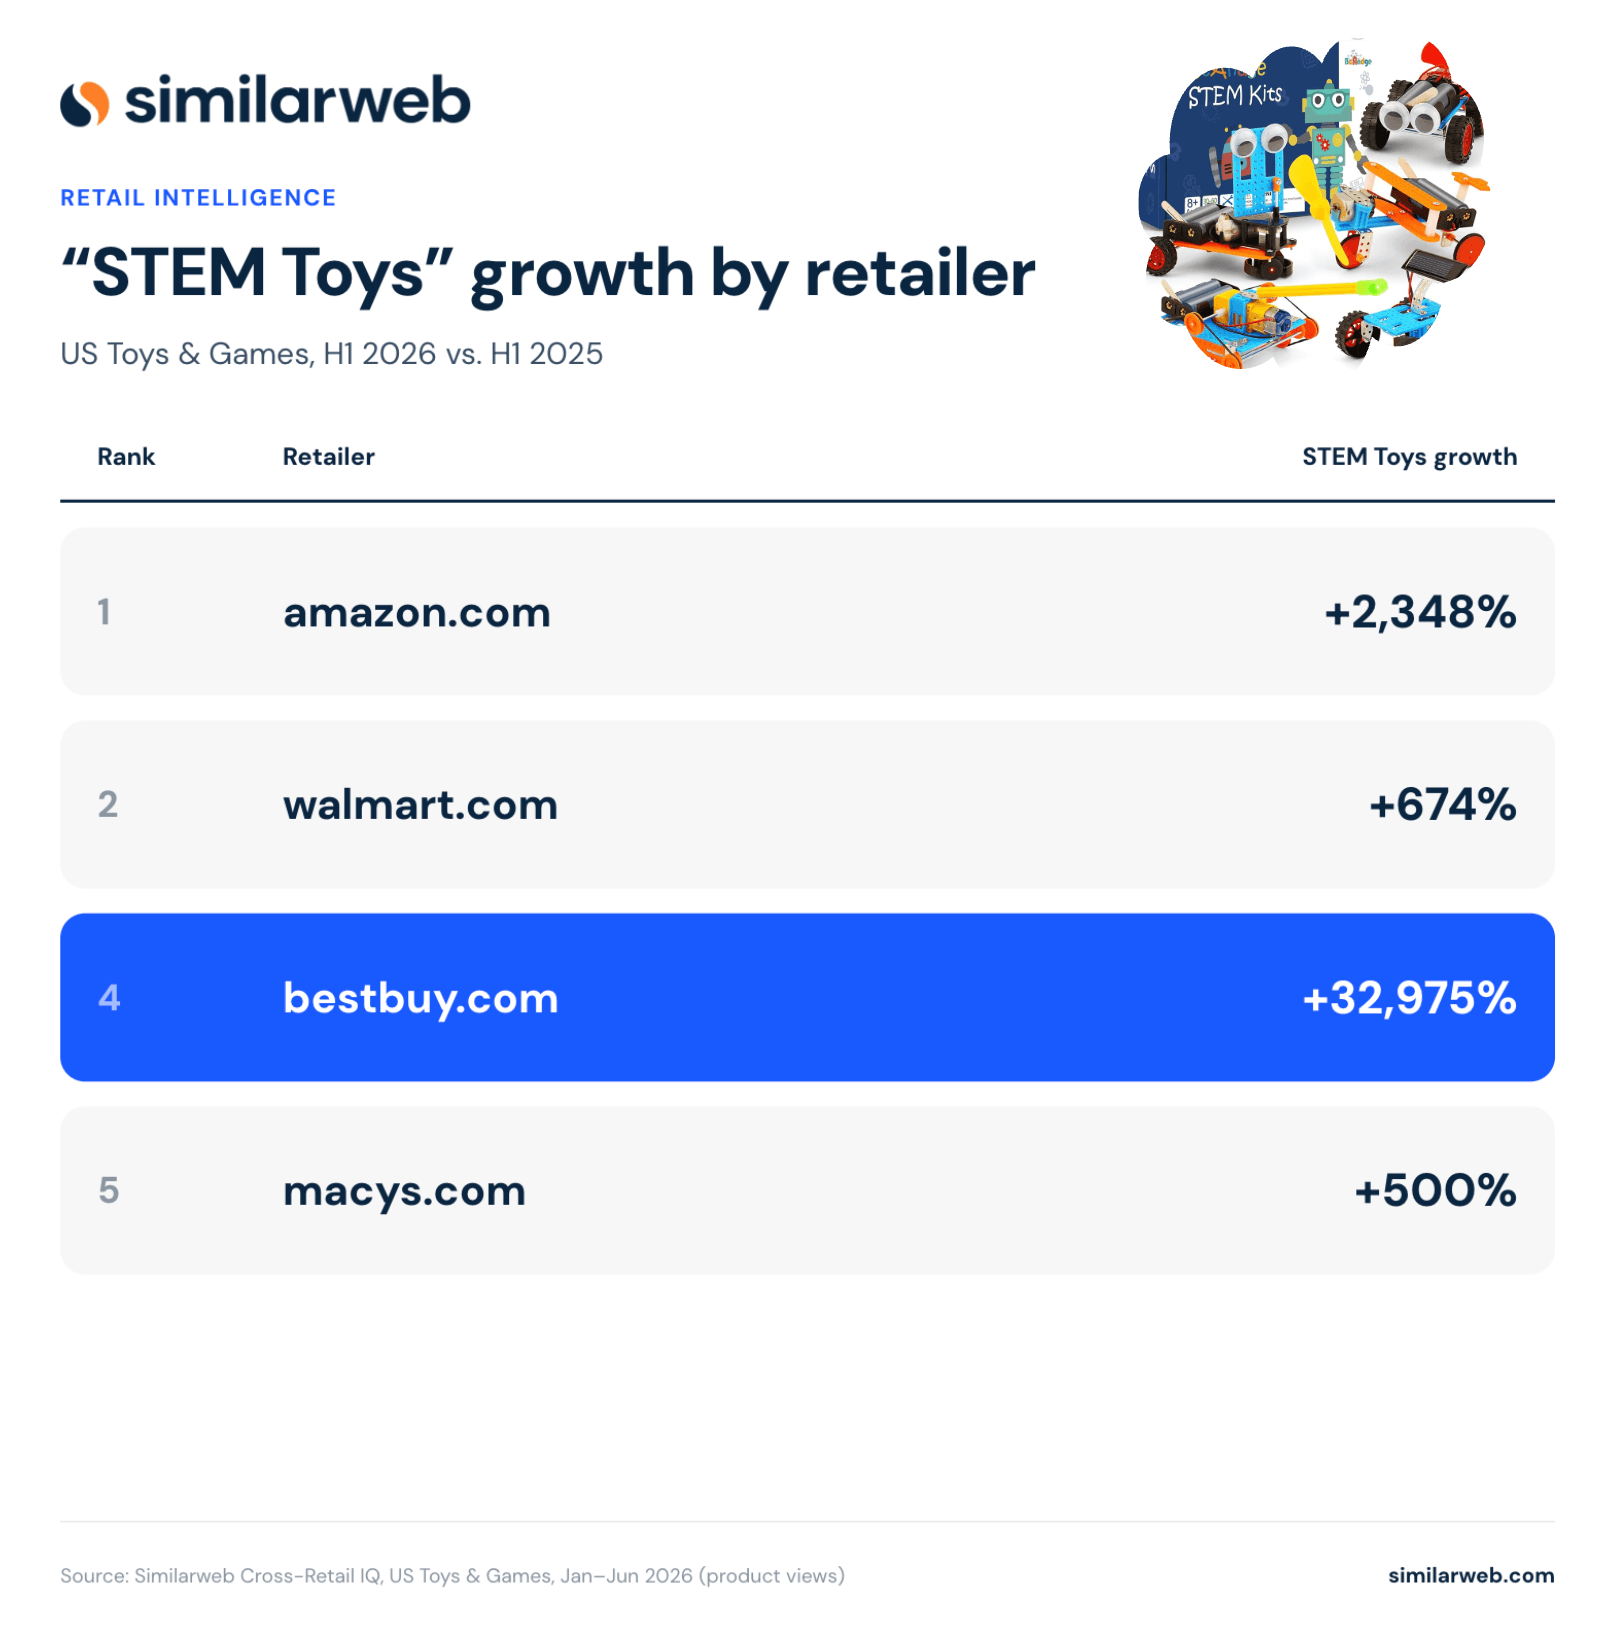
It’s a rare case where a number this large turns out to be exactly what it looks like.
Macy’s toy business, while still relatively small, continues to benefit from its Toys “R” Us shop-in-shop partnership. The Toys “R” Us brand itself is enjoying a modest revival under WHP Global, with plans to add 28 U.S. stores during 2026.
More broadly, collectibles continue to outperform because demand is no longer concentrated around the holidays. Circana found collectibles grew 32% during 2025, while purchases from adults aged 18 and older increased 18%. Trading cards, premium building sets, and collectibles have become year-round purchases rather than seasonal gifts.
Tariffs are largely an H2 story for this category. Both Mattel and Hasbro have indicated that their most significant price increases will arrive in Q3, meaning H1 demand likely still reflects pre-hike pricing.
When we revisit these rankings for biggest retailers in America in six months, there are several storylines worth watching.
Can Old Navy recover its assortment in time for back-to-school? Will Mattel and Hasbro’s tariff-driven price increases soften holiday toy demand? Can Petco’s refinancing finally translate into measurable share gains? And will Dick’s Sporting Goods maintain its momentum once the World Cup and back-to-school tailwinds fade?
Rankings and market shares reflect Similarweb’s Cross-Retail IQ visit-share data for large retailers in the US for the stated category and time period.
Brand and subcategory percentages represent share within each retailer’s own department, not the overall market.
Growth rates calculated from very small starting bases, including newly launched product lines or newly tracked subcategories, can appear unusually large and should be interpreted directionally rather than literally.
Who are the largest retailers in the US?
Amazon remains the clear market leader among top retailers in America across every category in this report, leading visit share in Electronics (76.4%), Pet Care (55.3%), Clothing, Shoes & Jewelry (41.9%), Home & Kitchen (58.0%), Sports & Outdoors (64.3%), and Toys & Games (72.2%). While Amazon’s overall share of US e-commerce has largely plateaued since its 2021 peak, it continues to dominate shopper traffic across virtually every major retail category.
Which retailers are gaining market share the fastest?
The biggest momentum among top US retailers in H1 2026 came from category specialists rather than general retailers. Chewy continued strengthening its position in Pet Care through subscriptions and veterinary services, Quince posted exceptional growth in apparel, particularly swimwear, and Dick’s Sporting Goods benefited from its Foot Locker acquisition and strong demand for licensed sports merchandise. Wayfair also continued its turnaround, pairing improving profitability with renewed customer growth.
How do tariffs affect US ecommerce retailers in 2026?
Although the Supreme Court struck down the IEEPA tariffs early in 2026, big retailers in the US still faced significant import costs after new Section 122 and Section 301 tariffs were introduced. Many companies chose to absorb those costs during the first half of the year instead of immediately raising prices. As a result, the largest pricing impact is expected during H2 2026, particularly in toys, apparel, and consumer electronics.
How is AI changing online shopping in 2026?
AI is increasingly influencing how consumers discover products before they visit a retailer’s website, and top online retailers in the US are adapting quickly. Amazon replaced Rufus with Alexa for Shopping, while Google significantly expanded AI Overviews for shopping-related searches. Rather than building their own AI assistants, retailers such as Best Buy and Gap are integrating directly with platforms like ChatGPT, Google’s AI Mode, and Gemini, making AI-powered product discovery a bigger source of traffic.
How was market share calculated?
The rankings in this report are based on Similarweb Cross-Retail IQ (CRIQ) visit-share data for top retail companies in the US between January and June 2026. Market share measures the percentage of shopper visits captured by tracked retailers within each category, not sales or gross merchandise value (GMV). Brand rankings reflect each retailer’s internal assortment, while subcategory growth measures changes within that retailer’s own department rather than across the overall market.

Principal Product Marketing Manager
Daniel brings 10+ years of marketing experience, specializing in both B2B and B2C audiences. He thrives at managing delivery of projects, consistently developing concepts that drive impact.

What Is Retail Intelligence? How It Works and Why It's Essential to Digital Commerce

Most Searched Things on Google in 2026
Put the full picture at your fingertips to drive product views and sales
