






The Top 100 Most Visited Websites in the USA (August 2026)
by Shai Belinsky10 Min.
Sep 29, 2026
 Stock Intelligence
In the investment world, there are tens of thousands of publicly listed companies that are traded on hundreds of stock exchanges worldwide. Each of these publicly traded companies is tied to a tremendous amount of data that includes sector and industry classifications, subsidiaries, unique numeric identifiers, and, of course, ticker symbols.
This data is crucial information for investors to track, monitor, and assess portfolio companies and new investment opportunities. When each data point points to its publicly traded company in a single location, it makes for much easier analysis. This is known as ticker mapping.
Pair ticker mapping with unique alternative data metrics, and investors gain the ability to surface signals and craft custom insights that can track sector trends and company performance and drive investment strategies.
First, the basics.
Ticker mapping is a form of data integration – the process of extracting and combining data from multiple sources into a consumable format that can be put to use for a variety of decision-making purposes. It involves integrating a publicly traded company with all its relevant online information.
A typical ticker mapping schema will look something like this:
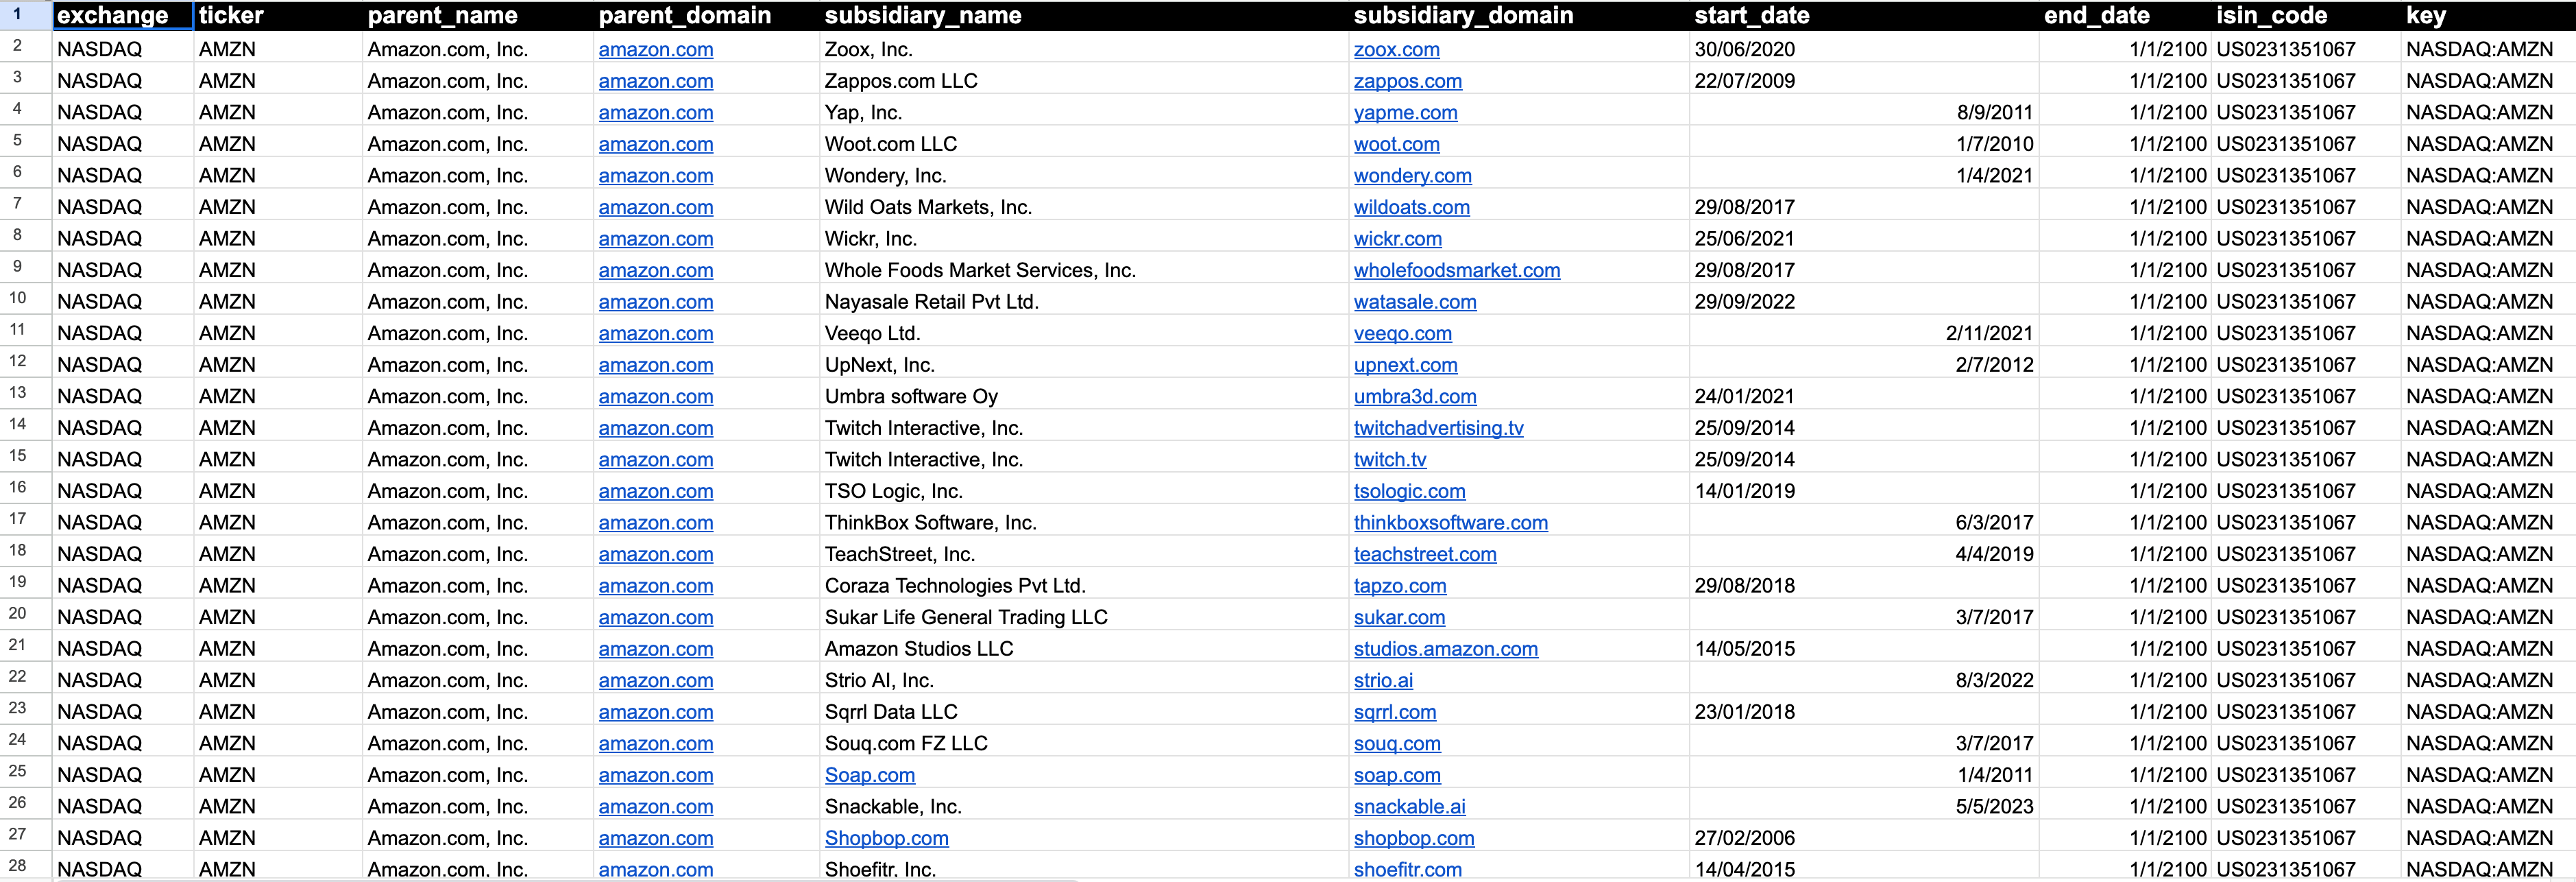
Ticker mapping then becomes the foundation for building models and signals and can be ingested two ways:
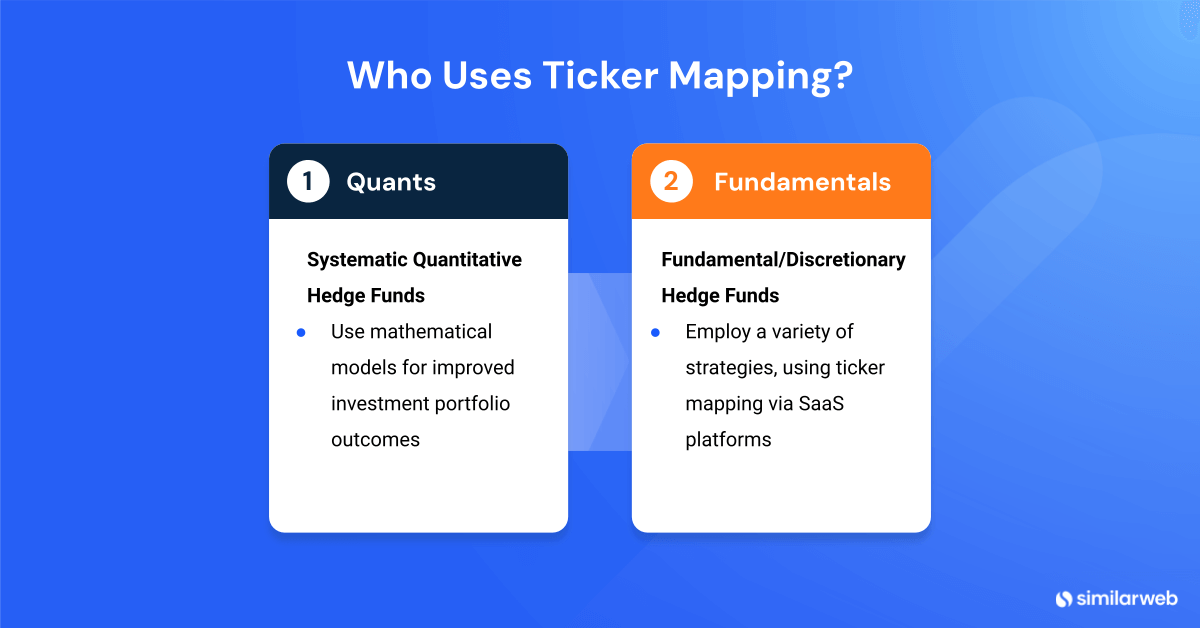
Typically, a systematic quantitative hedge fund is an example of a company that would integrate ticker mapping into its investment strategy. A systematic quant fund uses mathematical models and algorithms to build trading strategies and to create consistent portfolio outcomes, balance risk and return, and target investment outcomes.
A fundamental or discretionary hedge fund, which uses a wide range of strategies, including leverage (borrowed money) and the trading of nontraditional assets, to earn above-average investment returns, may also utilize ticker mapping even without a data science team when available in other formats, like on a SaaS platform.
Ticker mapping is the cornerstone of Similarweb Stock Intelligence. It maps 60,000 tickers across 144 global exchanges, which were matched to more than 300,000 domains and 50,000 apps. This includes seven years of historical data, which is paramount for building investment strategies, and point-in-time mapping, which provides key historical data and insights for precise modeling, including corporate structural changes, M&A activities, and brand launches.
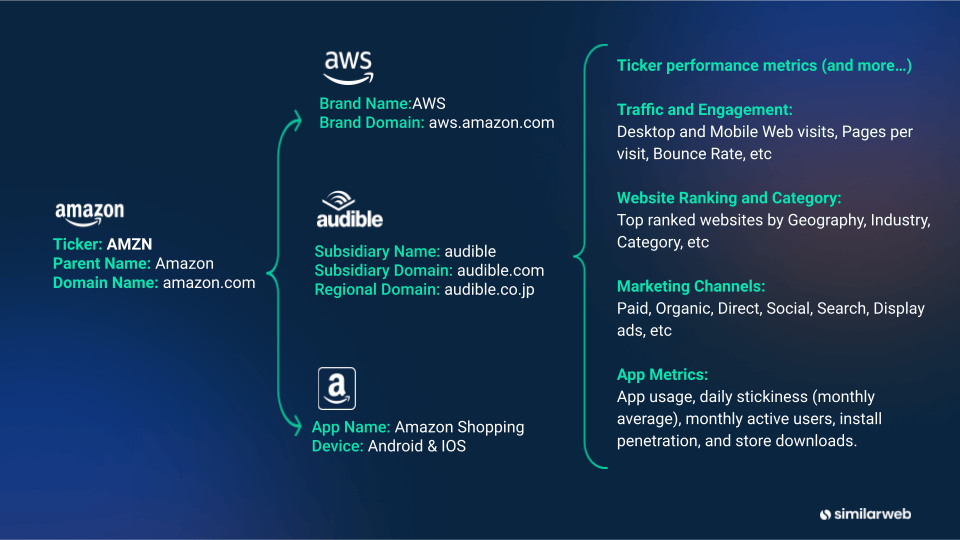

The Ticker Mapping methodology developed by Similarweb ensures precision and accuracy through a 4-step process:
The data collection includes unifying important company data:
The data synthesis processes and blends the different datasets and then matches the different entities into a structured schema:
On a monthly basis, Similarweb’s research analysts:
The ticker mapping feed is then paired with Similarweb’s datasets, including Total Visits, Unique Visits, Bounce Rate for domains, and Monthly, Weekly, and Daily Average Users for apps, and aggregated by stock.
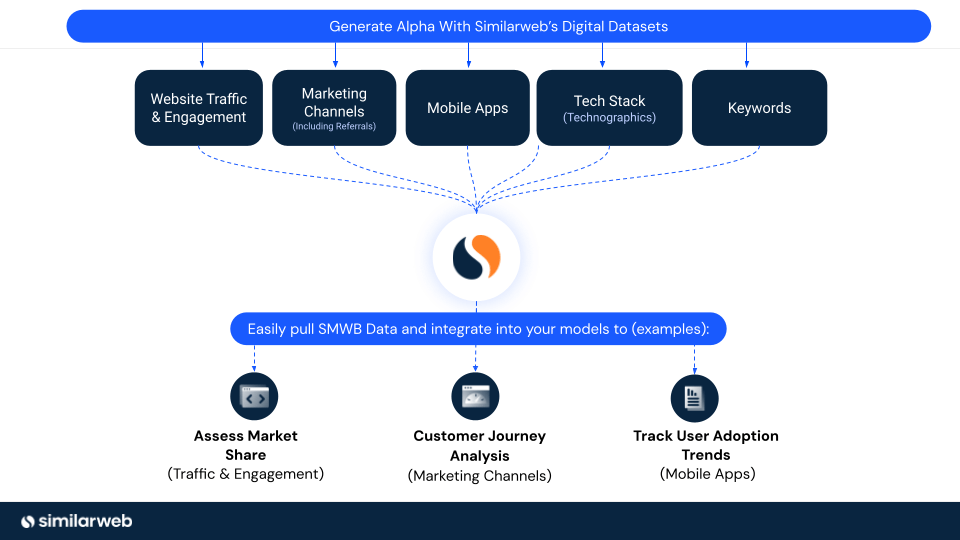
It can be an impossible task trying to sort out which domains and apps belong to which company and to stay on top of M&As to keep the data up to date. As of 3Q23, there are 359 million domains online, 1.96 million apps available through the Apple store, and 2.87 million apps available in the Google Play store. Similarweb’s Ticker Mapping gives investors a clear path into the digital world. Then, Ticker Mapping + Similarweb Digital Data surfaces signals and drives insight into company performance with daily, weekly, or monthly granularity.
The data is also customizable so that investors see only the data pertinent to their models, whether for a specific exchange (NYSE, NASDAQ, S&P, LSE, TSE, SSE) or a specific region. Then, add the most valuable Similarweb datasets to scale up analysis.
With Similarweb’s Data-as-a-Service (DaaS) option, Systematic quant funds can easily integrate the data, aggregated by ticker, into algorithmic trading strategies through API feeds or files sent directly via Amazon, S3, or Snowflake.
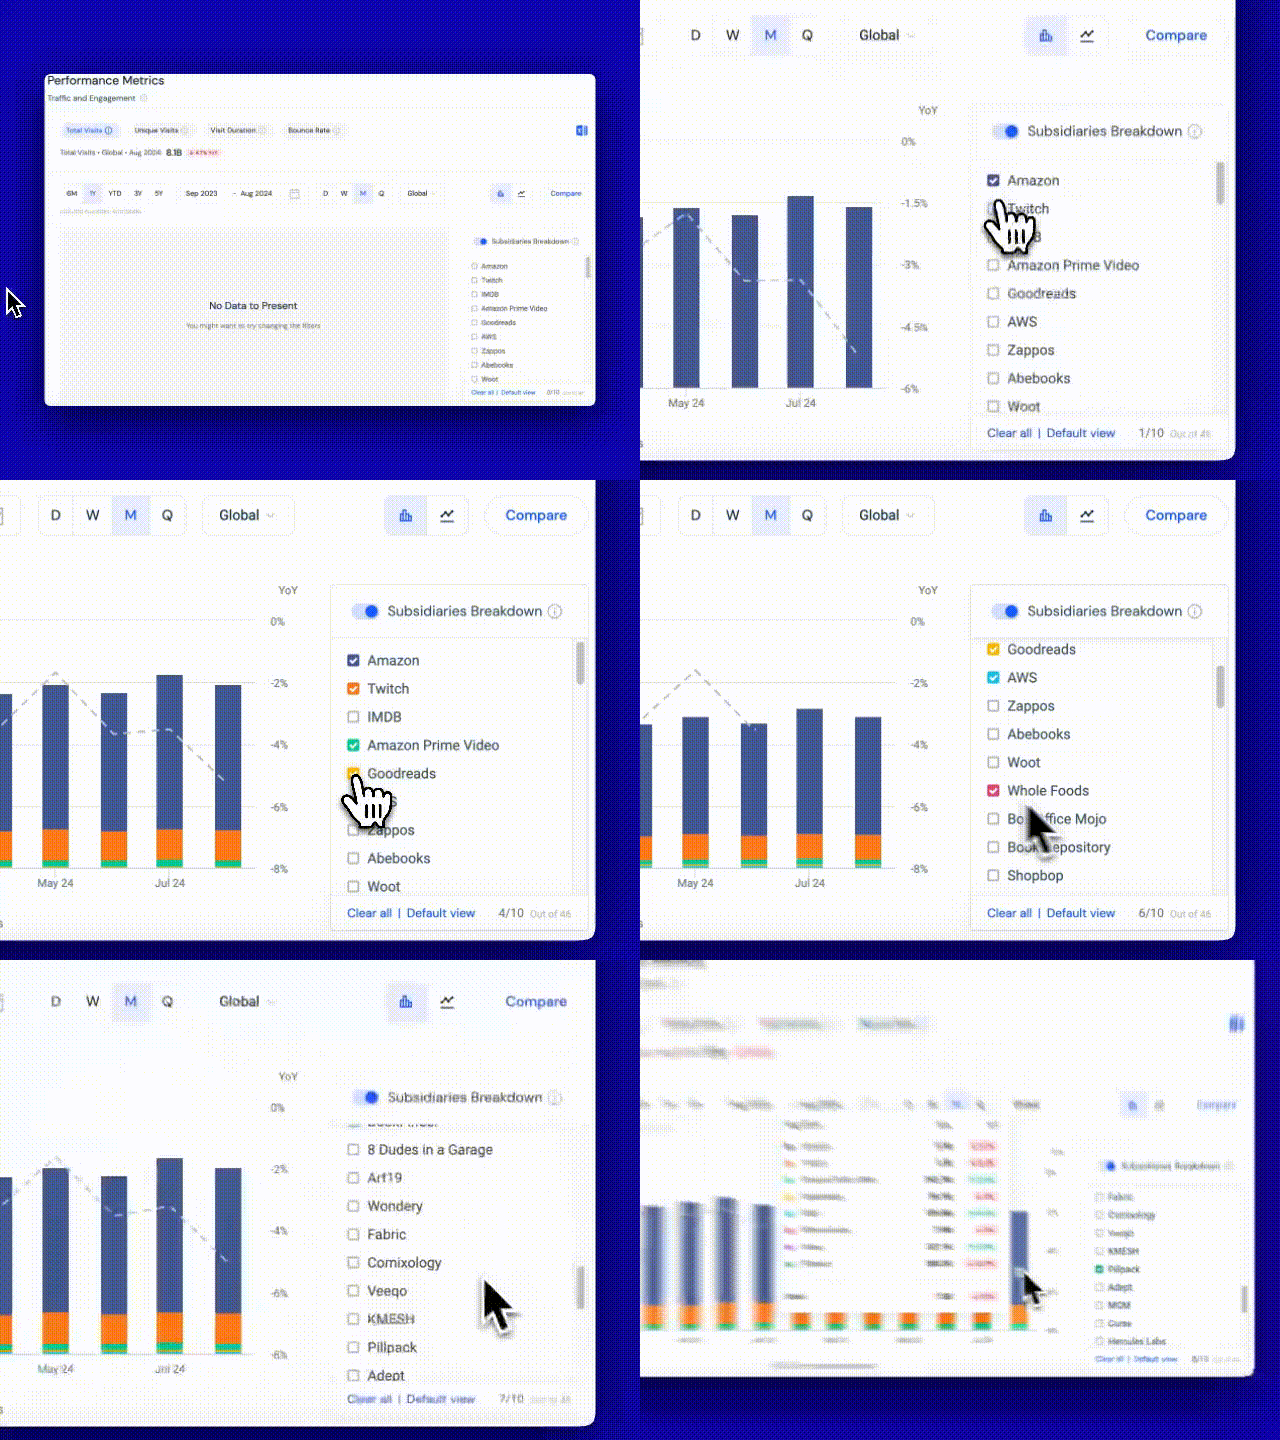
It’s a bit different for fundamental hedge funds. Because they might not normally have a data science team to consume and analyze data feeds, a SaaS platform becomes the tool of choice to analyze and generate insights around target companies.
The Similarweb Stock Intelligence platform, powered by Ticker Mapping, has all data aggregated by ticker and gives investors a holistic view of companies of interest. They also have the option to select the domains and apps of these companies in order to generate the insights needed to monitor performance and support investment strategies.
Making sense of the digital world can be challenging. But with Similarweb’s Ticker Mapping, publicly traded companies’ online footprints are constantly monitored and documented, including M&A activity, to ensure all mapped domains and apps stay current. This is crucial for hedge funds monitoring portfolio companies and researching target companies.
Then, just add Similarweb’s Digital Data to your Ticker Mapping feed. By examining robust traffic, engagement, and app data throughout the quarter, you can uncover signals and derive insights that help forecast stock performance and provide a deeper understanding of company dynamics—generating the alpha your investment strategies need.
What is ticker mapping?
Ticker mapping aligns a publicly traded company with its key information, including firmographics, ticker symbol, primary exchange, ISIN number, CUSIP number, GICS classification, and subsidiaries.
Who uses ticker mapping data?
Systematic quant funds use the data feed to enhance their algorithmic investment strategies, while fundamental hedge funds can leverage it through SaaS platforms.
How can I access Similarweb’s ticker mapping data?
You can access Similarweb’s Ticker Mapping data through a direct data feed or by using the Stock Intelligence platform.
by Andrea Pash
Senior Content Marketing Manager
Andrea, with her extensive marketing background and 15+ years in finance, pulls insight and crafts content for Stock Intelligence & DaaS at Similarweb. A UC Irvine grad, she's a concert lover and avid traveler.
The Top 100 Most Visited Websites in the USA (August 2026)
Similarweb Named in Forrester's Answer Engine Optimization Technologies Landscape, Q3 2026

Anthropic IPO: What Claude's Web and App Data Show
Leverage data used by 5,000+ companies to improve your strategy