Digital Market Share Dashboards: Daily Competitive Insights
Analyze your true digital market share across web and app. Monitor competitors, identify regional trends, and benchmark your brand daily, all from a single, intuitive dashboard.
Trusted by global brands to stay ahead in the digital market.


Core dashboard capabilities
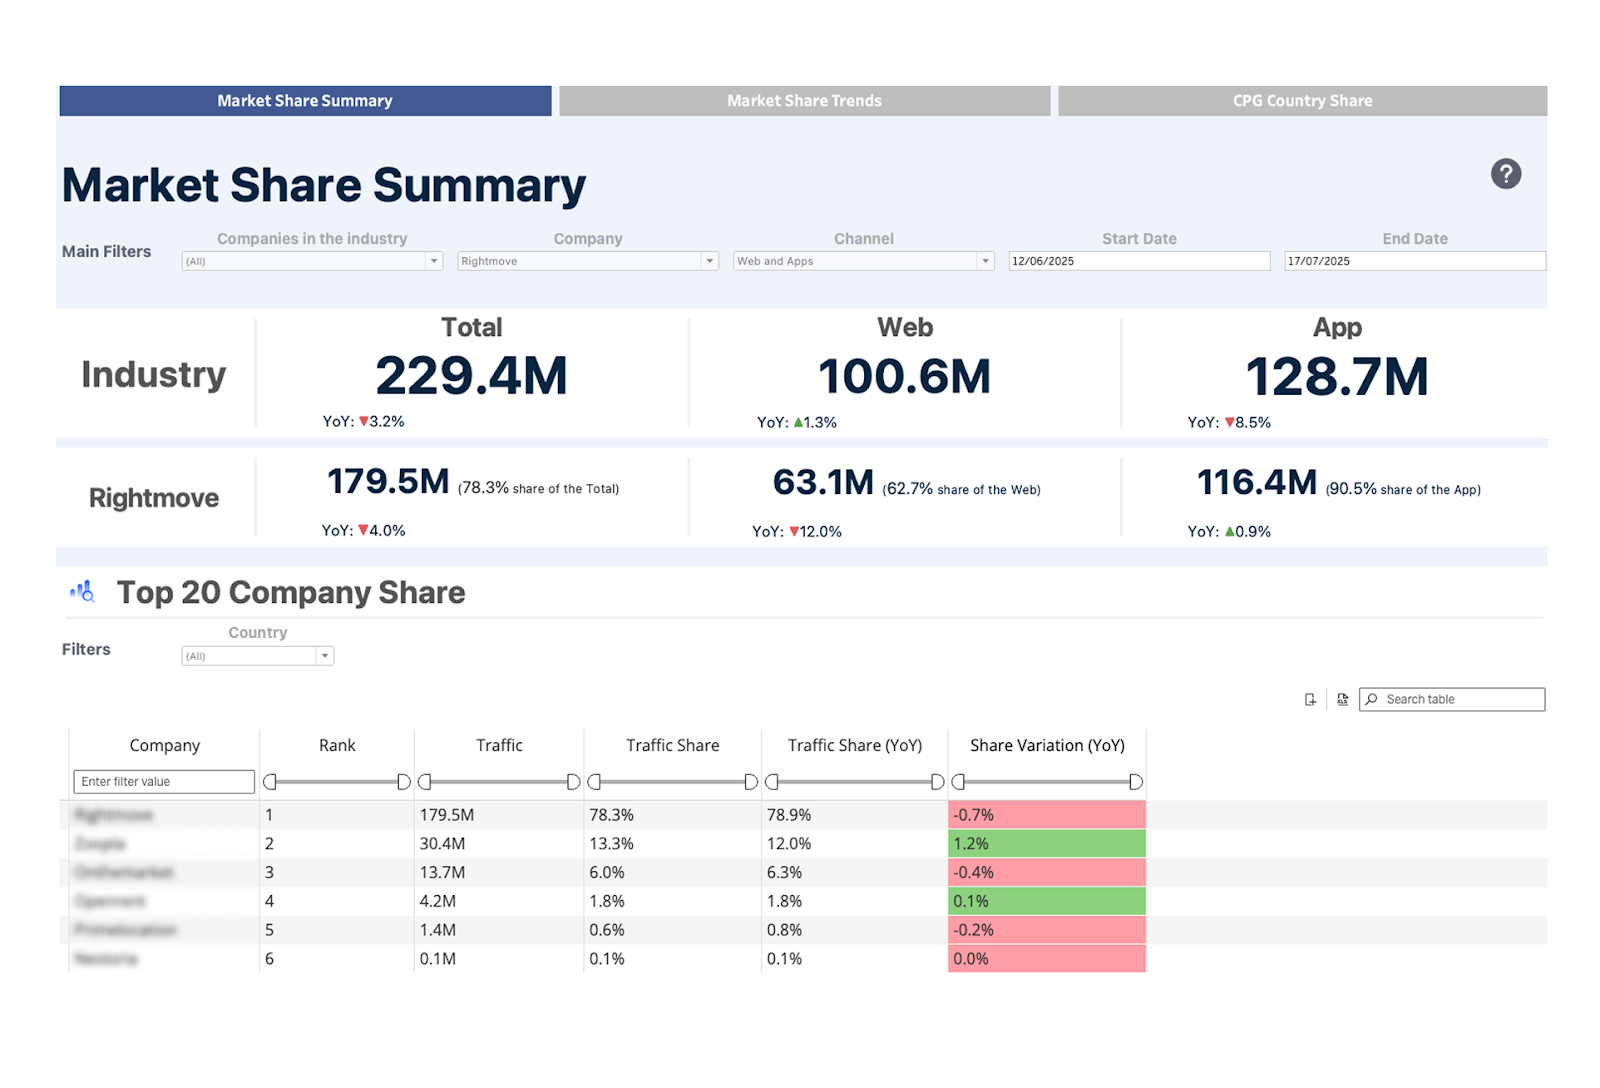
Combined web + app market share
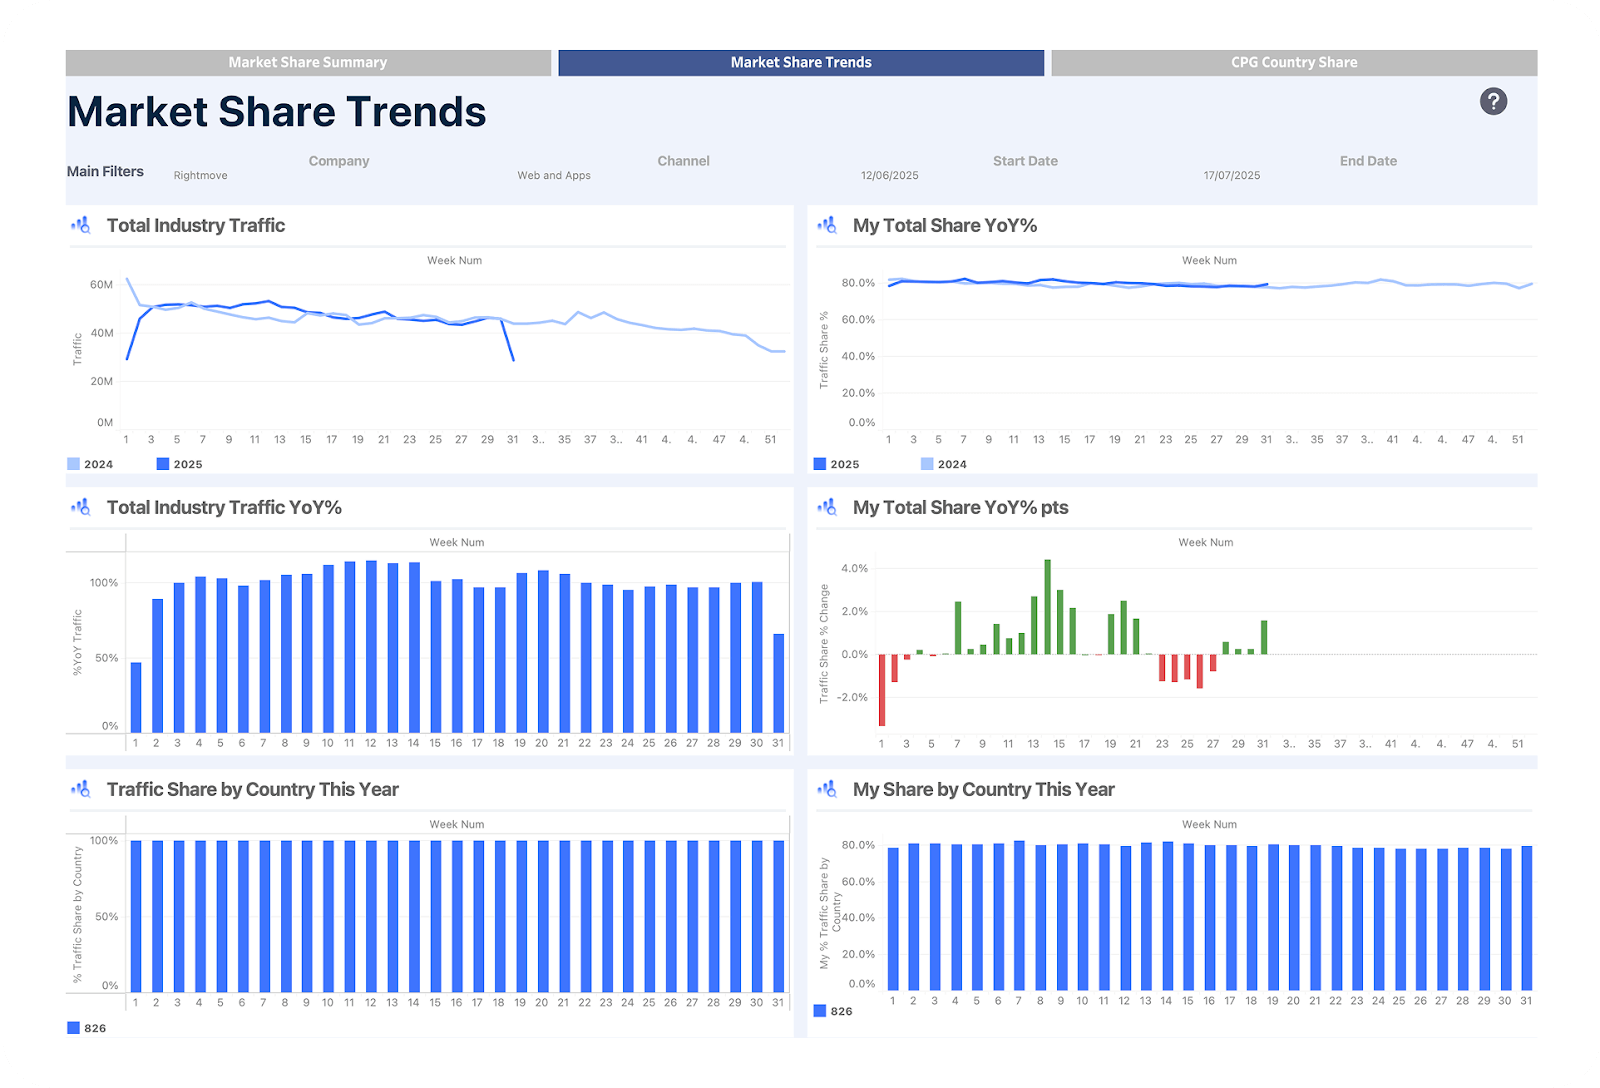
Daily granularity & retail roll-ups
Country & US state splits
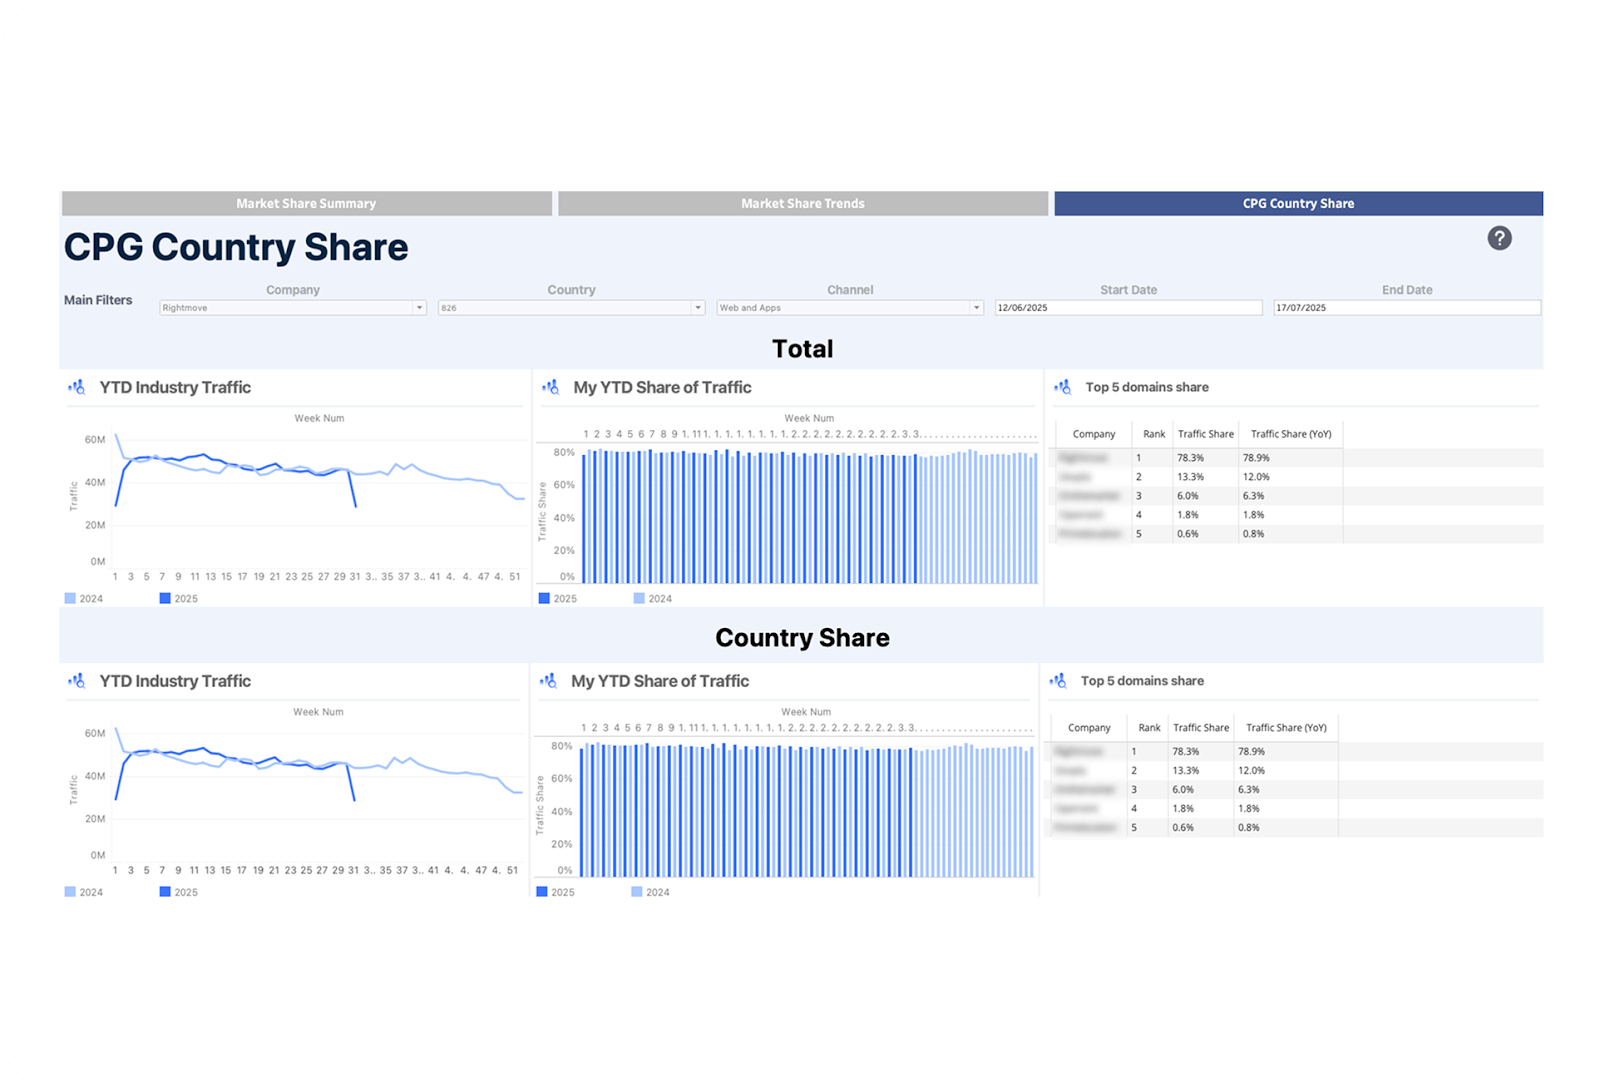
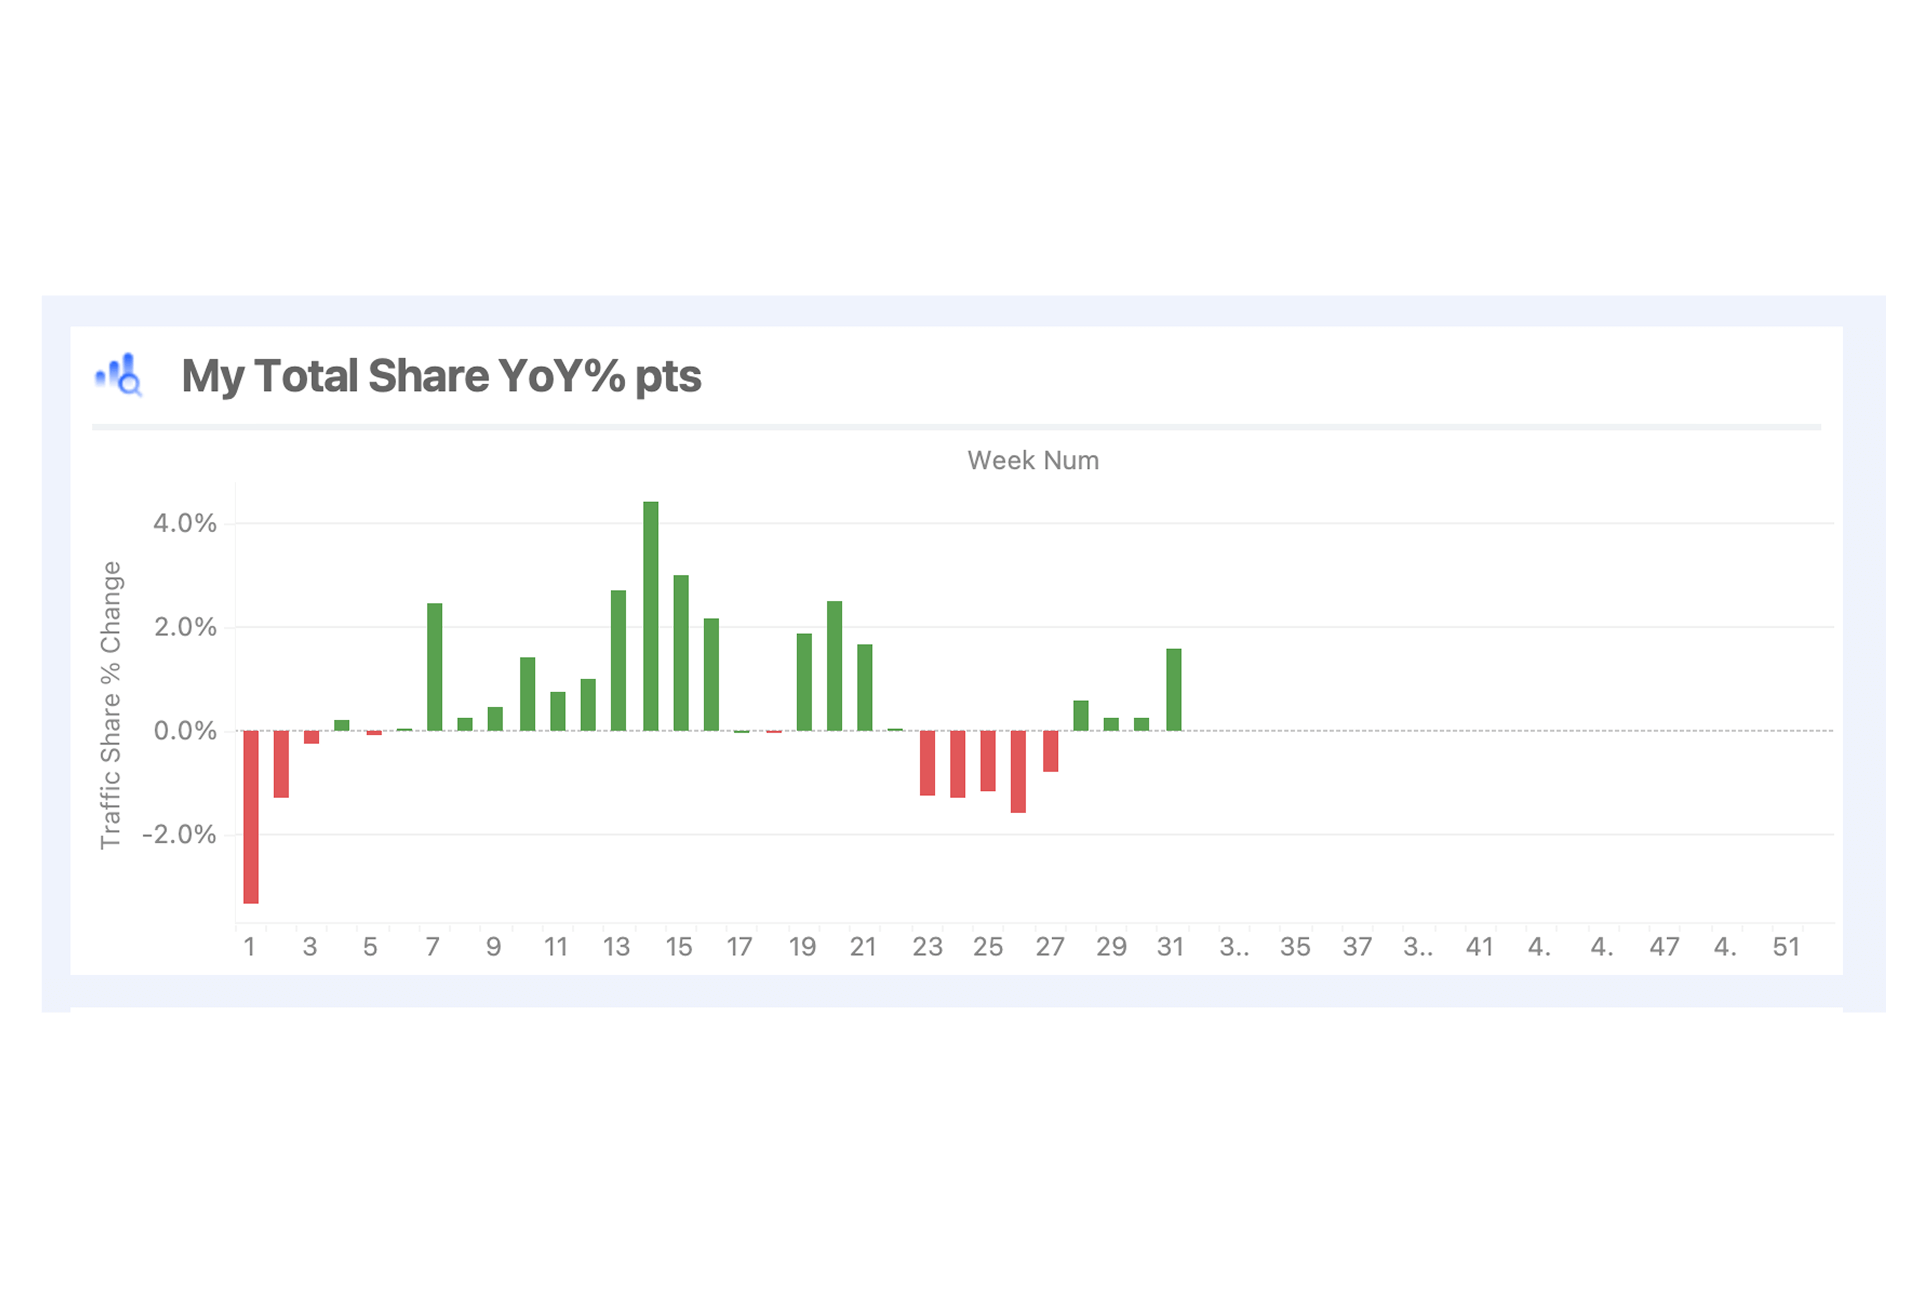
Visualized market share
Gain the fastest, most reliable insight into your true market share
Conduct real-time web and app benchmarking across the markets you care about most.

Strategy & Comp Intelligence
Track category positioning, monitor competitor moves, and prioritize your responses.

Product & Growth Strategy
Measure new product launch impact and identify new traction channels.

Ecommerce & Merch Strategy
Monitor share at the category/domain level to guide pricing and assortment.
Why Fortune 500 brands choose us
- Competitive Benchmarking & Alerts: Spot sudden share shifts, track rivals, and surface competitive threats.
- Executive Reporting & KPI Tracking: Build exportable, standardized reports to measure market position and performance.
- Campaign Impact Analysis: See how launches, campaigns, or pricing changes influence digital share.
- Regional Market Prioritization: Leverage country- and state-level trends to guide growth, sales, and investments.
- Partnership & M&A Screening: Evaluate partners or acquisitions with audience overlap and app penetration insights.
FAQs
-
A market share dashboard is a visualization tool that shows your digital traffic share across web and app, benchmarked against competitors and the market.
-
It combines daily digital traffic data into flexible views (weekly, monthly) with filters by region, industry, and domain.
-
Many industries are increasingly app-first. By combining web + app, you get a full view of digital engagement.
-
Yes. You can filter by region, domain, and apply domain-level adjustments for calibration.
-
Our dashboards update daily, with weekly and monthly roll-ups for reporting. This means you can track competitive shifts almost in real time instead of relying on quarterly or annual reports.
-
Yes. Dashboards include country and U.S. state-level splits, allowing you to identify local strengths, weaknesses, and expansion opportunities.
