You’ve hit your search limit
Start your free trial to keep exploring full traffic and performance insights.
Get StartedGrafanaUI analisi dell'app per 3 maggio
GrafanaUI
- Roman Senchuk
- App Store di Apple
- A pagamento
- Strumenti per gli sviluppatori
Access Your Grafana Dashboards and Alerts Anywhere, Anytime
GrafanaUI brings complete Grafana monitoring to your iPhone and iPad. Monitor dashboards and get instant push notifications for critical alerts—even when the app is closed. Perfect for on-call engineers, SREs, and DevOps teams.
WHAT’S NEW IN 2.0.0: ALERT MONITORING
Version 2.0.0 introduces end-to-end Grafana alert monitoring on iOS: push notifications on the lock screen, background alert updates using a dedicated Alerts API token, filters (state, dashboard, folder, server, date range), notification rules to reduce noise, every alert state (Alerting, OK, Pending, No Data, Paused), configurable refresh intervals (1 minute to 1 hour), multi-server aggregation, and an app icon badge for alerting counts.
Performance & battery: Low Power Mode and Adaptive Refresh tune refresh behavior; dashboards use manual pull-to-refresh so they don’t idle-poll; stricter background rules and smarter caching reduce network use.
Never miss a critical alert—secure API-token authentication plus a polished alerts experience.
KEY FEATURES
Alert monitoring & notifications
• Push notifications; background alert updates while the app is closed
• All alert states; filter by state, dashboard, folder, server, or date range
• Alert detail view with metadata, labels, annotations; notification rules for muting noise
• Configurable intervals; multi-server aggregation; badge counts
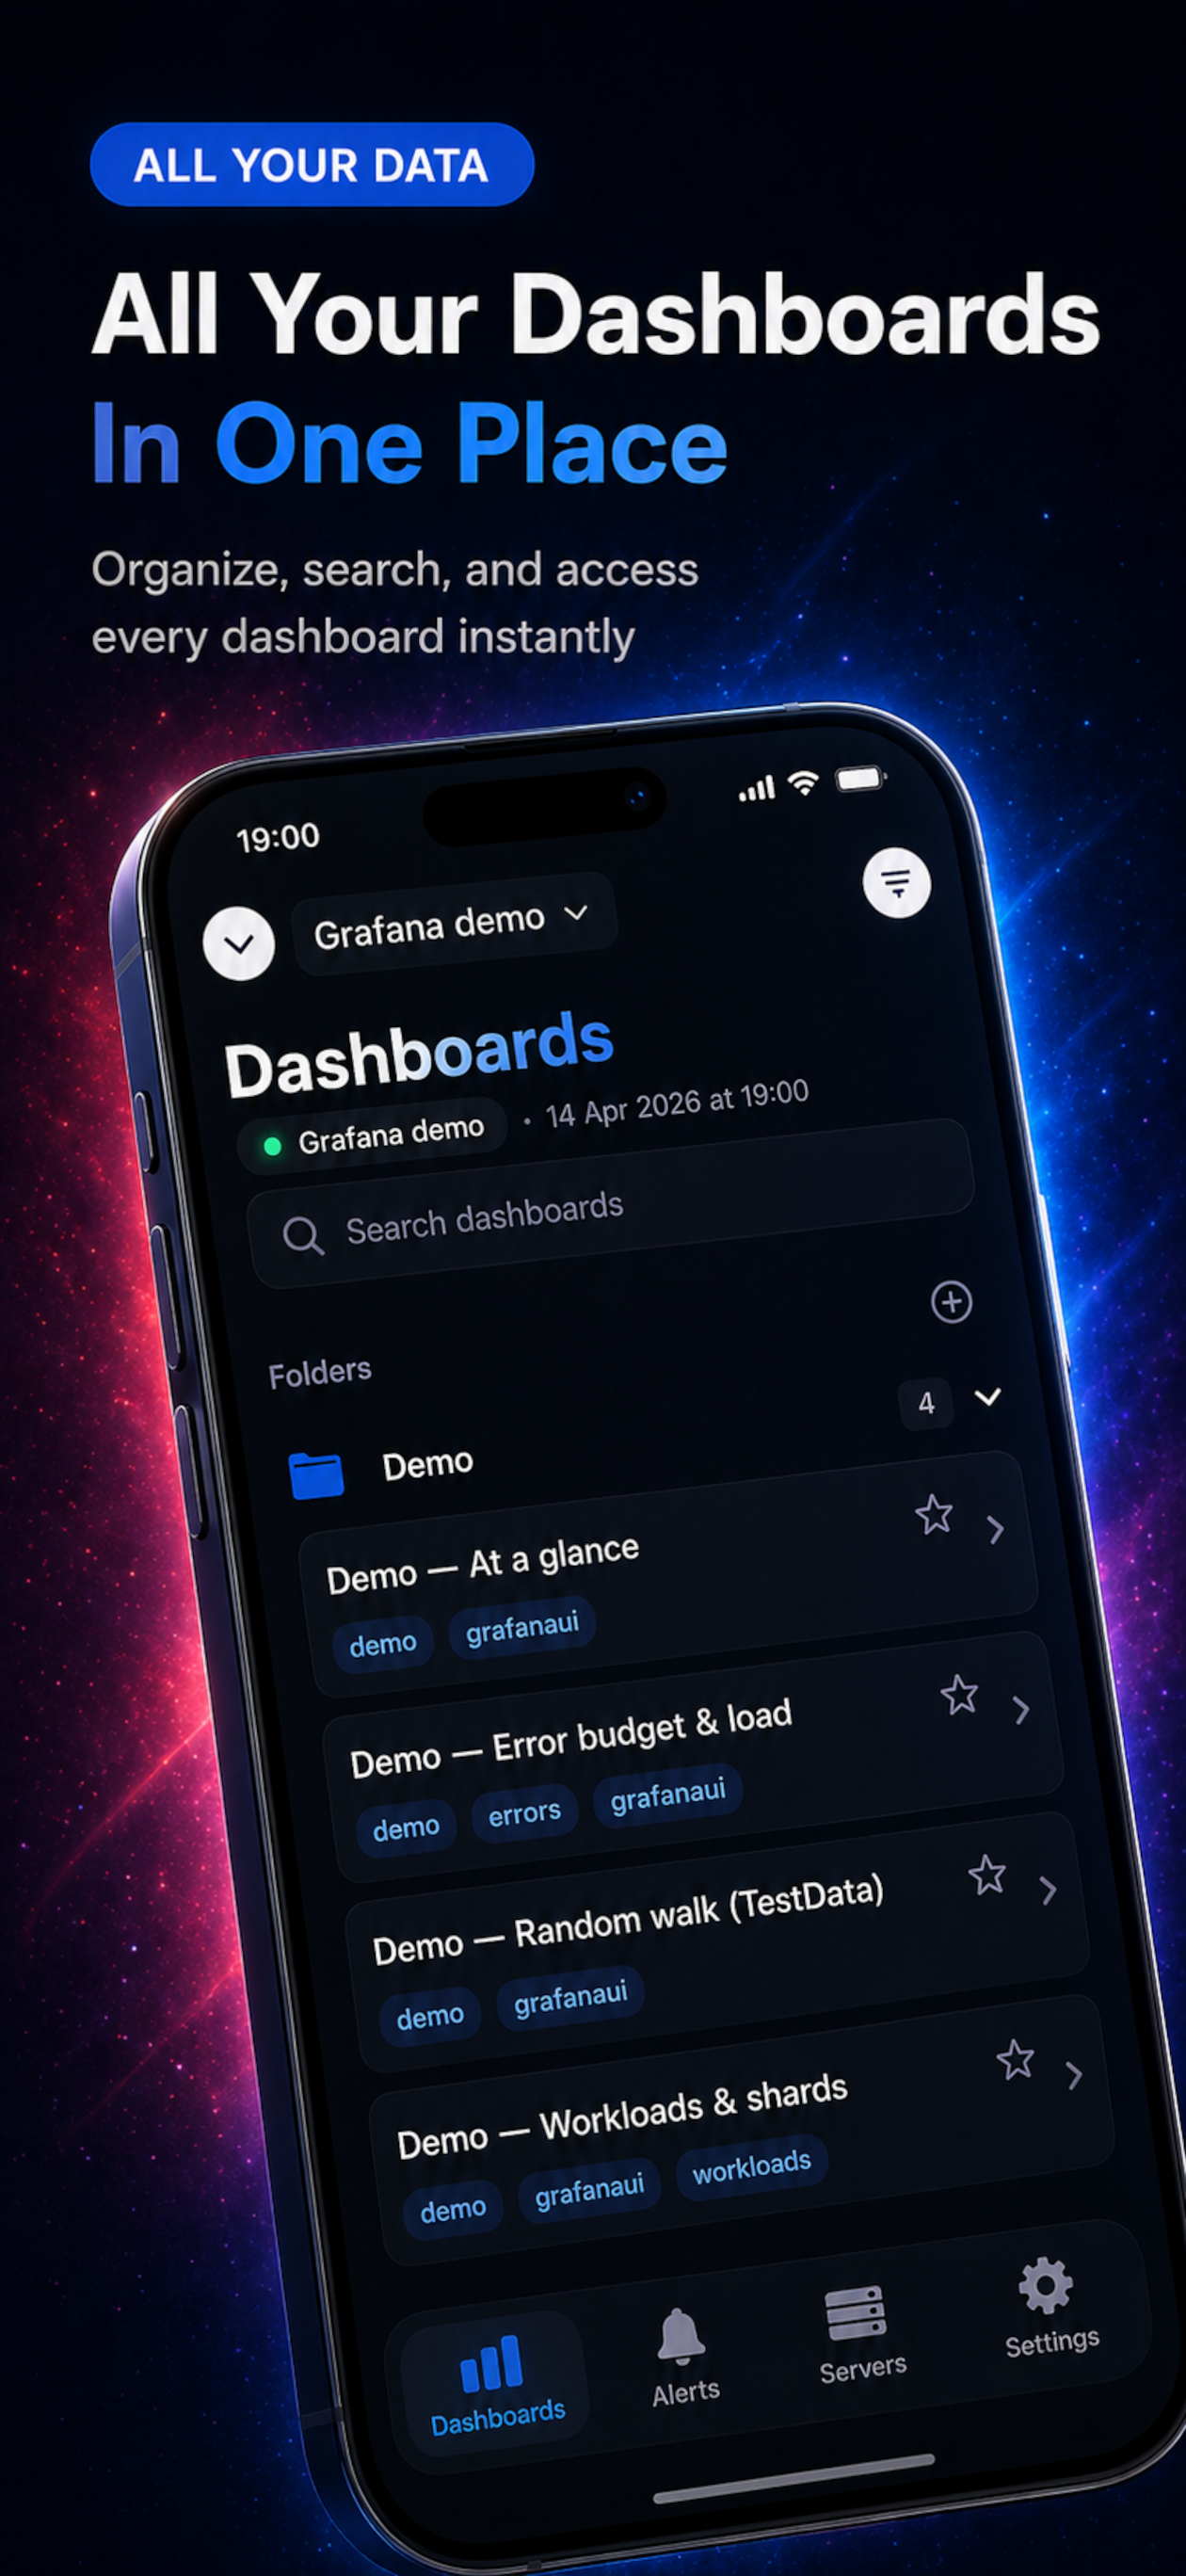
Dashboards
• Browse and search dashboards; tags; folders; favorites; WebView-based viewing with pull-to-refresh
Multiple servers & authentication
• Connect to multiple Grafana servers; cloud or self-hosted
• Web Authentication (OAuth, SAML, SSO), Basic Auth, or API tokens for alerts
• Credentials stored in iOS Keychain
Performance, security & design
• Low Power Mode, Adaptive Refresh, smart caching
• Optional PIN/biometrics; no third-party ad analytics SDKs
• Offline dashboard cache where applicable; Dark Mode; 9 languages
PERFECT FOR
DevOps, SREs, system administrators, data analysts, and anyone using Grafana.
USE CASES
On-call and incident response; remote work with secure connections; quick status checks on the go.
Your credentials stay in Keychain; biometrics adds an optional extra layer.
REQUIREMENTS
• iPhone and iPad compatible
• iOS 15.0 or later
• Access to your Grafana server (cloud or self-hosted)
IMPORTANT NOTE
Unofficial Grafana client—not affiliated with, endorsed by, or sponsored by Grafana Labs.
GETTING STARTED
1. Add your Grafana server URL
2. Choose authentication (Web Auth, Basic Auth, or None)
3. Configure an Alerts API Token in server settings for notifications
4. Enable notifications in Settings
5. Set up PIN or biometric authentication (optional)
Start monitoring your Grafana dashboards and alerts today.
SUPPORT
Having issues or suggestions? Follow us on Instagram @freshlab.app for updates and support.
Classifica degli store
La classifica del store si basa su diversi parametri stabiliti da Google e Apple.
Tutte le categorie in
Stati Uniti--
Strumenti per gli sviluppatori in
Stati Uniti#85
Principali concorrenti e app alternative
App con un'alta probabilità di essere utilizzate dagli stessi utenti, provenienti dallo stesso store.
Cacti Viewer
OverseerGo
HedgieMate: For your Tesla
OPNManager+
maggio 3, 2026