You’ve hit your search limit
Start your free trial to keep exploring full traffic and performance insights.
Get StartedAurora Forecast 3D analisi dell'app per 27 aprile
Aurora Forecast 3D
- Fred Sigernes
- Google Play Store
- Gratis
- Meteo
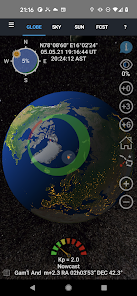
The Aurora Forecast 3D is a tool to track down where the aurora is located in the sky from any location on planet. It renders Earth in 3D with rotation and scaling at your fingertips. You can select locations and make your own ground - station list. The Sun illuminates the globe as it updates in near real-time. The short term forecasts are up to +6 hours, while the long term forecasts are up to 3 days ahead in time. They are updated when the app is active and connected to internet.
An Aurora Compass is included that shows where the auroral oval [1,2], the Moon and the Sun are located as you look up at the sky from your location. The phase and age of the Moon is also visualized in the compass. By zooming out in the 3D view port, satellites, stars and planets appear in their orbits [3] around the Sun.
FEATURES
- 3D view port of Earth.
- Solar illumination of the Earth and the Moon.
- Aurora oval size and location in real time.
- Day side location of the red Cusp.
- Forecasts based on predicted Kp index estimated by the Space Weather Prediction Centre (NOAA-SWPC).
- Includes a 2.4 million star map [4].
- City light texture [5].
- Earth, Sun and Moon textures [6,7].
- Sky view module to track planets and stars [8].
- 3-day space weather condition forecast as news ticker.
- Two-Line Element (TLE) satellite orbit calculations [9].
- Skyview navigation.
- 3D Laser Star pointer to identify star signs.
- Sounding rocket trajectories.
- Sun and Moon daily elevation plots with rise and set time.
- Epoch selection for magnetic pole position [10]
- Ovals based on polar orbiting satellites data [11]
- Target web links added to satellites, stars, planets and position.
- All-sky camera links to the Boreal Aurora Camera Constellation (BACC).
- Sky color animation [12,13].
- Zhang and Paxton ovals added [14]
- Geomagnetic storm push notifications.
- Youtube demonstration.
References
[1] Sigernes F., M. Dyrland, P. Brekke, S. Chernouss, D.A. Lorentzen, K. Oksavik, and C.S. Deehr, Two methods to forecast auroral displays, Journal of Space Weather and Space Climate (SWSC), Vol. 1, No. 1, A03, DOI:10.1051/swsc/2011003, 2011.
[2] Starkov G. V., Mathematical model of the auroral boundaries, Geomagnetism and Aeronomy, 34 (3), 331-336, 1994.
[3] P. Schlyter, How to compute planetary positions, http://stjarnhimlen.se/, Stockholm, Sweden.
[4] Bridgman, T. and Wright, E., The Tycho Catalog Sky map- Version 2.0, NASA/Goddard Space Flight Center Scientific Visualization Studio, http://svs.gsfc.nasa.gov/3572, January 26, 2009.
[5] The Visible Earth catalog, http://visibleearth.nasa.gov/, NASA/Goddard Space Flight Center, April-October, 2012.
[6] T. Patterson, Natural Earth III - Texture Maps, http://www.shadedrelief.com, October 1, 2016.
[7] Nexus - Planet Textures, http://www.solarsystemscope.com/nexus/, January 4, 2013.
[8] Hoffleit, D. and Warren, Jr., W.H., The Bright Star Catalog, 5th Revised Edition (Preliminary Version), Astronomical Data Center, NSSDC/ADC, 1991.
[9] Vallado, David A., Paul Crawford, Richard Hujsak, and T.S. Kelso, Revisiting Spacetrack Report #3, AIAA/AAS-2006-6753, https://celestrak.com, 2006.
[10] Tsyganenko, N.A., Secular drift of the auroral ovals: How fast do they actually move?, Geophysical Research Letters, 46, 3017-3023, 2019.
[11] M. J. Breedveld, Predicting the Auroral Oval Boundaries by Means of Polar Operational Environmental Satellite Particle Precipitation Data, Master thesis, Department of Physics and Technology, Faculty of Science and Technology, The Arctic University of Norway, June 2020.
[12] Perez, R., J,M. Seals and B. Smith, An all-weather model for sky illuminance distribution, Solar Energy, 1993.
[13] Preetham, A.J, P. Shirley and B. Smith, A practical model for daylight Computer Graphics, (SIGGRAPH 99 Proceedings), 91-100, 1999.
[14] Zhang Y., and L. J. Paxton, An empirical Kp-dependent global auroral model based on TIMED/GUVI data, J. Atm. Solar-Terr. Phys., 70, 1231-1242, 2008.
Ranking di utilizzo di Aurora Forecast 3D
Il ranking di utilizzo si basa sull'algoritmo di Similarweb che calcola le installazioni correnti e gli utenti attivi su un periodo di 28 giorni.
Tutte le categorie in
Stati Uniti--
Meteo in
Stati Uniti--
Interessi degli utenti e categorie principali
Le categorie principali e le app utilizzate dagli utenti di Aurora Forecast 3D
Categorie principali
Affinità
Le migliori app all'interno della categoria
Altri applicazioni
38%
12%
11%
8%
Principali concorrenti e app alternative
App con un'alta probabilità di essere utilizzate dagli stessi utenti, provenienti dallo stesso store.
Solar Walk 2: Planetarium 3D
Rainbow Weather: Storm Radar
Marine and Vessel Tracker
My Hurricane Tracker Pro
aprile 27, 2026