Value Charts: Flow Diagram のアプリ分析 3月29日
Value Charts: Flow Diagram
- Value Flow
- Google Play ストア
- 無料
- 生産性
Value Charts promotes connectivity and creativity where you can brainstorm with your team and take your business to the next level.
Value Charts can be used in various business sectors across the world where people connect and collaborate.
Value Charts comes with,
*Flows, which is an unique Value charts feature which acts as Sheets/Pages. The User can visualize and diagram the projects on these flows.
*Task To-Do List Tracking allows you to assign tasks and Track them on a regular basis until the task is done. This feature lets you keep track of your projects and Finish them with perfection.
*Custom Shapes feature lets you create your own customized shapes and upload them to use on your Flows. This gives you a personalized flow making experience with your own customized shapes and groups.
*Value stream mapping {VSM} at Value Charts develops the technique to analyze existing operations and sort out better solutions to eliminate errors. In order to eliminate flaws, the working environment of the organization is visualized through factual data. These techniques and our tools lead your business to perform immense growth.
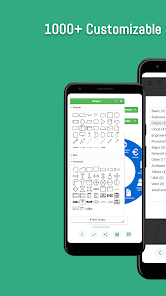
*Value Charts users have access to 1000+ Templates and Shapes which lets the users boost their creativity and work more efficiently on their projects. Value Charts Templates and shapes are crafted perfectly to ensure that users have a resourceful experience.
Value Charts Team Features :
*Team User Management feature lets you to Invite and Add Users to your Team and collaborate on your Projects, The Team Owner will be entitled with complete permission to access and manage the team and its features.
*Real Time Chat Feature lets the user and Team Members chat on Flows and share Photos, Videos, Documents, and Audio’s. This feature improves the Flow making process and enhances connectivity among the users.
* Flows Share Feature gives access to Share flows to Team Members and gives them access to edit and work on it.
Value Charts Leads to a simple and successful business agenda. With value charts you can examine carefully and look closely at your company’s rapid growth and progress. We help you in decoding your strategy to successful cash flow regardless of any business size.
Visit Us: https://valueflowsoft.com/
Follow Us:
Instagram: https://www.instagram.com/valueflowsweden/
Facebook: https://www.facebook.com/ValueFlowSweden
LinkedIn: https://www.linkedin.com/company/value-flow-sweden-ab/
Value Charts: Flow Diagram使用ランク
使用ランクは、28日間の現在のインストール数とアクティブユーザー数を計算するSimilarwebのアルゴリズムに基づいています。
業界別 ウェブサイトカテゴリーで
米国--
生産性で
米国--
3月 29, 2026