Best Selling Home & Kitchen Products & Brands on amazon.co.uk
See the full list of Market Leaders In Amazon Home & Kitchen in amazon.co.uk for April 1, and read the full analysis below
Last updated : April 1, 2026
Top Brands on the Home & Kitchen category
See which brands are leading the Home & Kitchen category on amazon.co.uk. Analyze data on top brands, including their revenue, product views, and conversion rates, offering a clear picture of brand competitiveness within the category.
| Brand | Revenue share | Change | Product views | Change | CVR | Change | ASP | Change | |||||||||||||||||||||||||||||||||||||||||||||||||||||||||||||||||||||||||||||||||||||||||||
|---|---|---|---|---|---|---|---|---|---|---|---|---|---|---|---|---|---|---|---|---|---|---|---|---|---|---|---|---|---|---|---|---|---|---|---|---|---|---|---|---|---|---|---|---|---|---|---|---|---|---|---|---|---|---|---|---|---|---|---|---|---|---|---|---|---|---|---|---|---|---|---|---|---|---|---|---|---|---|---|---|---|---|---|---|---|---|---|---|---|---|---|---|---|---|---|---|---|---|---|
| Generic | 1.02% | 0.67pp | 4.9M | 148.04% | 5.11% | 31.52% | £27.03 | 13.41% | |||||||||||||||||||||||||||||||||||||||||||||||||||||||||||||||||||||||||||||||||||||||||||
| YONISEE | 0.38% | 0.33pp | 4.4M | 112.31% | 2.04% | 17.58% | £7.19 | 7.20% | |||||||||||||||||||||||||||||||||||||||||||||||||||||||||||||||||||||||||||||||||||||||||||
| Dyson | 0.64% | 0.26pp | 1.5M | 0.16% | 5.08% | 30.07% | £24.93 | 4.58% | |||||||||||||||||||||||||||||||||||||||||||||||||||||||||||||||||||||||||||||||||||||||||||
| ComfoRest, Bedding & Upholstery Innovation Leader | 0.30% | 0.26pp | 4.9M | 107.08% | 5.01% | 17.06% | £5.36 | 13.37% | |||||||||||||||||||||||||||||||||||||||||||||||||||||||||||||||||||||||||||||||||||||||||||
| Steelcase | 0.27% | 0.25pp | 1.6M | 123.94% | 1.29% | 23.21% | £26.94 | 13.25% | |||||||||||||||||||||||||||||||||||||||||||||||||||||||||||||||||||||||||||||||||||||||||||
Who’s winning your category? See top brands by revenue, views, and conversion rate. | |||||||||||||||||||||||||||||||||||||||||||||||||||||||||||||||||||||||||||||||||||||||||||||||||||
Channels Breakdown & Performance
Understand where the top brands in the Home & Kitchen category get their traffic. This section breaks down the leading traffic sources, revealing which channels drive the most visibility and sales for top-performing brands.
See how top brands drive traffic and sales on Amazon.
See full channel breakdownTop selling sub-categories in the Home & Kitchen category
Explore the breakdown of sub-categories within the Home & Kitchen category. This section provides insights into the performance of different sub-categories, helping to identify which segments are growing, which are most competitive, and where consumer interest is shifting.
Top Products on the Home & Kitchen Category
Discover the most-viewed products in the Home & Kitchen category. This section highlights the top-performing products based on product views, revenue, and units sold, giving a snapshot of what’s driving consumer interest and purchases.
| Product | Category | Brand | Product Views | Change | Revenue | Change | Units Sold | Change | |||||||||||||||||||||||||||||||||||||||||||||||||||||||||||||||||||||||||||||||||||||||||||
|---|---|---|---|---|---|---|---|---|---|---|---|---|---|---|---|---|---|---|---|---|---|---|---|---|---|---|---|---|---|---|---|---|---|---|---|---|---|---|---|---|---|---|---|---|---|---|---|---|---|---|---|---|---|---|---|---|---|---|---|---|---|---|---|---|---|---|---|---|---|---|---|---|---|---|---|---|---|---|---|---|---|---|---|---|---|---|---|---|---|---|---|---|---|---|---|---|---|---|---|
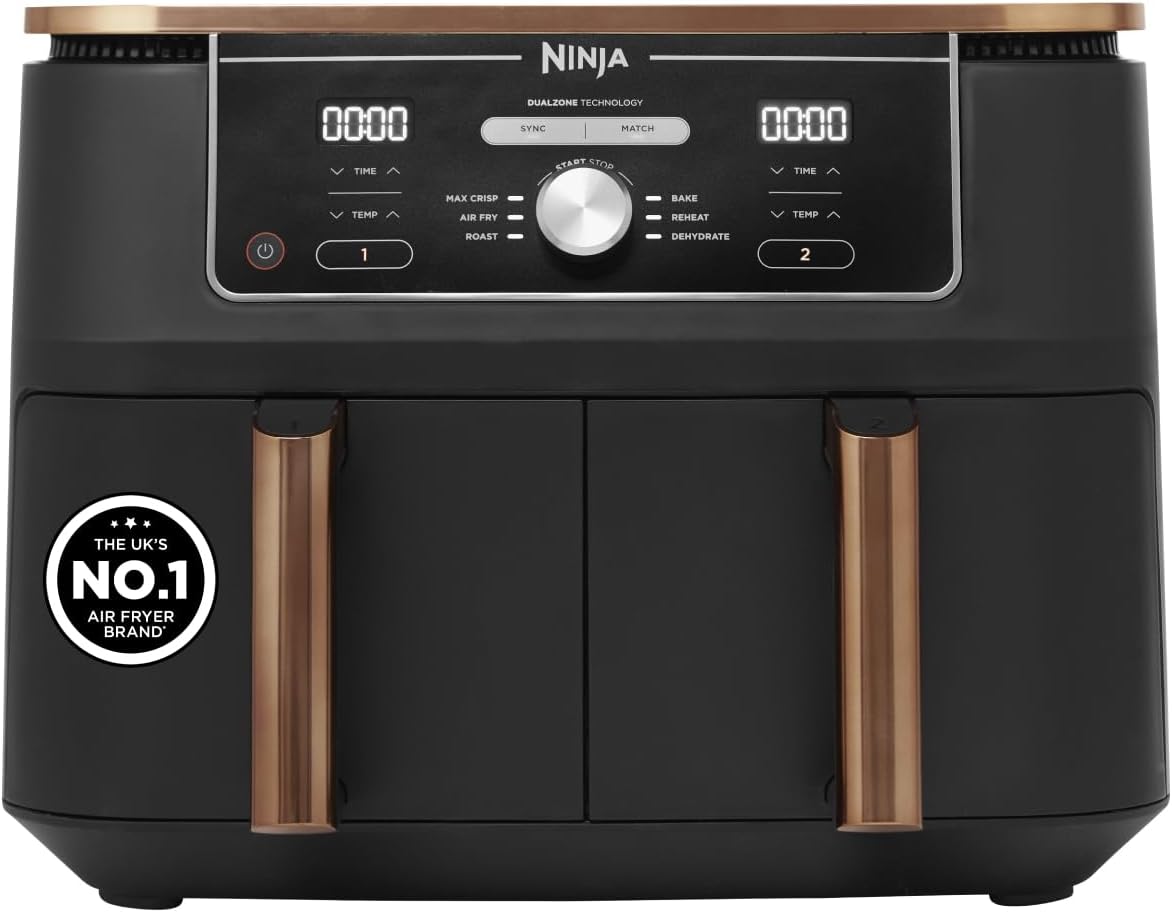 | ...> Air Fryers | Ninja | 189.4K | 36.97% | 6.36% | 5.09% | 78 | 9.69% | |||||||||||||||||||||||||||||||||||||||||||||||||||||||||||||||||||||||||||||||||||||||||||
 | ...> Desk Chairs | YONISEE | 168.9K | = | 8.73% | 0.33% | < 50 | 8.76% | |||||||||||||||||||||||||||||||||||||||||||||||||||||||||||||||||||||||||||||||||||||||||||
 | ...> Bean-to-Cup Coffee Machines | Sage | 166.2K | 81.61% | 5.74% | 5.23% | 53 | 7.31% | |||||||||||||||||||||||||||||||||||||||||||||||||||||||||||||||||||||||||||||||||||||||||||
 | ...> Air Fryers | Ninja | 159.4K | 20.49% | 6.76% | 0.57% | 71 | 1.50% | |||||||||||||||||||||||||||||||||||||||||||||||||||||||||||||||||||||||||||||||||||||||||||
 | ...> Air Fryers | Ninja | 156.2K | 35.67% | 5.83% | 6.95% | < 50 | 16.18% | |||||||||||||||||||||||||||||||||||||||||||||||||||||||||||||||||||||||||||||||||||||||||||
| ...> Air Fryers | Ninja | 189.4K | 36.97% | 6.36% | 5.09% | 78 | 9.69% | |||||||||||||||||||||||||||||||||||||||||||||||||||||||||||||||||||||||||||||||||||||||||||
| ...> Desk Chairs | YONISEE | 168.9K | = | 8.73% | 0.33% | < 50 | 8.76% | |||||||||||||||||||||||||||||||||||||||||||||||||||||||||||||||||||||||||||||||||||||||||||
| ...> Bean-to-Cup Coffee Machines | Sage | 166.2K | 81.61% | 5.74% | 5.23% | 53 | 7.31% | |||||||||||||||||||||||||||||||||||||||||||||||||||||||||||||||||||||||||||||||||||||||||||
| ...> Air Fryers | Ninja | 159.4K | 20.49% | 6.76% | 0.57% | 71 | 1.50% | |||||||||||||||||||||||||||||||||||||||||||||||||||||||||||||||||||||||||||||||||||||||||||
| ...> Air Fryers | Ninja | 156.2K | 35.67% | 5.83% | 6.95% | < 50 | 16.18% | |||||||||||||||||||||||||||||||||||||||||||||||||||||||||||||||||||||||||||||||||||||||||||
What’s selling—and why Explore the top-performing products on Amazon based on product views, sales, and revenue.Spot trends, category winners, and emerging bestsellers at a glance. | |||||||||||||||||||||||||||||||||||||||||||||||||||||||||||||||||||||||||||||||||||||||||||||||||||