5月3日 的 G-NetView Pro 應用程式分析
G-NetView Pro
- GyokovSolutions
- Google Play 商店
- 付費
- 工具
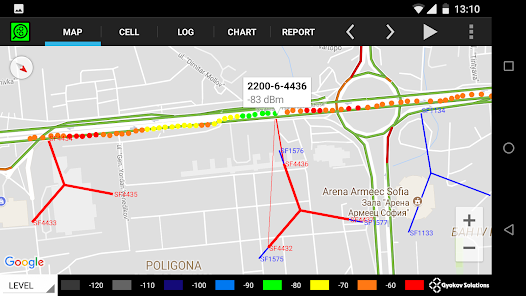
G-NetView Pro is an Android app for viewing and analyzing G-NetTrack logfiles.
This is one-time payment app. There are no monthly fees.
Features:
- logfile points visualization on map
- serving and neighbor cell lines visualization
- different thematic maps - LEVEL, QUAL, CELL, TECH, PCI/PSC/BSIC, SNR, BITRATE, SPEED, ALTITUDE, SERVING DISTANCE, SERVING BEARING, SERVING ANTENNA HEIGHT, ARFCN, TEST PING, TEST BITRATES, NEIGHBORS LEVEL, NEIGHBORS QUAL
- measurement point info
- measurements charts
- measurements histogram statistics charts
- export of measurement charts and statistics in html format to be viewed on desktop browser
- logfile player
- floorplan load for indoor measurements
IMPORTANT: Please note that to visualize serving and neighbors cell you need to load cellfile with cell locations. There is no magical way to guess exact cell locations.
How to use:
1. Load site data - the sites are loaded from cellfile.txt that is in folder G-NetView/celldata. Put your cellfile in this folder. On app install there is a sample cellfile.
2. Load logfile - select your text logfile to open it. In folder G-NetView/celldata there is a sample test_logfile.txt.
3. Use buttons to play logfile or select a point to see measurements.
4. In LOG tab you can see measurements for selected point.
5. In CELL tab you can view information for serving or manually selected cell.
6. In CHART tab you can view the measurement charts. Use buttons to move or zoom.
7. In REPORT tab you can see the measurement statistics charts.
G-NetView Pro 使用排名
基於 Similarweb 的算法,根據過去 28 天的安裝數和活躍用戶數進行計算。
所有類別 在
德國--
工具 在
德國--
5月 3, 2026