


Top Web Analytics Tools: Prepare Your Performance Measurement For 2026
Digital marketing measurement in 2026 is going to be more challenging than ever. And we all know what caused it: Generative AI.
Generative AI exploded in 2025. Usage is climbing through the roof (with ChatGPT alone surpassing 7 billion monthly visits), and consumer journeys now begin in chatbots, voice assistants, and AI overviews rather than traditional SERPs.
These systems surface snippets of information and citations, but users click website links only ~8% of the time. Meanwhile, competitive landscapes shift faster. New competitors appear from adjacent niches, and your “mental list” of rivals quickly becomes outdated.
To succeed, marketers need more than basic traffic counts. They must measure reality, understand their market position, make their content visible to search engines and answer engines, and answer user queries.
This article updates my “Top Web Analytics Tools” for 2024 and looks ahead to 2026. Aside from updating it with the latest features and price tiers, I also added a new criterion: AI visibility.

It’s meant to help you choose the right web analytics software for your business by learning the strengths, weaknesses, and coverage areas of each of the top 10 tools.
At the end, you’ll know how to prepare your measurement stack for a holistic coverage of all traditional traffic, engagement, and conversion metrics, as well as new ones like Influence Score and Citation Share.
What is first‑party vs. third‑party analytics?
Web analytics platforms collect and analyze data on visitors and their behavior so you can improve ·key metrics like conversion rates, traffic sources, and audience demographics.
Traditional first‑party tools track users directly on your site, while third‑party tools aggregate data from broader sources to show how competitors perform.
In 2026, both types remain important:
- Understand your marketing strategy: Data reveals what resonates with your audience so you can focus on the tactics that drive ROI.
- Benchmark against competitors: With markets changing rapidly, you need to know whether you’re gaining or losing share, and which channels actually drive growth.
- Monitor AI‑driven discovery: Generative engines and answer engines prefer content that is clear, structured, and authoritative. AI Analytics tools help you monitor whether your pages are being surfaced and adjust your content accordingly.
| Type of analytics tool | Description and role | Example benefits |
| First‑party (on‑site) analytics | Tools installed on your website or app. They track individual users, events, and conversions in real time. | Reveal how users interact with your content, which features drive engagement, and where users drop off, enabling you to optimize the experience. |
| Third‑party (off‑site) analytics | Platforms that aggregate data from millions of websites, apps, and data partners. They provide market‑level insights beyond your own properties. | Benchmark your performance against competitors, discover which channels are working for them, and identify rising threats or emerging niches. |
Combining both gives you a 360‑degree view: you’ll know what users do on your site, and you’ll see how you stack up across the broader market.
A new layer of third‑party analytics: AI visibility
The traditional two‑layer framework (first‑party analytics for your own site and third‑party competitor intelligence for the broader market) misses a critical piece of the 2026 landscape: how often generative AI systems reference your brand?
Generative search experiences from Google’s AI Overviews to ChatGPT pull snippets from websites and display them as answers. These systems only cite your pages if your content is authoritative and well-structured.
Measuring this behavior requires a new category of off‑site analytics that reports how frequently your pages appear in AI answers and which prompts trigger mentions or citations.
When evaluating analytics platforms, look for solutions that include AI‑visibility metrics. Many traditional web analytics tools still lack this capability. As generative engines continue to affect user journeys, expect AI‑visibility analytics to become a core component of the web analytics toolkit.
What are the core AI visibility metrics you need to measure?
Modern marketing requires tracking AI visibility KPIs alongside traditional KPIs. The following metrics help marketers understand how their brand appears in generative answers and where to focus improvement efforts:
- Brand visibility score: How often your brand is mentioned in AI‑generated answers relative to all answers.
- Brand mention share: Your share of total brand mentions across generative answers compared with competitors.
- Topical and prompt coverage: Your brand’s presence within specific topics and prompts.
- Domain influence: Your domain and URL authority within AI‑generated answers.
- Citation share: How frequently your domain is cited relative to other sources.
- Sentiment distribution: shows the balance of positive, neutral, and negative sentiment for your brand in AI‑generated answers.
These metrics provide insight into both the quantity and quality of your brand’s presence within generative AI ecosystems.
Now, let’s dive into the top web analytics tools you need to prepare yourself for 2026.
Top web analytics tools for 2026 (free + paid)
Below is an updated overview of the leading web analytics platforms. Each entry highlights key features, integrations, pricing, and notes on AI‑visibility capabilities. Remember that pricing may vary by region and volume, so it’s best to always check the vendor’s latest plans.
1. Similarweb
Similarweb remains a top choice for competitive intelligence and generative AI intelligence. Its website, app, and AI visibility analytics platform let you analyze any site or app and compare key metrics across industry players. 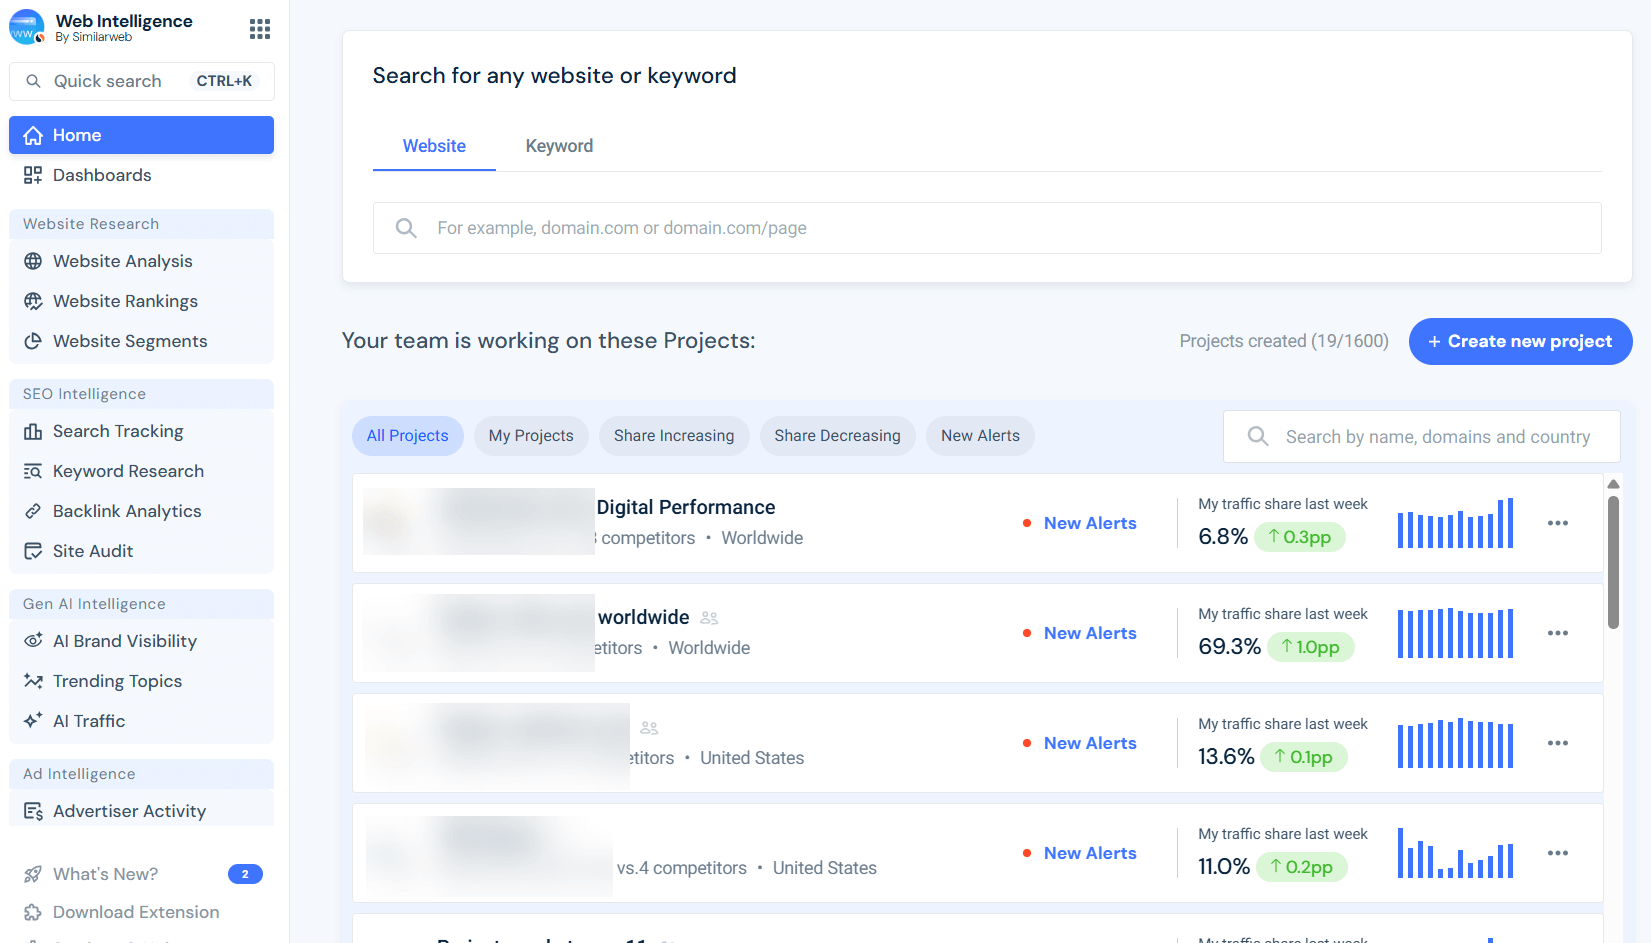
Key features in 2026 include:
- AI Search Intelligence: Similarweb’s 2025-26 releases include reporting on all AI traffic and visibility metrics, helping you measure your visibility in AI-powered search results and generative engines.
- Web traffic Intelligence: Identify which channels send the most valuable traffic to your website, and to competitors. Uncover opportunities to increase your traffic and market share.
- Keyword per traffic source analysis: Analyze organic and paid keywords driving traffic to any site.
- Audience and engagement metrics: Track how visitors engage with pages and content.
- Audience demographics and interests: See who is visiting your competitors, where they are located, and what interests they share.
- App usage metrics: Track and analyze MAU/DAU of any app, access real user ratings and reviews, installation stats, and more.
- Retail Intelligence: Shows you the user journey from initial search to purchase and pricing across Amazon and other marketplaces, allowing you to track cross-platform sales and performance.
AI visibility tracking abilities:
Similarweb offers a dedicated suite of tools for AI visibility measurement. It tracks your brand visibility and competitors, and shows them side by side.
Main metrics available: Visibility score, brand mention share, topical coverage, prompt coverage, domain & URL influence, citation share, and sentiment distribution across generative AI platforms.
These metrics show how often your brand appears in AI answers, which sources and prompts drive mentions, and whether sentiment is positive, neutral, or negative. You can use these insights to benchmark against competitors and improve your brand’s visibility in generative search.
Integrations:
Many integrations are available with cloud services, data platforms, and CRM platforms. For example:
- AWS
- Google Looker Studio
- PowerBI
- Google Sheets
- SalesForce
- Tablaeu
- Hubspot
The datasets are also available via API and an MCP server. Similarweb offers a DaaS (Data as a Service) solution dedicated to addressing all bulk data customer needs.
Pricing:
- Free trial: Yes. A full set of free tools to check website traffic, app usage, top websites lists, keyword research, and more.
- Pro packages: Available starting $125 per month. A 7-day free trial period is available.
- Gen AI Intelligence package: Available starting $99 per month. A 7-day free trial period is available.
Who is Similarweb best for?
Similarweb’s recently launched Gen-AI Intelligence suite completes its holistic coverage of search optimization needs, making it the best choice for SEO experts who now require 360° coverage of SEO, AEO, and GEO tools in one platform.
Its competitive analytics data is considered the most accurate of all third-party analytics and is valuable for businesses of all sizes across many industries.
Small teams can explore the free tier to benchmark competitors without paying for enterprise features, while large companies can integrate the premium API into BI dashboards.
Because its massive datasets and user panels make it the most accurate third-party analytics, Similarweb complements first‑party tools rather than hindering or replacing them.
Privacy & compliance:
Similarweb aggregates anonymized data from multiple sources. It does not provide personally identifiable information. Always verify your use complies with local privacy laws and avoid ingesting personal data into third‑party platforms.
Pros, cons & my POV:
From my perspective, Similarweb offers a slick interface and broad competitive intelligence for web, app, and AI visibility. I can quickly benchmark competitors’ traffic, analyze keywords and channels, and audit my website or my backlink profile.
The new AI‑visibility suite shows how often my brand appears in generative answers vs my competitors, how often my domain is cited in AI answers, and the exact sentiment for my brand per topic.
Similarweb’s Pros:
- The most extensive web, app, and AI visibility datasets.
- Data synthesis methodologies that ensure the most accurate data from all third-party analytics
- All in one full-stack SEO, AEO, and GEO capabilities.
- API and MCP access for bulk data analysis.
- AI Studio.
- Constant additions and improvements to the platform and datasets.
Similarweb’s Cons:
- Similarweb’s massive datasets and breadth of features can be overwhelming at first.
- The Gen-AI suite (like most other tools in the niche) misses a few metrics SEOs can use for AI search optimization, like prompt intent and topical search volume (rumored to be added soon).
- In the past, the platform’s prices were considered high. However, Similarweb has completely changed its package structures and now offers very competitive pricing, even for the Gen AI Intelligence suite ($99/month).
Overall, I see Similarweb as the leader in market and AI‑visibility insights. Just as it led new frontiers in traffic and competitor intelligence, it’s now creating a lead in Gen AI through rapid feature releases and data upgrades.
Since I started using it, I’ve hardly needed any other tools, but I still complement it with on‑site tools for granular user and conversion data.
2. Google Analytics (GA4)
Google Analytics (GA4) remains the default first‑party analytics tool. It tracks user behavior, demographics, acquisition channels, and conversion paths. In 2026, GA4 continues to evolve with privacy‑enhanced measurement and predictive AI insights.
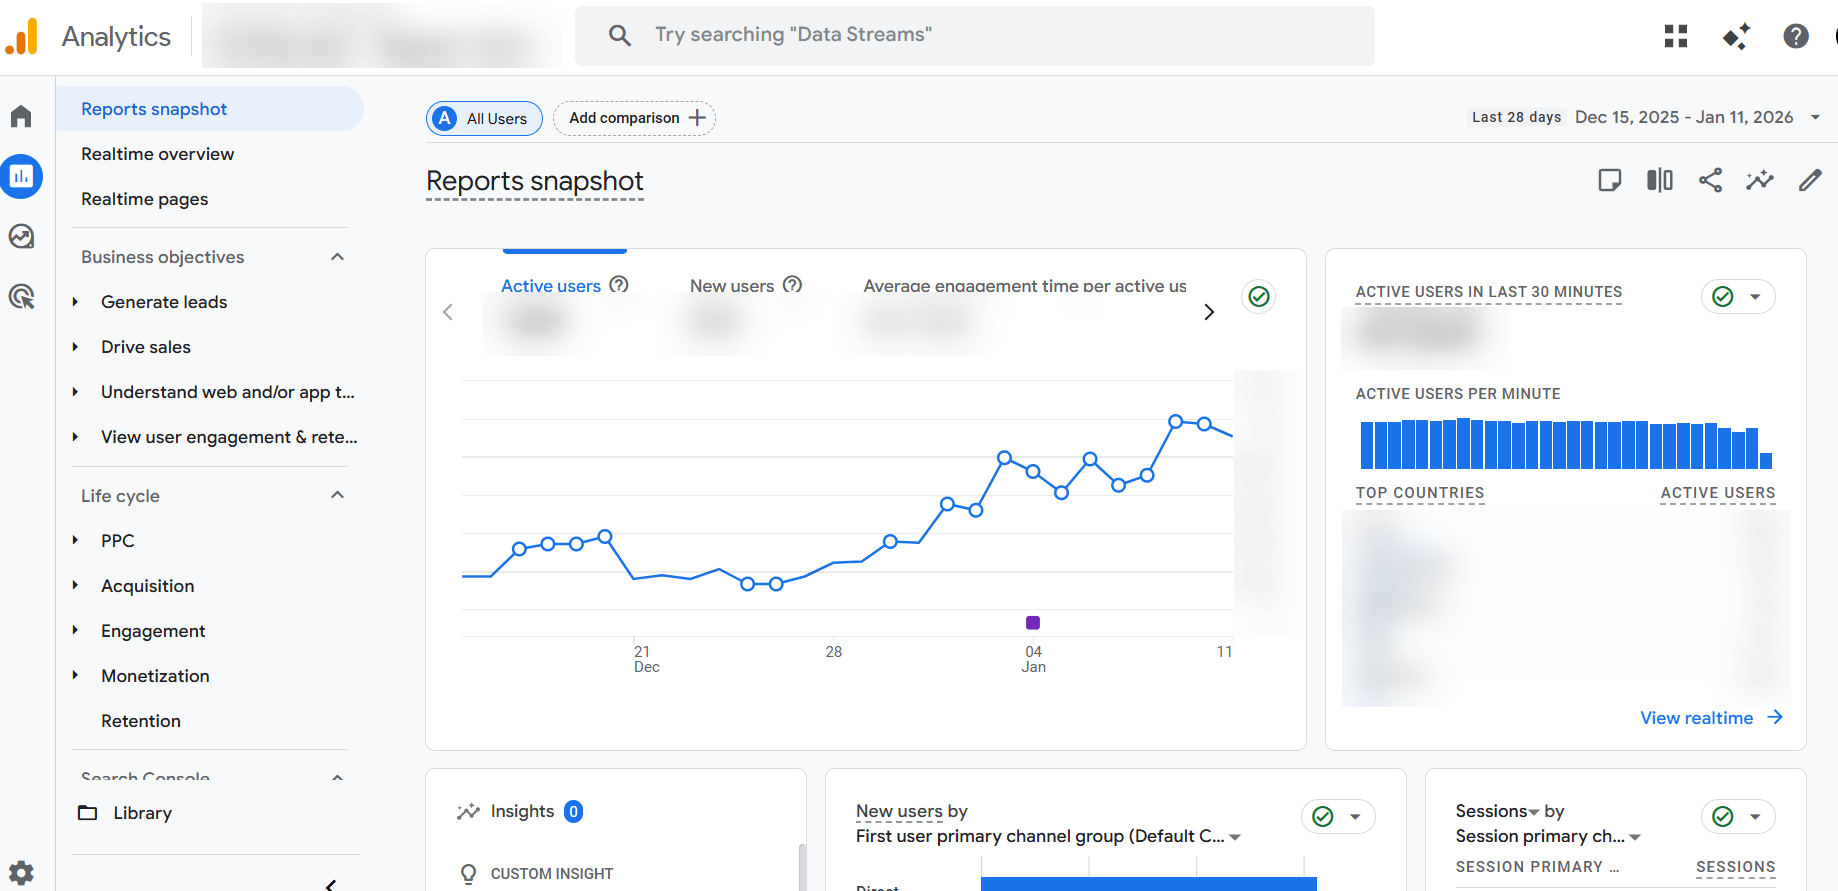
Key features include:
- Real‑time reports and engagement metrics: show how users arrive on your site and what they do there.
- Monetization reports: help you understand revenue by channel.
- Predictive metrics: leverage machine learning to forecast purchase probability and churn.
- Audience for remarketing: allows you to build targeted advertising segments across Google Ads.
AI visibility metrics:
GA4 focuses on on‑site analytics and does not provide dedicated AI visibility or citation metrics. However, by using a set of REGEX filters, you can track AI traffic in GA4. This method provides partial coverage of AI engines’ performance.
Marketers seeking metrics like brand visibility score or citation share should pair GA4 with third‑party solutions (such as Similarweb’s AI Brand Visibility tools) to understand how often their brand appears in AI‑generated answers.
Integrations:
GA4 integrates seamlessly with many platforms. For example:
- Google Ads
- Google Looker Studio
- Hotjar
- Cloudflare
- Salesforce
- BigQuery
Pricing:
- Free plan: Yes. GA4’s standard version is free.
- Enterprise plan: Google Analytics 360 for enterprises starts around $50,000 per year
Who is GA4 best for:
GA4 covers the traditional monitoring and analysis needs of many disciplines, from marketers to analysts and market researchers. However, AI-first businesses might not be able to extract actionable insights from it or accurately track their performance.
Its free tier is suitable for small and medium‑sized businesses (73% of Google Analytics users are small companies (fewer than 50 employees)). Enterprises that require service‑level agreements and massive data volumes can upgrade to Analytics 360, priced for corporate budgets.
Privacy & compliance:
GA4 has faced scrutiny and bans in some European countries due to concerns about data privacy. Organizations operating in jurisdictions with strict privacy laws should evaluate whether the tool meets their compliance requirements or consider privacy‑first alternatives.
Pros, cons & my POV:
In my experience, GA4 is a powerhouse for free on‑site analytics. Its event‑based model and customizable events let me measure micro‑interactions, build sophisticated audiences, and track users across web and app sessions.
GA4 Pros:
- AI‑powered predictive metrics for churn and revenue.
- Robust privacy controls.
- Free (almost) unlimited use.
- Easy Google Ads integration.
GA4 Cons:
- The interface is not intuitive.
- Steep learning curve and confusing navigation.
- Historical data from Universal Analytics doesn’t migrate,
- Custom reports are limited and
- Certain features remain in beta.
- No SEO metrics (i.e, search volume, keyword traffic, backlinks to page, site health)
- No AI visibility metrics.
- Conversion data discrepancies and inaccurate (sampled) traffic reports.
I use GA4 for basic site analytics and integrations with Google Ads, but rely on other tools for competitor intelligence and AI‑visibility data.
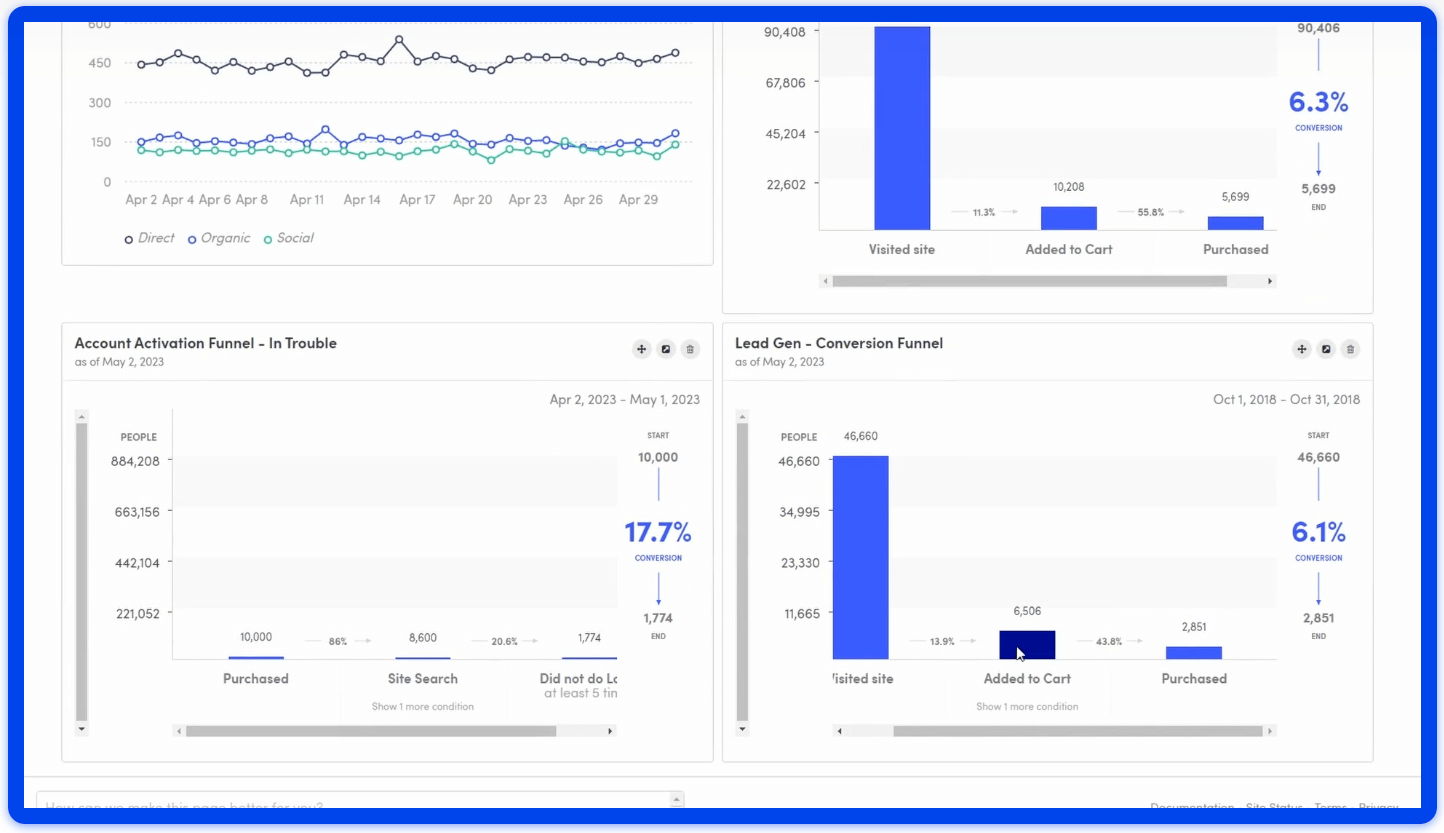
3. Mixpanel
Mixpanel is a first-party product analytics platform that tracks user interactions (events) on websites and mobile apps. It helps teams understand where users get stuck and which features drive engagement and retention.
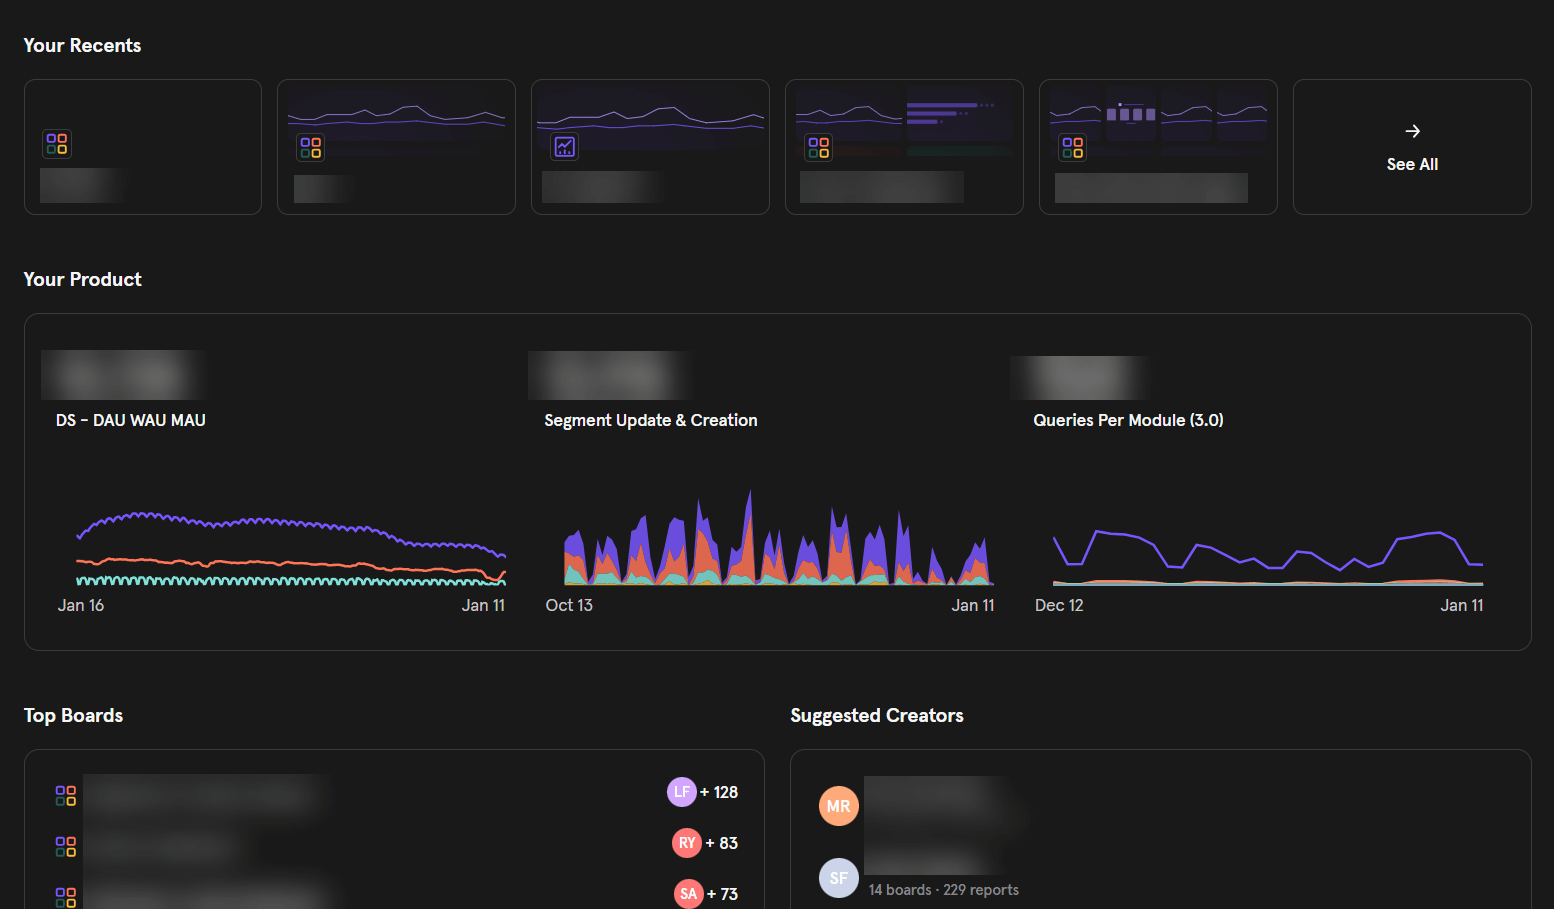
Key features include:
- Event‑based tracking: each action a user takes is an event, allowing granular segmentation by custom properties.
- Funnels and cohorts: analyze conversion funnels, retention cohorts, and user journeys.
- Interactive dashboards and reports: create custom charts without SQL.
Integrations:
Mixpanel connects with cloud services, marketing tools, and design platforms. For example:
- Google Cloud
- Braze
- Sprig
- Figma
Pricing:
- Free plan: Yes. Core analyticsare free.
- Premium plan: starts at $28 per month
AI visibility metrics:
Mixpanel specializes in product and event analytics and does not include AI visibility, citation, or sentiment metrics. To measure generative search presence, you’ll need a complementary third-party AI‑visibility tool.
Who is GA4 best for?
Mixpanel is popular among product teams at startups and mid‑sized SaaS companies because of its granular event tracking and affordable entry‑level pricing.
Larger enterprises can benefit from Mixpanel’s cohort analysis, but may pair it with off‑site market intelligence tools for a broader view.
Privacy & compliance:
Mixpanel collects user event data via first‑party cookies. You can configure it to respect Do Not Track signals and anonymize IP addresses to comply with privacy regulations.
Pros, cons & my POV:
Mixpanel is great for product analytics and A/B testing. While ensuring tracking integrity can be a bit of a task, once done, it enables many tests and experiments. I mostly like the flexibility to segment users and analyze retention cohorts.
Mixpanel Pros:
- Excellent product analytics.
- The event‑based tracking and near‑real‑time processing allow drilling into user actions, building funnels, and testing experiments at scale.
- Software Advice reviewers praise its intuitive interface once you get the hang of it.
Mixpanel Cons:
- Mixpanel isn’t beginner‑friendly. Implementation can require a data engineer.
- The learning curve is steep and
- Event‑based pricing gets expensive as volume grows.
- Lacks in‑app feedback tools (I often pair it with Hotjar or other platforms).
Overall, Mixpanel is great for product teams with technical resources but less suitable for small marketing teams.
4. SERanking (AI Overviews Tracker)
SERanking began life as an SEO rank-tracking tool, evolved into an SEO (third-party) analytics platform, and recently added an AI Overviews Tracker and a visibility add-on. This marks their first steps into the AI visibility tools market.
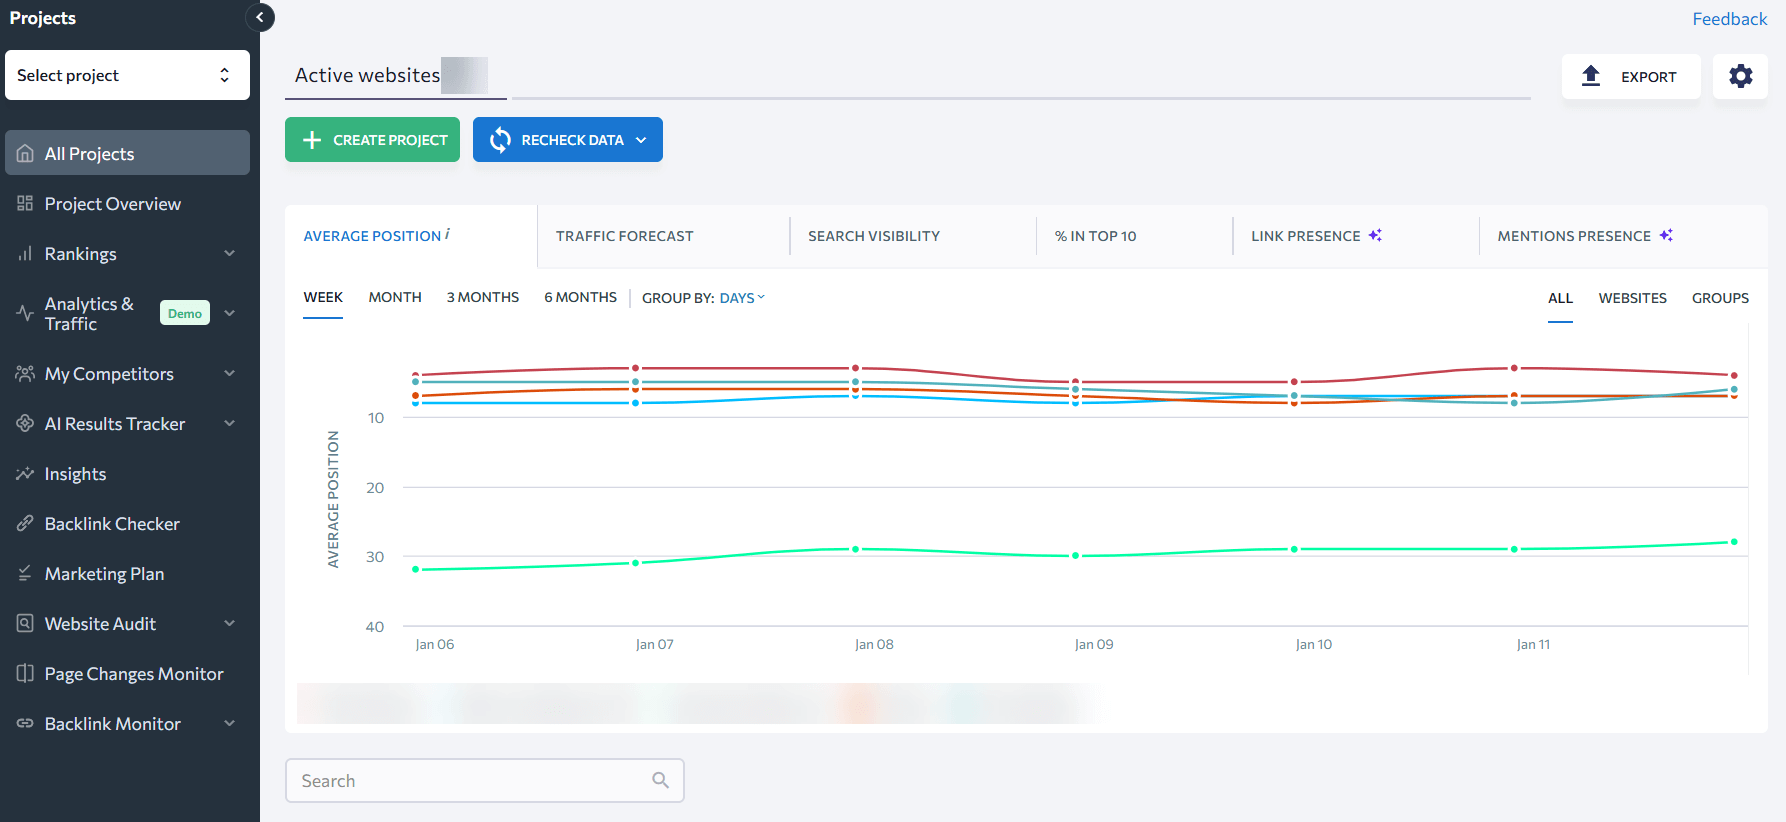
But how does this tool measure as an all-in-one web analytics platform? Let’s see.
Key features include:
- AI‑Overviews tracking: The add‑on scrapes Google’s AI Overviews across the USA and Europe. It shows which of your keywords trigger AI snippets.
- Intent analysis: A keyword‑intent module evaluates the search volume and intent behind queries that trigger AI Overviews.
- Organic metrics: Analyze organic metrics for each source in an AI snippet.
- Real‑time scraping & traffic estimation: SERanking scrapes AIO interfaces and saves cached snapshots. It also estimates the traffic your site could receive from AI-generated answers without requiring a CDN setup.
Integrations:
SERanking integrates with major search engines and custom reporting platforms.
- Google Analytics
- Google Search Console
- Looker Studio
- API
Pricing:
- Free plan: No. A free trial is available.
- Core SEO: Starts at $65 per month, excluding AI tracking and add-ons, and historical data.
- Pro plan: Starts at $119 per month, excluding AI add-on (starts at an extra $89/month)
AI visibility metrics:
SERanking’s tools report the number of keywords triggering AI snippets, your share of AI‑generated answers, domain and URL citations, and estimated traffic from generative search.
SE Visible extends these reports with sentiment analysis and competitor benchmarking. Coverage currently includes Google AI Overviews and ChatGPT, with additional engines like AI Mode and Perplexity planned.
Who is SERanking best for?
Agencies, founders, and in‑house marketers who already use extensive first-party analytics can use SERanking for SEO and add the AI‑visibility add‑on to complete their digital view. It’s an economical choice compared with enterprise analytics or buying separate SEO and AI tools.
Privacy & compliance:
SERanking is a SaaS platform based in the EU and publishes a detailed privacy policy. It collects account, payment, and usage data and processes it in accordance with GDPR and other regulations.
Because SERanking scrapes AI interfaces rather than ingesting personal data, it presents minimal privacy risks. However, always obtain consent when installing tracking scripts and exporting data.
Pros, cons & my view:
I like that SERanking scrapes AI results rather than relying on APIs, caches them for verification, and provides prompt‑level analysis. The fact that both SEO metrics and AEO metrics exist in the same place makes day-to-day optimization easier.
SERanking Pros:
- Pricing is reasonable.
- Unlimited seats make it accessible for teams.
- Real result scraping.
- Side-by-side metrics.
SERanking cons:
- The tool feels a bit fragmented: each feature has its own separate interface.
- Coverage is limited to Google AI Overviews and ChatGPT.
- UI has a steep learning curve.
In my view, SERanking is a promising hybrid solution, but not yet as polished as Similarweb’s Gen-AI data coverage and dashboards.
5. Kissmetrics
Kissmetrics focuses on user‑centric analytics. It tracks individual user behavior and attributes across devices so you can identify acquisition channels, high‑value features, and churn signals.
Key features include:
- User journeys: see how users navigate across channels and devices.
- Conversion and retention tracking: uncover what motivates customers to convert and what causes churn.
Integrations:
Works with billing platforms, content platforms, and call‑tracking platforms. For example:
- Appcues.
- Chargify.
- HubSpot.
- Magento.
- Help Scout.
Pricing:
- Free plan: No.
- Pay-as-you-go: Yes. Plan starts at $0+ and is charged per event.
- Bronze plan: $25.99 / mo (10K events, 1 seat).
- Silver plan: $299 / mo (2 million events, 3 seats).
AI visibility metrics:
Kissmetrics is designed for conversion and retention analytics. It lacks features for tracking AI‑generated citations, brand visibility, or sentiment. Consider pairing it with a dedicated AI visibility tool for generative search insights.
Who is Kissmetrics best for?
Kissmetrics is well‑suited for ecommerce and SaaS businesses that need to track user journeys across devices.
Its pricing makes it less accessible to small businesses, but it may fit startups and mid‑sized firms. Larger enterprises may prefer the deeper integrations offered by Adobe Analytics or GA 360.
Privacy & compliance:
Kissmetrics relies on cookies to track individual users. Ensure user consent is obtained where required and that cookie settings comply with GDPR and other privacy regulations.
Pros, cons & my view:
Kissmetrics focuses on cohort and funnel analytics. It lets me track how users move through checkout or onboarding flows and see how behavior changes over time, including across devices.
Kissmetrics Pros:
- Powerful checkout tracking abilities
- Behavioral analytics helps identify drop‑off points and improve retention.
Kissmetrics Cons:
- The interface feels outdated.
- Reports aren’t real‑time.
- The learning curve is steep. Kissmetrics reviews note that it can take significant time to master, which makes it less appealing for small teams without dedicated analysts.
I use Kissmetrics for deep user journeys, but newer tools are more intuitive.
6. Hotjar
Hotjar provides visual behavior analytics using heatmaps, session recordings, and feedback widgets to show how visitors interact with your pages.
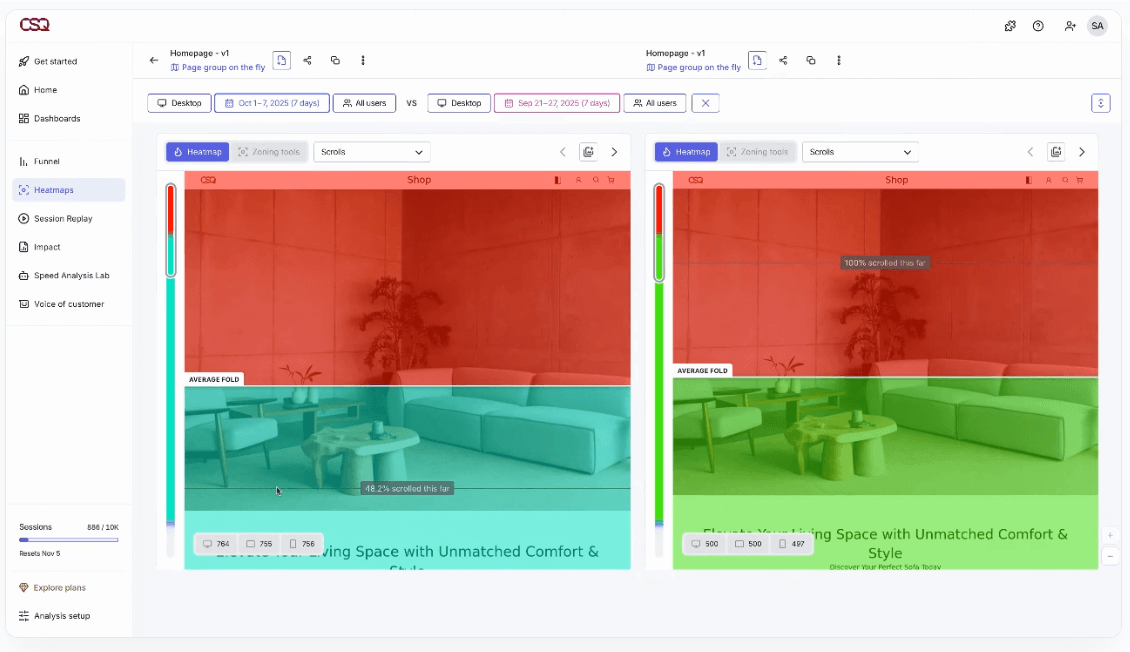
Key features include:
- Heatmaps show clicks, taps, and scroll depth.
- Session recordings let you replay user sessions to understand friction points.
- Engagement zones and sentiment analysis help prioritize UX improvements.
Integrations:
Hotjar integrates with:
- Slack.
- Microsoft Teams.
- Google Analytics.
- Zapier.
- Jira.
- HubSpot.
Pricing:
- Free plan: Yes. The basic plan is free.
- Growth plan: starts at $49 per month (7k sessions, AI assistant, 13‑month data).
AI visibility metrics:
Hotjar provides qualitative behavioral analytics (heatmaps, recordings, and feedback), but it lacks features that can help you understand your brand’s AI citations or brand visibility. Marketers need external AI visibility tools to evaluate their presence in generative answers.
Who is Hotjar best for?
Hotjar is particularly useful for small and medium‑sized businesses that want to improve user experience without investing in enterprise‑level UX platforms. Its visual tools are ideal for marketing teams, product managers, and designers.
Privacy & compliance:
Hotjar provides built‑in features to suppress keystrokes and mask personally identifiable information. Always configure your site to prevent sensitive data from being recorded during session replays.
Pros, cons & my view
Hotjar is my go‑to tool for qualitative UX insights. Its heatmaps and session recordings show exactly where users click, scroll, and hesitate.
Hotjar Pros:
- The interface is intuitive and quick to set up.
- Users can launch surveys and feedback polls within minutes.
- Their heatmap feature is unbeatable.
Hotjar Cons:
- The tool lacks advanced quantitative reports.
- Customer support can be slow.
- Reviewing endless session recordings can be overwhelming and doesn’t scale for high‑traffic sites
Overall, Hotjar is not a replacement for comprehensive analytics. I recommend Hotjar as a complement to GA and Similarweb rather than a standalone analytics solution.
7. Matomo
Matomo (formerly Piwik) is an open‑source analytics platform that prioritizes data privacy and ownership.
Key features include:
- Conversion optimization tools: heatmaps, session recordings, form analytics, goals, and A/B testing.
- Visitor profiles: evaluate every action each visitor takes.
- Privacy compliance: Matomo can be self‑hosted, ensuring control over data and compliance with regulations such as GDPR.
Integrations:
Works with over 100 CMSs and platforms, including:
- WordPress
- Drupal
- Joomla.
Pricing:
- Free plan: Yes. The self‑hosted version is free
- Cloud hosting: starts at €22 per month.
AI visibility metrics:
Matomo prioritizes privacy and data ownership, but it lacks AI brand visibility and citation analytics. To monitor AI‑generated mentions and sentiment, integrate a specialized AI visibility solution.
Who is Matomo best for?
Reviewers recommend Matomo for small to medium‑sized businesses that need in‑depth analytics without the complexity of GA4.
A 2025 TrustRadius review notes that it’s robust and easy to set up, making it ideal for SMBs. Larger companies that require deeper Google integrations may prefer GA4.
Privacy & compliance:
Matomo’s open‑source nature lets you self‑host and retain full control over data. Reviewers highlight its ability to anonymize IP addresses and provide one‑click opt‑out functionality, making GDPR compliance straightforward.
Pros, cons & my view:
Matomo stands out for privacy and data ownership. By self‑hosting, I control all analytics data and avoid third‑party sampling.
Matomo Pros:
- Unlimited data retention.
- Full customization.
- Self-owned data.
Matomo Cons:
- Setup is complex.
- Some advanced features are behind a paywall.
- The interface can feel cluttered, and
- Technical resources are needed to maintain it.
I use Matomo mostly as backup, but also when privacy is paramount. For quick insights, I prefer simpler SaaS tools.
8. ZipTie
ZipTie is an AI‑search visibility platform focused solely on generative engine monitoring and content optimization. Instead, it scores your presence across AI answers and suggests how to improve visibility. The platform doesn’t offer other SEO tools and isn’t focused on web analytics.
Key features include:
- AI success score: A score combining mention frequency, citation quality, and sentiment
- Competitor benchmarking: Trend dashboards reveal where rivals gain share and highlight unserved opportunities.
- Content optimization workflow: An optimization module that analyzes AI answers, and recommends specific changes to content, like word counts, entity density and section order.
- Query generator & AI assistant: Generate relevant prompts from your website URLs or import queries from Google Search Console. An AI assistant suggests new queries and surfaces hidden topics.
Integrations:
ZipTie focuses on AI search rather than web analytics. It exports data in CSV format and supports connecting to Google Search Console to import queries. There are no deep integrations with CRM or BI tools.
Pricing:
- Free plan: No. A free trial is available.
- Basic plan: $69 per month for 500 AI search checks, 5 AI data summaries, and 10 content optimizations.
- Pro plan: $159 per month with 2,000 checks, 100 summaries, and 200 optimizations
AI visibility metrics:
ZipTie reports on AI success score, share of voice across engines, citation count, sentiment, and AI‑specific keyword coverage. It also provides screenshots of AI answers, competitor visibility comparisons, and optimization recommendations.
However, it doesn’t track traffic or integrate with traditional SEO analytics. Its scope is limited to AI search.
Who is ZipTie best for?
ZipTie suits content teams that want guidance for ranking in AI answers without investing in broader SEO suites. It’s particularly useful for organizations prioritizing AI Overviews and ChatGPT coverage.
Companies requiring multi‑engine tracking beyond three engines or integrated SEO may prefer Similarweb or SERanking for wider coverage.
Privacy & compliance:
ZipTie’s privacy policy states that it processes only minimal personal data, complies with GDPR, and acts as the data controller. Because it monitors AI responses rather than users, privacy risks are low, but you should review data‑handling policies before uploading any proprietary information.
Pros, cons & my view:
ZipTie is a niche tool laser‑focused on AI search visibility. I like its descriptive dashboards, granular filters, and AI Success score.
ZipTie Pros:
- The AI Success Score helps summarize performance across AI engines.
- Offers content optimization workflows.
- Offers an AI assistant that generates queries and highlights opportunities.
- Testimonials from content experts highlight its intuitive interface and actionable insights.
ZipTie Cons:
- Low tracking scope: ZipTie tracks only three answer engines and doesn’t provide conversation transcripts or sentiment analysis
- High costs: Pricing is credit‑based and can be complex.
- Heavy users may experience processing delays and data gaps.
I used to use ZipTie (and liked it a lot) when I just started looking into AI‑visibility optimization, but I soon realized I needed broader analytics tools for comprehensive coverage.
9. Adobe Analytics
Adobe Analytics is a premium first-party analytics platform used by enterprises for real‑time and historical insights.
Key features include:
- Advanced segmentation and real‑time data visualizations help marketers identify trends and segment audiences.
- Machine-learning-powered analysis: Adobe Sensei surfaces anomalies and provides predictions.
- Cross‑system workflows: integrate data from online and offline sources for comprehensive analysis.
Pricing:
- Free plan: No.
- Premium packages: Adobe publishes pricing upon request. Enterprise costs vary.
AI visibility metrics:
Adobe Analytics does not provide built‑in AI visibility reporting. Adobe’s answer is a separate LLM Optimizer add‑on that tracks agentic traffic and generative‑search citations.
In other words, you have to buy yet another module to see how often AI tools mention your brand, whereas competitors like Similarweb include these insights in their core packages.
Who is Adobe Analytics best for?
In my view, Adobe Analytics only makes sense for very large enterprises with deep pockets, operating in extra complex environments, with experienced analytics teams and a willingness to endure months of implementation.
For small and mid‑sized organizations, there are modern alternatives that deliver insights quickly, include AI visibility by default, and don’t lock you into opaque contracts.
Pros, cons & my view:
Adobe positions its analytics suite as an enterprise powerhouse. While undeniably powerful for complex data needs, my experience suggests this power comes with significant trade-offs. While the platform offers unsampled data and deep customization, that power comes at a high cost, with hidden modules and serious operational risks.
Adobe Analytics Pros:
- Customizable dashboards.
- Drag‑and‑drop analysis.
- Flexible segmentation.
- Automated reports.
- Supports advanced funnel visualization and alerts.
Adobe Analytics Cons:
- Complex customization and hidden modules: Building reports in Adobe Analytics requires mastering its proprietary eVars, props, and events. Simple conversion funnels demand knowledge of processing rules and classification hierarchies, and the tool doesn’t include A/B tests.
- Implementations often take 3 to 6 months, with certified consultants guiding the process and providing ongoing training to manage the steep learning curve.
- Opaque, high pricing: Adobe bundles analytics into broader marketing suites with annual contracts starting around $48,000 and escalating to $150,000-$350,000 depending on server calls, seats, and API limits.
- Hidden charges for data exports and API calls add 40-60% to the first‑year cost.
- Poor performance and usability: Adobe user reviews consistently complain about a steep learning curve, confusing navigation, and slow loading times.
- Privacy, compliance, and data‑leak concerns:
- Adobe Analytics is not HIPAA‑ready, and Adobe will not sign a Business Associate Agreement. Customers are prohibited from transmitting protected health information (PHI) through the platform.
- In September 2025, a performance‑optimization bug caused data leaks between organizations’ reports, corrupting 3-5% of collected data across multiple services and potentially exposing email addresses, session hashes, and on‑site search data.
- Questionable corporate focus: Adobe spent more than a year trying to buy design rival Figma for $20 billion. The failed acquisition cost Adobe a $1 billion termination fee, and analysts say it set the company’s product strategy back by two years.
Adobe’s ability to process unsampled data and build complex segments is undeniable, but those advantages are outweighed by its cost, complexity, and risk.
Every implementation I’ve seen has required months of configuration, specialized staff, and additional products for A/B testing and AI tracking. Combined with privacy gaps and recent data incidents, Adobe’s analytics suite can feel cumbersome compared to lighter, more agile modern alternatives.
I prefer solutions that are easier to deploy, more transparent on pricing, and secure by design.
10. Ahrefs
Ahrefs has expanded beyond backlinks and keywords into AI‑visibility analytics with its Brand Radar. The tool sits on top of the Ahrefs ecosystem, so you need a base plan before adding AI indexes. Brand Radar tracks your brand’s presence across generative‑AI responses and ties it back to search demand, web visibility, and social conversations.
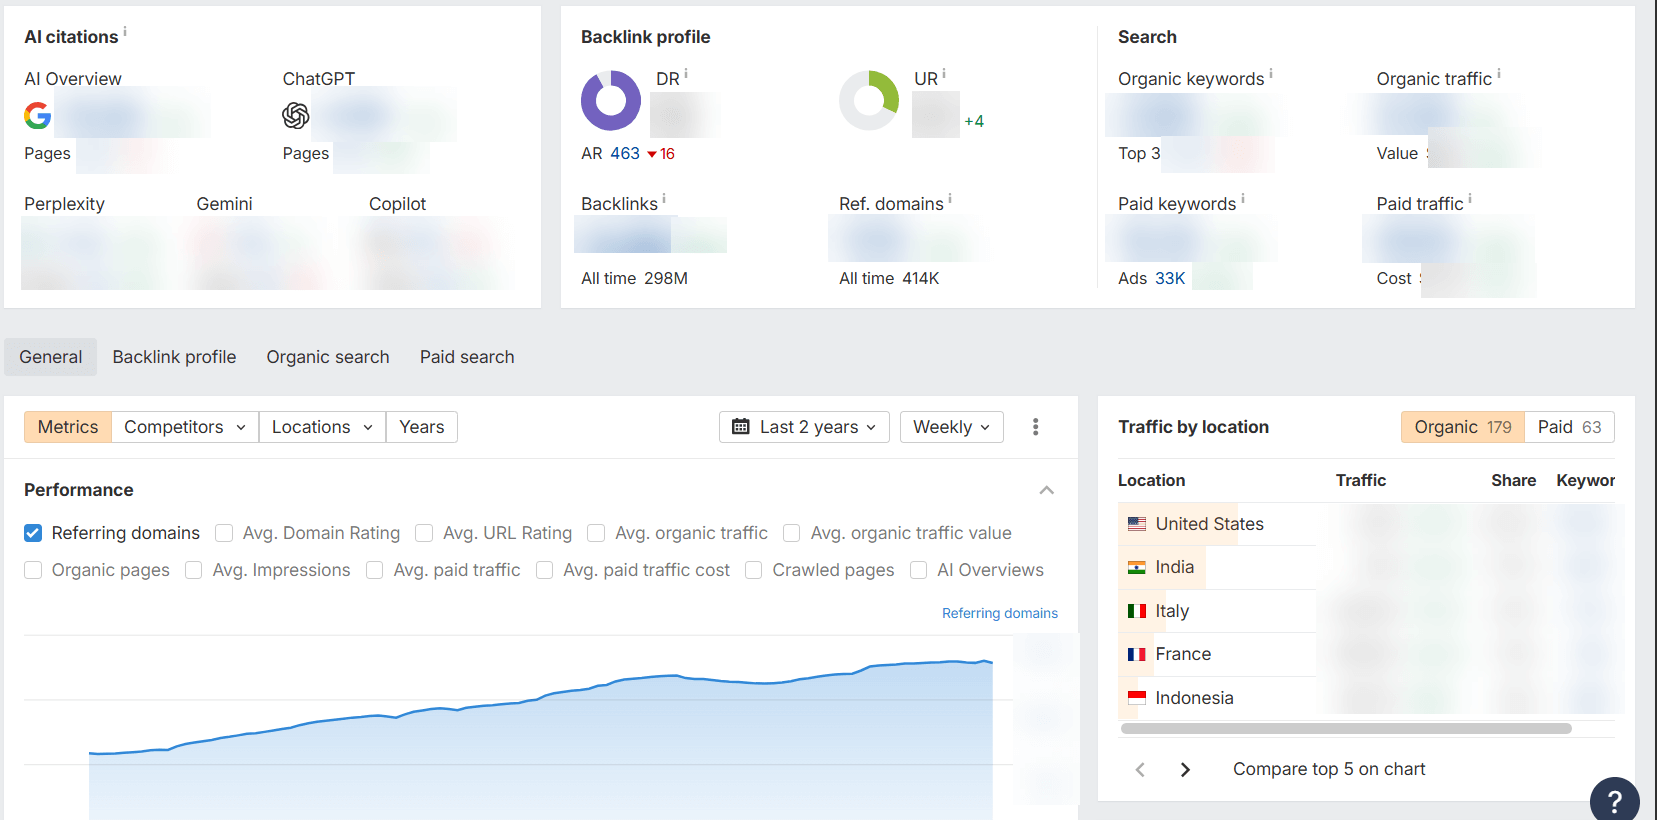
Key features:
- The core suite centers on SEO tools:
- Backlink analysis.
- Keyword research.
- Site audits.
- Its newer web analytics module offers lightweight, cookieless tracking but does not follow users across devices or days, and has limited segmentation.
- Brand Radar attempts to track AI visibility across Google AI Overviews, ChatGPT, and Perplexity, but it relies on a static prompt library and covers only three engines.
Pricing:
- Free Plan: No.
- Standard plan: $249/month (1 user). No free trial is available.
- Advanced Plan: $449/month (1 user). No free trial is available.
- Brand Radar: $199 per index (AI Overviews, ChatGPT, etc.). Access to all six AI platforms is $699 per month, and custom prompts start at $50 per month.
Integrations:
The SEO suite Integrates with:
- Google Search Console
- Looker Studio
- GA4
AI visibility metrics:
Brand Radar: Tracks mentions across AI Overviews, ChatGPT, and Perplexity but lacks prompt‑level detail, sentiment scoring, and citation context. Under‑reporting and limited sampling undermine accuracy. There is no centralized dashboard or competitor leaderboard.
Who is Ahrefs best for?
Ahrefs remains suitable for large agencies and enterprises focused on SEO who can afford high subscription costs. It’s ill-suited for small businesses, teams that need multi‑channel analytics, or marketers seeking robust AI‑visibility insights.
Privacy & compliance
Ahrefs web analytics boasts a cookie‑less design but doesn’t track users across sessions and collects only anonymized events.
A notable caution: connecting Ahrefs web analytics and Google Search Console gives Ahrefs access to your precise traffic data, which some users view as a privacy risk.
There’s no clear information about HIPAA compliance or external privacy certifications.
Pros, cons & my view:
Ahrefs Pros:
- Massive backlink and keyword database for SEO.
- Free web analytics up to 1 million events.
- Brand Radar consolidates search demand and web‑mention data in one place.
Ahrefs Cons:
- Limited scope:
- Only organic search data.
- Web Analytics lacks segmentation.
- Brand Radar omits prompt‑level tracking, sentiment, and citation context and under‑reports AI mentions.
- High costs:
- Plans start at $129/month with strict limits.
- add‑ons pile on $99-$200 per month.
- AI modules cost $99-$199 per engine or index.
- Data reliability & support issues:
- Users report misleading traffic estimates and that tracking for niche keywords has stopped.
- Recent reviews cite system errors, inconsistent data vs. Google Search Console, and AI‑generated support responses.
- Privacy concerns: Giving Ahrefs access to your GSC data means they know your true traffic, which could be used for competitive insights.
From my POV, Ahrefs is still a powerful backlink tool, but it has become expensive and limited for comprehensive analytics. Its new web analytics module is still maturing, and Brand Radar currently lacks essential AI‑visibility features.
For multi‑channel data and integrated AI metrics, Similarweb remains a better value vs. Ahrefs with broader coverage and transparent pricing.
Beyond traditional analytics: why competitor intelligence matters
Web analytics tools measure your own traffic and user behavior, but market intelligence tools show how you compare to others. Without accurate competitor data, marketers cannot see where competitors are gaining share or which channels are emerging.
For example, traffic from generative AI platforms is still under 1% in many verticals, yet each AI‑generated answer can drive up to 5 additional visits within the next hour.
Without competitor intelligence, you might dismiss AI referral traffic as tiny when it actually shapes awareness and demand.
Actionable tips:
- Identify your true market: define the category and geography you care about, then use third‑party data to map competitors and rising players.
- Benchmark traffic share and growth: measure your share of visits relative to competitors and track year‑over‑year changes.
- Find rising threats and opportunities: look for smaller competitors growing faster than the category and adjust your strategy accordingly.
User reviews & satisfaction scores
Independent review platforms provide valuable insight into how real users perceive different analytics tools. Here are a few notable ratings and themes from recent reports:
Similarweb reviews & satisfaction scores:
Among competitive‑intelligence platforms, Similarweb scores consistently high. G2 lists 4.5 stars out of 5 based on more than 1,000 reviews, and G2’s 2026 grid report lists a 92% likelihood to recommend with an AI‑powered recommendation ranking.
Capterra users rate it 4.6/5 overall, with 4.6/5 for ease of use. Similarweb reviewers praise its extensive competitive and keyword data, its ability to benchmark traffic trends, and its unique AI‑traffic reports that provide visibility into generative AI referrals.
Some note that data accuracy for very small sites can lag, but overall sentiment positions Similarweb as the market leader for competitor intelligence and AI visibility.
Google Analytics (GA4) reviews & satisfaction scores:
On the G2 review platform, Google Analytics holds an average rating of 4.5 out of 5.
The tool’s widespread adoption and free tier make it popular with businesses of all sizes (73% of GA users are small companies).
Mixpanel reviews & satisfaction scores:
SoftwareReviews’ 2025 product scorecard reports a composite score of 7.9/10 and a customer experience (CX) score of 8.1/10 for Mixpanel. Ninety‑seven percent of respondents expressed positive sentiment toward Mixpanel, praising its flexibility and ability to help them innovate.
Matomo reviews & satisfaction scores:
TrustRadius lists Matomo Analytics with a rating of 8.7/10. Reviewers appreciate its open‑source customization and user‑friendly reporting.
Ahrefs reviews & satisfaction scores:
Ahrefs’ user feedback is mixed. On G2, it averages 4.4/5 from 628 reviews, with 76% five‑star ratings. Reviewers there praise its SEO data, interface, and backlink tools.
Capterra shows a similar picture: an overall rating of 4.7/5, with an “ease of use” score of 4.2/5 and “value for money” of 4.4/5. TrustRadius rates the platform 9.1/10 (389 reviews).
However, the positive scores are tempered by widespread complaints about cost and usability:
- G2 reviewers note that Ahrefs’ credit‑based pricing and forced migrations to higher‑priced plans leave customers paying more for the same features.
- Trustpilot reflects this dissatisfaction: Ahrefs holds a 1.9/5 TrustScore, with reviewers expressing strong frustration regarding the credit-based pricing model. Many mention inaccurate data, inconsistent reports, confusing interfaces, and rigid or automated customer support responses.
- Some report being locked out of their accounts by an over‑zealous “suspicious activity” filter and receiving no assistance from support staff.
In short, while Ahrefs remains admired for its deep SEO database and advanced features, many users say the high price, complex credit model, and erratic support undermine its value.
ZipTie reviews & satisfaction scores:
There are no large‑scale ratings for ZipTie yet. A 2025 evaluation ranked ZipTie as the best AI‑visibility tool for content operations teams, noting its granular success scores and comprehensive optimization module.
Some reviewers caution that credit consumption can be high and that coverage is limited to three AI engines, but overall sentiment is positive.
Web analytics tools ratings comparison table
| Tool | G2 rating | Notes |
| Similarweb | 4.5/5 | High user satisfaction. Competitive intelligence & AI‑visibility leader. |
| Google Analytics (GA4) | 4.5/5 | Popular free tool with wide adoption. Lacks competitor and AI visibility metrics |
| Mixpanel | – | Praised for event analytics. 97% positive sentiment |
| SERanking | – | No aggregated ratings yet. |
| Kissmetrics | 4.1/5 | Cohort and funnel analytics. Dated interface and steep learning curve |
| Hotjar | 4.3/5 | Visual behavior analytics. Easy to use and set up |
| Matomo | – | Praised for privacy and customization |
| ZipTie | – | No aggregated ratings yet. |
| Adobe Analytics | 4.2/5 | Enterprise‑level segmentation. Extremely high cost and complexity |
| Ahrefs | 4.4/5 | User ratings are high, but reviews are very harsh. |
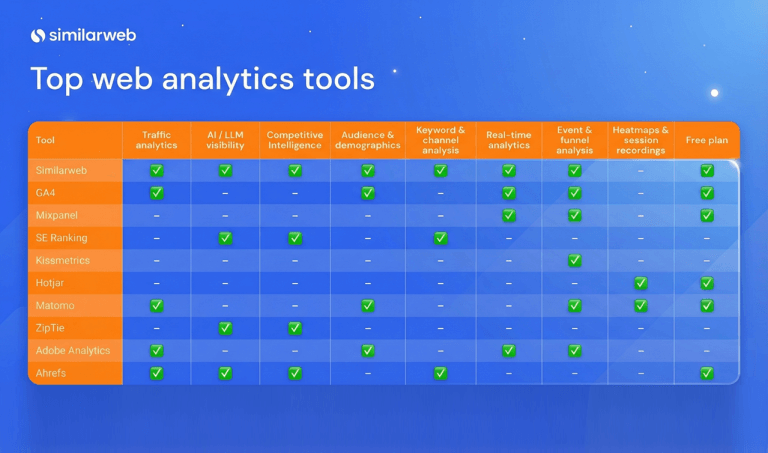
Feature coverage matrix
The matrix below compares key capabilities across the major analytics platforms. A check mark (✔️) means the feature is available, and a dash (-) means it is absent.
Features are ordered to follow a typical analytics workflow: first, you need traffic analytics to understand who is visiting your site, then AI‑visibility metrics to see how generative engines surface your content, followed by competitive intelligence and other specialized features.
| Tool | Traffic analytics | AI / LLM visibility | Competitive intelligence | Audience & demographics | Keyword & channel analysis | Real‑time analytics | Event & funnel analysis | Heatmaps & session recordings | Free plan |
| Similarweb | ✔️ | ✔️ | ✔️ | ✔️ | ✔️ | ✔️ | ✔️ | – | ✔️ |
| GA4 | ✔️ | – | – | ✔️ | – | ✔️ | ✔️ | – | ✔️ |
| Mixpanel | – | – | – | – | – | ✔️ | ✔️ | – | ✔️ |
| SERanking | – | ✔️ | ✔️ | – | ✔️ | – | – | – | – |
| Kissmetrics | – | – | – | – | – | – | ✔️ | – | – |
| Hotjar | – | – | – | – | – | – | – | ✔️ | ✔️ |
| Matomo | ✔️ | – | – | ✔️ | – | – | ✔️ | ✔️ | ✔️ |
| ZipTie | – | ✔️ | ✔️ | – | – | – | – | – | – |
| Adobe Analytics | ✔️ | – | – | ✔️ | – | ✔️ | ✔️ | – | – |
| Ahrefs | ✔️ | ✔️ | ✔️ | – | ✔️ | – | – | – | ✔️ |
Overall, the feature comparison shows that Similarweb delivers the broadest mix of competitive intelligence, audience metrics, and AI‑visibility tools at a mid‑tier price point, while GA4 remains the go‑to free option for basic on‑site analytics and monetization reports.
Mixpanel excels at event‑based product analytics, and Hotjar is best for qualitative UX insights. Adobe Analytics provides deep segmentation but at enterprise‑level costs, whereas Ahrefs’ suite is geared toward SEO and a limited AI add‑on, making it expensive relative to its capabilities.
These differences underscore how choosing the right platform hinges on your specific needs, whether it’s multi‑channel market intelligence, product analytics, SEO, or AI‑search visibility.
Evaluating coverage, usability, and data quality
Before selecting an analytics platform, it’s not enough to look at features alone. You also need to consider how easy the tool is to use, how quickly you can get it up and running, and how much trust you can place in the data.
To help you compare solutions, I scored each tool on four metrics:
- Total coverage: how many of the key capabilities in our feature matrix does the tool offer? Tools that provide traffic analytics, AI‑visibility reports, and competitor intelligence alongside on‑site analytics score highest.
- Ease of use: drawn from independent reviews and usability reports. High scores reflect intuitive interfaces that make it easy to find insights.
- Ease of implementation: based on user feedback about setup and integration. A tool scores higher if reviewers report quick onboarding without complex configuration.
- Data accuracy: Your SEO strategy is only as reliable as the data you’re using. considers issues like accuracy, sampling, and reliability.
Web analytics tools scorecard
| Tool | Coverage (1–10) | Ease of use (1–5) | Implementation (1–5) | Data accuracy (1–5) | Total |
| Similarweb | 7/10 | 4.6/5 | 4.5/5 | 4.5/5 | 20.6/25 |
| Google Analytics (GA4) | 5/10 | 2.5/5 | 3/5 | 4/5 | 13.5/25 |
| Mixpanel | 2/10 | 4/5 | 4/5 | 4/5 | 14/25 |
| Kissmetrics | 2/10 | 3/5 | 3.5/5 | 3.5/5 | 12/25 |
| Hotjar | 2/10 | 4.5/5 | 4.5/5 | 3/5 | 14/25 |
| Microsoft Clarity | 3/10 | 4.7/5 | 4.7/5 | 3/5 | 15.4/25 |
| Matomo | 6/10 | 4/5 | 3.5/5 | 4.5/5 | 18/25 |
| Smartlook | 3/10 | 3.5/5 | 3/5 | 4/5 | 13.5/25 |
| Woopra (Appier AIRIS) | 3/10 | 4/5 | 3/5 | 3.5/5 | 13.5/25 |
| Adobe Analytics | 4/10 | 3.9/5 | 2/5 | 4.5/5 | 14.4/25 |
| Ahrefs | 6/10 | 3/5 | 4/5 | 3/5 | 16/25 |
| ZipTie | 3/10 | 4/5 | 4.5/5 | 4/5 | 15.5/25 |
These scores are based on publicly available reviews and feature comparisons. Your experience may vary depending on your organization’s needs and resources. Still, the table shows that Similarweb combines broad feature coverage with high usability and quick setup, making it a top choice for businesses looking to stay ahead in 2026.
How to choose the right web analytics tool for you?
Picking the right analytics solution can feel overwhelming. There are dozens of tools, each touting different strengths, from product analytics to market intelligence to AI visibility. To simplify your decision, start with a structured process and then consult the decision tree below.
1. List your requirements
Identify the parameters you care about:
- What questions do you need answered?
- Which channels do you need to measure?
- How important are privacy and data ownership?
- Do you require AI‑visibility metrics?
List all possible parameters and then classify them into “must‑have”, “nice‑to‑have”, and “other” categories.
2. Prioritize and shortlist
Limit your must‑have list to the ten most important criteria. Shortlist two or three tools that satisfy those criteria for further comparison.
3. Compare features and value‑added benefits
Evaluate the shortlisted tools against each must‑have and good‑to‑have feature. Consider additional value‑added features that might tip the scale, such as API availability, privacy safeguards, native integrations, and AI‑visibility reporting.
4. Assess reliability, cost, and support
Check whether the vendor is reputable, how long data is retained, what security measures they offer, and whether they will sign a non‑disclosure agreement.
Balance the price per user or data volume against your budget, and verify that training resources and technical support meet your needs.
5. Test and decide
Request demos, trial plans, or proofs of concept. Test integrations and reporting workflows with your real data.
Once you have a clear comparison matrix, choose the tool that best matches your requirements.
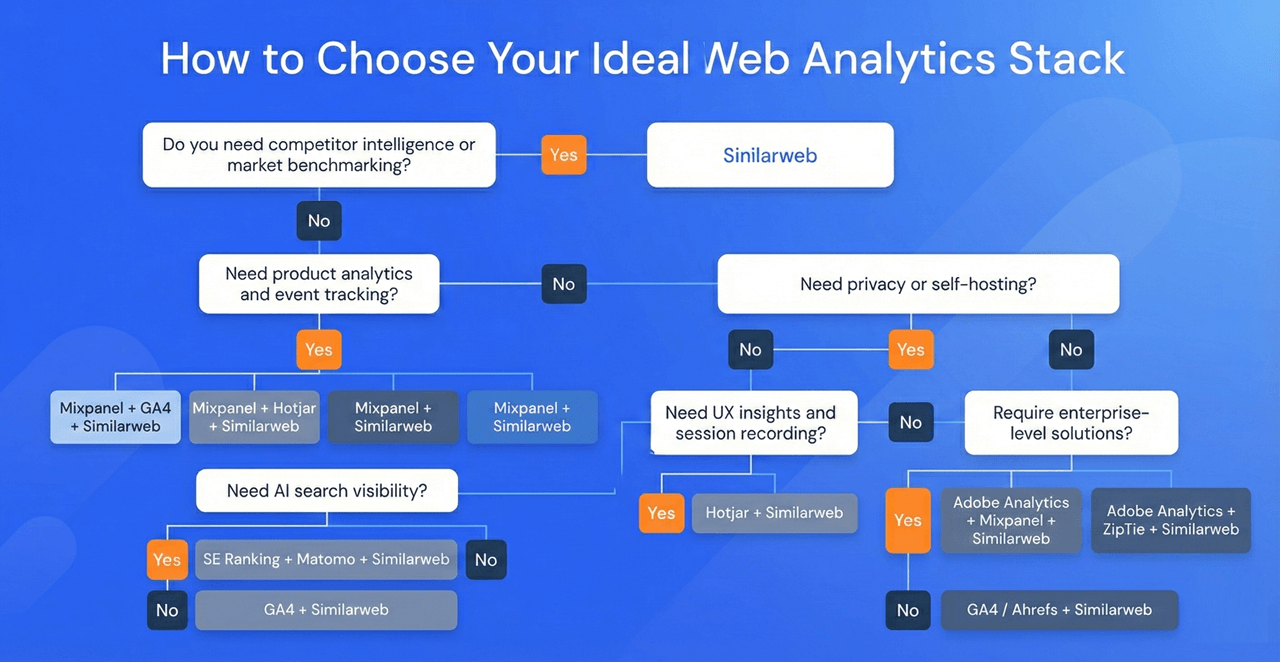
Decision tree: matching tools to your goals
If you prefer a quick path to a recommendation, use the decision tree below. It steers you through a series of yes/no questions. Answer each question in sequence to find the stack that fits your needs:
Do you need competitor intelligence or market benchmarking?
- Yes: Choose Similarweb. Its third‑party data shows how you compare against industry peers and includes AI‑visibility metrics, making it the best option when market share and competitive analysis are critical.
- No: Continue to the next question.
Need product analytics and event tracking?
- Yes:
- If you also need SEO & AI search visibility, choose Mixpanel, GA4, and Similarweb.
- If you need UX insights and session recordings, choose Mixpanel, Hotjar, and Similarweb.
- If you need privacy or self‑hosting, choose Mixpanel, Matomo, and Similarweb.
- Otherwise, combine Mixpanel with Similarweb to add market context.
- No: Continue.
Need SEO & AI search visibility?
- Yes: If privacy or self‑hosting is critical, choose SE Ranking, Matomo, and Similarweb. Otherwise, combine GA4 with Similarweb (the ultimate goto, if you ask me).
- No: Continue.
Need privacy or self‑hosting?
- Yes: If you also need UX insights and session recording, choose Matomo, Hotjar, and Similarweb. Otherwise, combine Matomo with Similarweb.
- No: Continue.
Need UX insights and session recording?
- Yes: Combine Hotjar with Similarweb for heatmaps, recordings, and competitor insights.
- No: Continue.
Require enterprise‑level solutions?
- Yes: If you also need product analytics, choose Adobe Analytics, Mixpanel, and Similarweb. Otherwise, choose Adobe Analytics, ZipTie, and Similarweb to cover enterprise‑grade segmentation, AI‑only visibility, and market intelligence.
- No: Lightweight SEO and first‑party analytics needs are best served by GA4/Ahrefs + Similarweb, giving you on‑site analytics plus competitor and AI visibility.
The following diagram illustrates these decision branches:
Final thoughts
In a world where generative AI influences even users who never click on citations, web analytics, and competitive intelligence are your compass.
The tools listed above, from free platforms to enterprise suites, provide the data you need to understand your audience, benchmark against competitors, and navigate the rapidly evolving landscape of AI‑driven discovery.
To remain visible in both traditional search and AI‑powered experiences, pair robust analytics with AI‑visibility tracking across answer engines and generative models.
Measuring metrics such as citation share, brand visibility, and sentiment provides the evidence you need to refine your strategy and demonstrates where your content stands within the generative search ecosystem.
FAQs
Which web analytics tool is the simplest to use?
Hotjar and Similarweb top ease‑of‑use rankings. Hotjar, because they deliver heatmaps and session recordings with almost no setup. Similarweb is nearly as easy to learn and adds competitor intelligence and AI‑visibility metrics, giving beginners more room to grow.
What factors should I consider when picking a web analytics service?
List the questions you need answered and the channels you plan to track. Shortlist a few tools and compare their traffic analytics, AI‑visibility features, competitor insights, and privacy options. Then weigh accuracy, cost, ease of implementation, and support. Similarweb scores high on coverage and usability.
What are good choices for robust web analytics software?
Similarweb blends traffic analytics with competitor benchmarking and AI‑visibility, making it the most versatile. GA4 is free for basic on‑site tracking, Mixpanel shines in product analytics, Hotjar focuses on UX insights, and Matomo is ideal for privacy‑conscious users.
What is the simplest tool for beginners in web analytics?
For quick insights, Hotjar is free and extremely easy to set up. If you want room to grow, Similarweb’s free tier offers simple dashboards now, with the option to upgrade for competitor analysis and AI‑visibility later.
What are some reliable options for web analytics?
Similarweb scores highest for data accuracy thanks to its large, anonymized panels. GA4 delivers trustworthy first‑party data for free, Matomo is a solid self‑hosted choice, and Mixpanel is respected for product analytics. However, only Similarweb pairs reliability between market benchmarking and AI‑visibility.
Which tools and platforms does Similarweb integrate with?
Similarweb offers native integrations with a broad array of cloud, BI, and CRM platforms. Supported connectors include Google Looker Studio, Microsoft Excel, HubSpot, Salesforce, AWS, Google Cloud Platform, Snowflake, Databricks, Tableau, and Power BI.
These integrations let you blend Similarweb’s datasets with your own data and visualize insights directly in the tools your team already uses.
Can web analytics data be trusted for business decisions?
Yes, if you understand the source. First‑party tools such as GA4 provide precise data for your own site, but offer no market context. Third‑party tools like Similarweb aggregate data from many sites and are considered highly accurate, so combining both gives a fuller picture.
How accurate is Similarweb’s web analytics data?
Several studies over the years have crowned Similarweb as “the most accurate” third‑party analytics provider because it synthesizes data from massive user panels and multiple sources. Its web, app, and AI‑visibility datasets are widely praised for quality and reliability.
How expensive are premium web analytics subscriptions?
GA4 is free. Similarweb offers a free tier and trial. Its Pro plan starts around US$125/month, and the Gen‑AI add‑on is around US$99/month. Mixpanel and Hotjar have free plans with paid upgrades, while enterprise suites like Adobe Analytics can cost $50,000 per month.
Are there completely free web analytics solutions available?
Yes. GA4 is completely free, Matomo can be self‑hosted at no cost, and Hotjar offers free tiers. Similarweb offers a set of free tools for traffic analysis, keyword research, and more, with paid upgrades for deeper insights.
What is AI visibility and why does it matter in 2026?
AI visibility measures how often generative search engines cite your content. Metrics like visibility score, brand mention share, topic coverage, and citation share help you understand your presence in AI‑generated answers.
How do first‑party and third‑party analytics differ?
First‑party tools like GA4 and Matomo run on your own site and capture individual events, while third‑party tools such as Similarweb aggregate data from millions of sites for market‑level insights and competitor benchmarks. Using both provides a 360‑degree view of performance.
Which metrics should I track to measure AI visibility?
Key metrics include brand visibility score, brand mention share, topical and prompt coverage, domain influence, citation share, and sentiment distribution.
Which analytics tools provide AI‑visibility metrics?
Most traditional tools don’t yet track AI visibility. Similarweb has a dedicated AI‑visibility suite covering visibility scores, citation share, and sentiment, while emerging tools like ZipTie also focus on AI visibility.

Related Posts


How to Do A Competitive Analysis: Complete Guide & Free Templates

How to Build an AI Search Intelligence Dashboard for Client Presentations Using Claude and Similarweb MCP

AI Visibility Momentum: The VAMP Framework For Tracking What Visibility Scores Miss

The Dark Funnel Paradox: Why Your Best B2B Leads Are Invisible (And How to Find Them Anyway)
![GEO Framework For Growth Leaders [+Free Template]](https://www.similarweb.com/blog/wp-content/uploads/2026/02/attachment-growth-leader-geo-decision-framework-768x429.png)
Your full marketing toolkit for a winning strategy
The ultimate solution to help you build the best digital strategy