





The Top 100 Most Visited Websites in the USA (August 2026)
by Shai Belinsky10 Min.
Sep 29, 2026

Mobile phones are no longer a mere tool for communication and entertainment; we now live with them as an extension of ourselves. These gadgets have become part of our everyday lives and act like advanced productivity devices for handling complicated business operations. The invention of mobile apps made these devices our constant companions. Each app serves a different purpose, extending mobile use and flexibility.
Mobile apps are a necessity now, with metrics providing the raw information necessary to analyze their results. Metrics give a picture of how the feature works, what the user does, and whether it’s really working. The more we use smartphones, the more important these figures become. It is important for companies and developers to remain vigilant in finding and analyzing metrics that can help anticipate user-driven enhancements and fixes.
The data that these performance measures give us allows you to understand how they're received and how well they perform. Attention to such metrics makes a big difference when it comes to retaining users and improving the app.
App metrics serve as a basic means to measure app performance. They provide data about performance elements and help developers customize the experience to align with user requirements and business objectives. Yet it’s not always easy to know which metrics are important.
Different apps assign different metrics to various objectives. Subscription-based apps, for instance, look at retention and average revenue per user. Advertising-based apps focus on Daily Active Users and impressions. Matching these metrics to the app’s strategic goals will provide data-driven insights that help to plan development and drive long-term success.
With the mobile app market continually growing, keeping tabs on the right metrics is important to your success. As user behaviors and technology continue to evolve, knowing which metrics to pay attention to gives developers and businesses the information they need to improve the user experience and scale the app. Organizing the most actionable metrics can enable businesses to meet user requirements and maximize app performance:
The ability to view user experience data is an invaluable resource for developers. These metrics show how users engage with an app and help developers assess its effectiveness. One major factor is active users and the number of times the app gets downloaded.
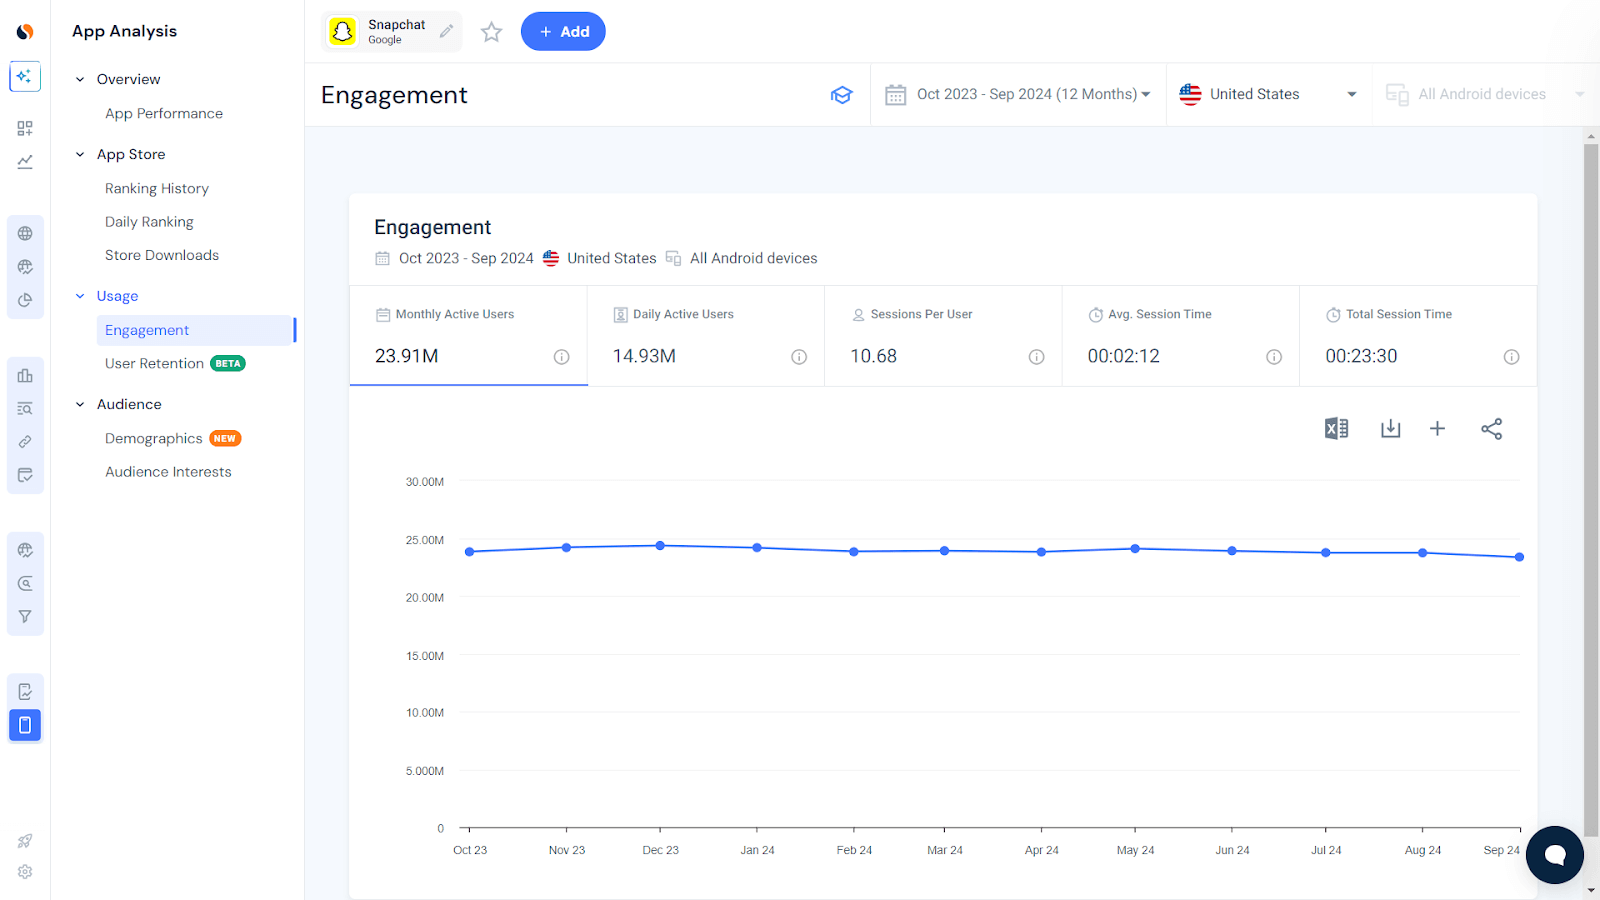
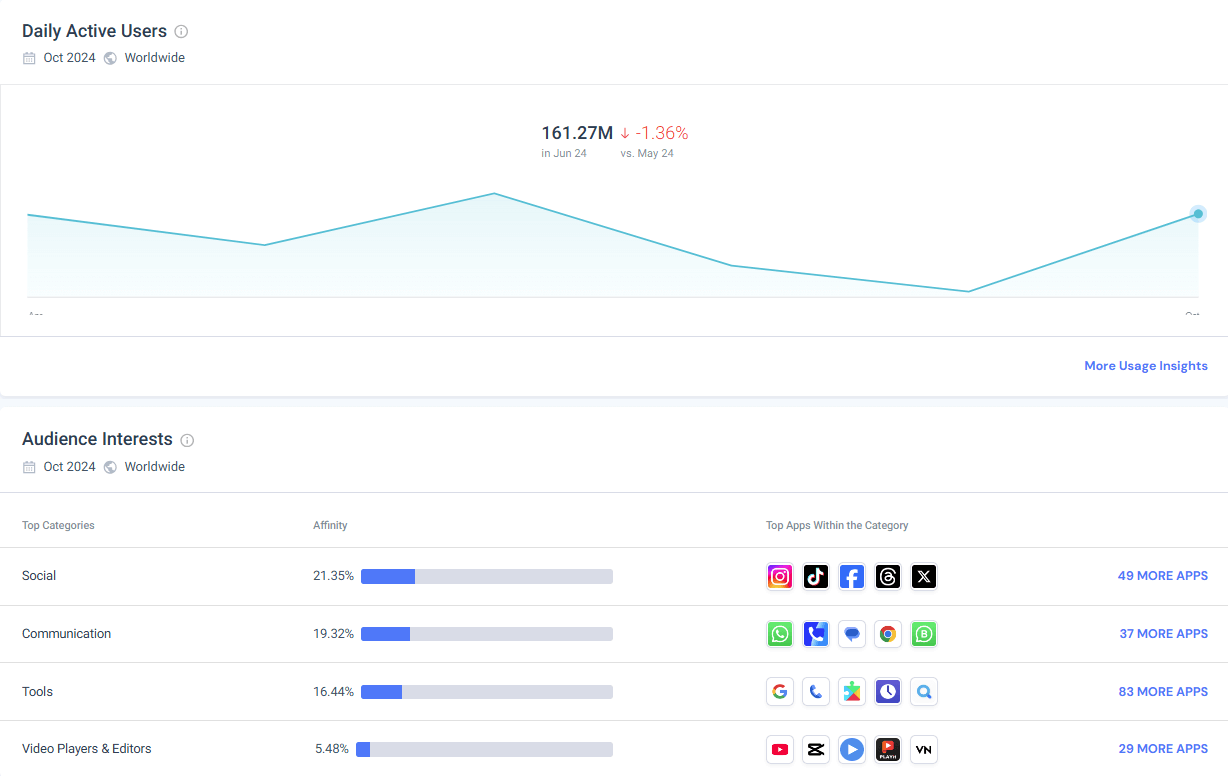
Analyzing active users can tell you how invested they are in an app. The number of times customers visit proves its utility and value. Daily, weekly, and monthly active users (DAU, WAU, MAU) give you useful feedback on your app’s retention rate.
DAU provides an immediate picture of how many unique people access the app each day. They are the basic metrics that determine the app’s popularity and frequency, and how much users are interested in daily features and content.
WAU helps identify broader interaction trends, so we can look beyond usage metrics on a daily basis. This is an indicator of continuous use, which accounts for fluctuations in usage from week to week.
MAU is where trends are found on longer timeframes and it reveals retention and growth strategy. This measure defines the primary audience that reuses the app over and over again, proving its long-term viability.
Session length describes the duration of time spent in the app at a particular time. There is a need to identify if users are engaged or tangled in complex site navigation. It’s something that developers can take and utilize to make things simpler and help keep user engagement high without creating frustration.
Session frequency is how many times users open the app and how important it is to them. Regular use speaks to the usefulness and value of the app. Seeing frequency patterns is also useful to get insights on usage patterns and the best interaction times for developers.
Keeping track of the most-accessed screens can help inform app improvements by identifying both best-selling functionality and gaps in the current app. High engagement on certain screens implies good UX design and other screens that aren’t seen could be improved.
App retention and churn rates are key for user happiness. These measures show how regularly visitors come back and what can be changed or enhanced if interest declines. Keeping customers is just as important as getting new customers. Knowing why they leave can drive meaningful changes.
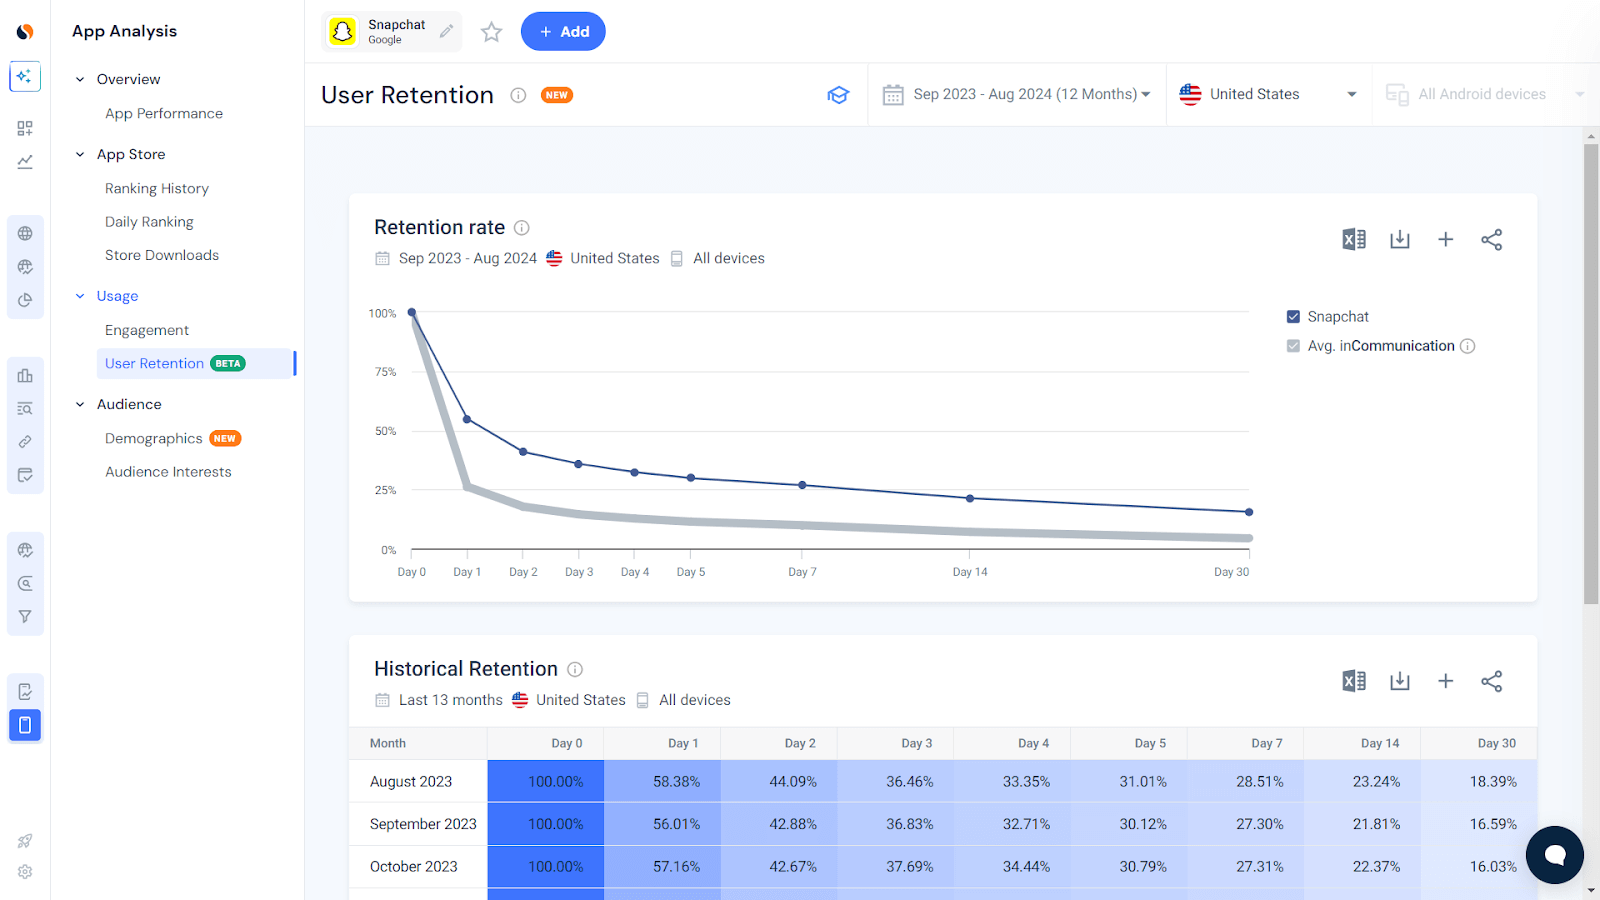
The retention rate shows the number of times that users return to the app over time. When customers keep coming back, it usually indicates they are happy. This knowledge can help direct early app experiences so that the next updates are received well.
The churn rate shows the percentage of users who abandon the app after a certain period of time, useful for identifying any potential discontent. Having a high churn rate can signal problems with user experience, features, or content.
Cohort analysis lets you segment the users by similar actions or periods of time and identify retention. As companies monitor these groups over time, they will be able to implement solutions that target engagement and retention across different segments of users.
User acquisition and growth metrics tell you whether the app is popular. Everything from app store rankings to user acquisition costs help figure out how to market the app. Based on this data, developers can strategically plan campaigns and budgets.
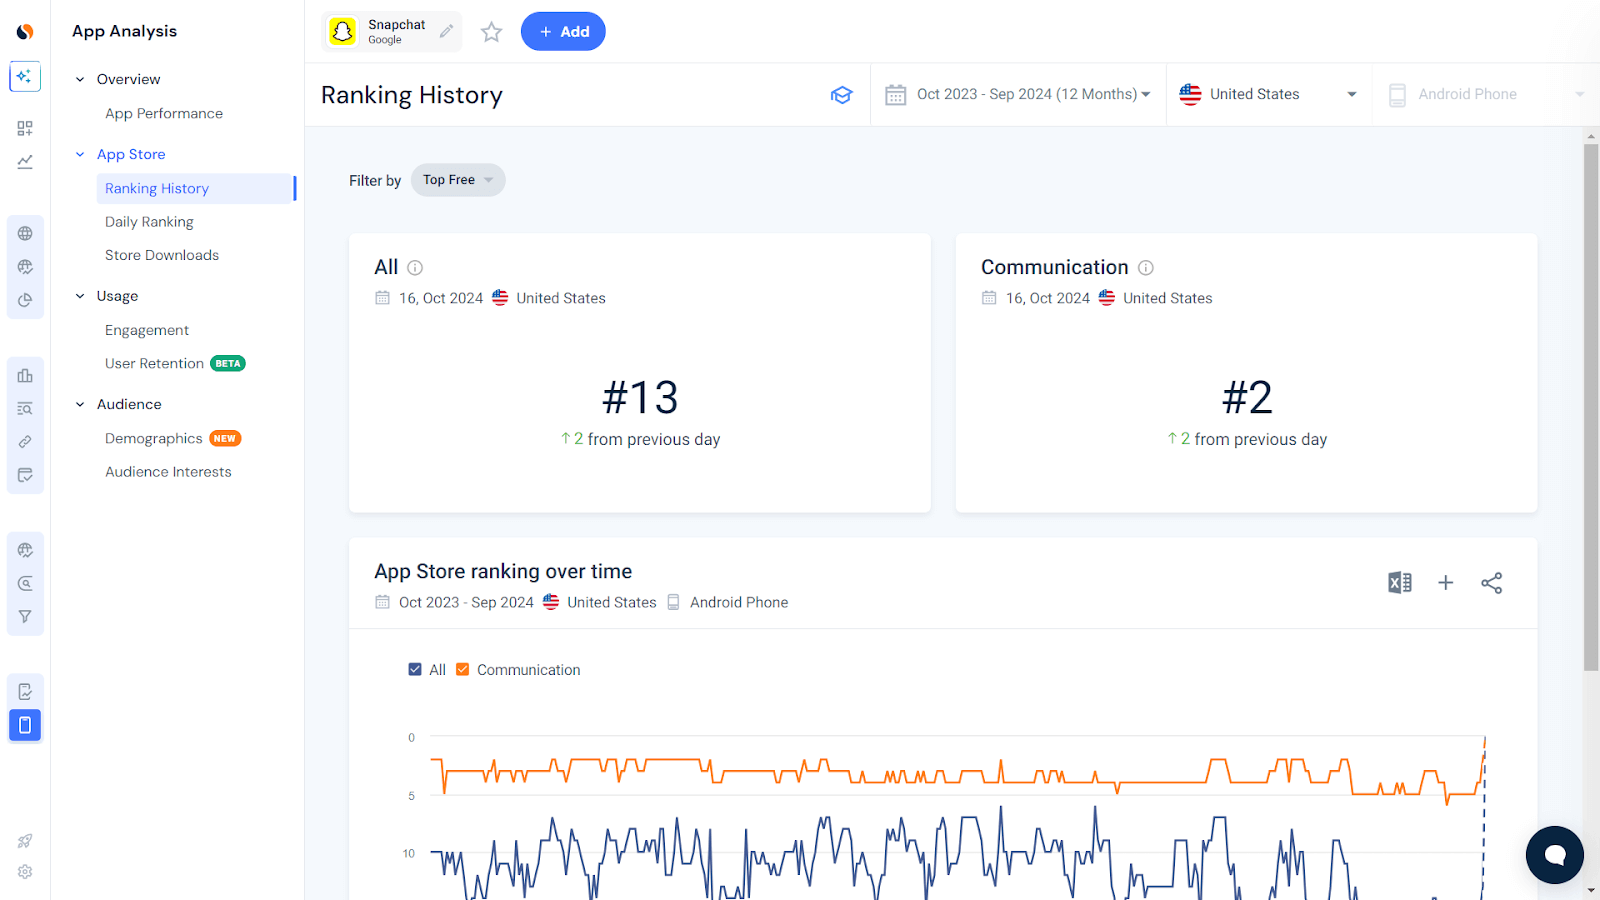
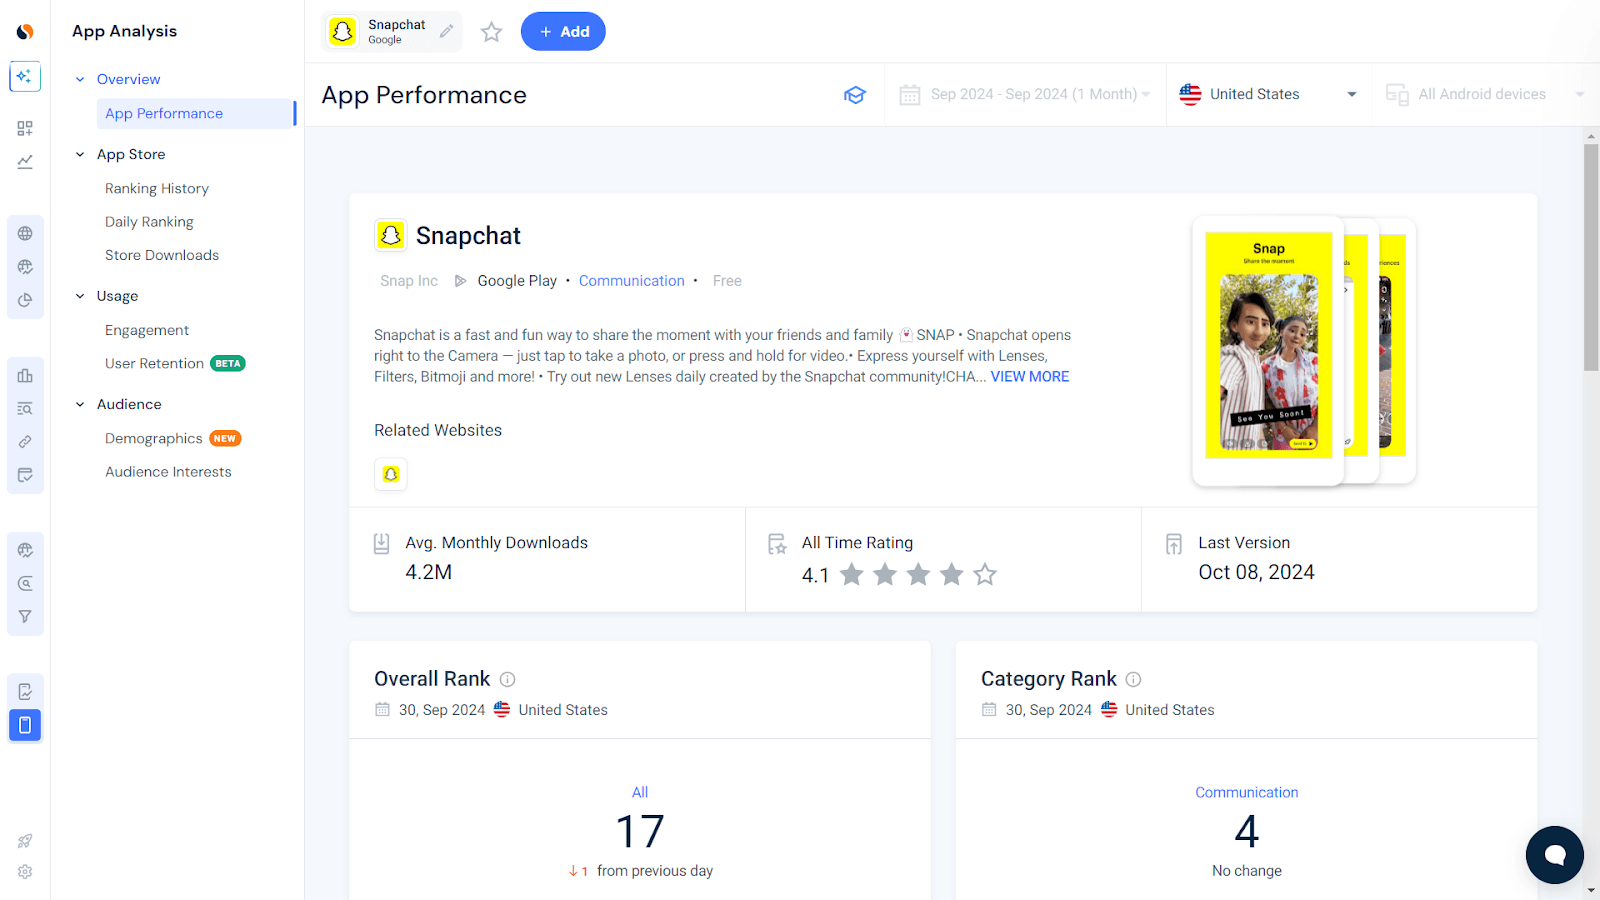
App store rankings directly influence visibility and organic downloads. A higher ranking typically signals strong market fit and appeal. By monitoring these rankings, businesses can track shifts in user preferences and competitor strategies, helping them refine their marketing plans to stay aligned with market trends.
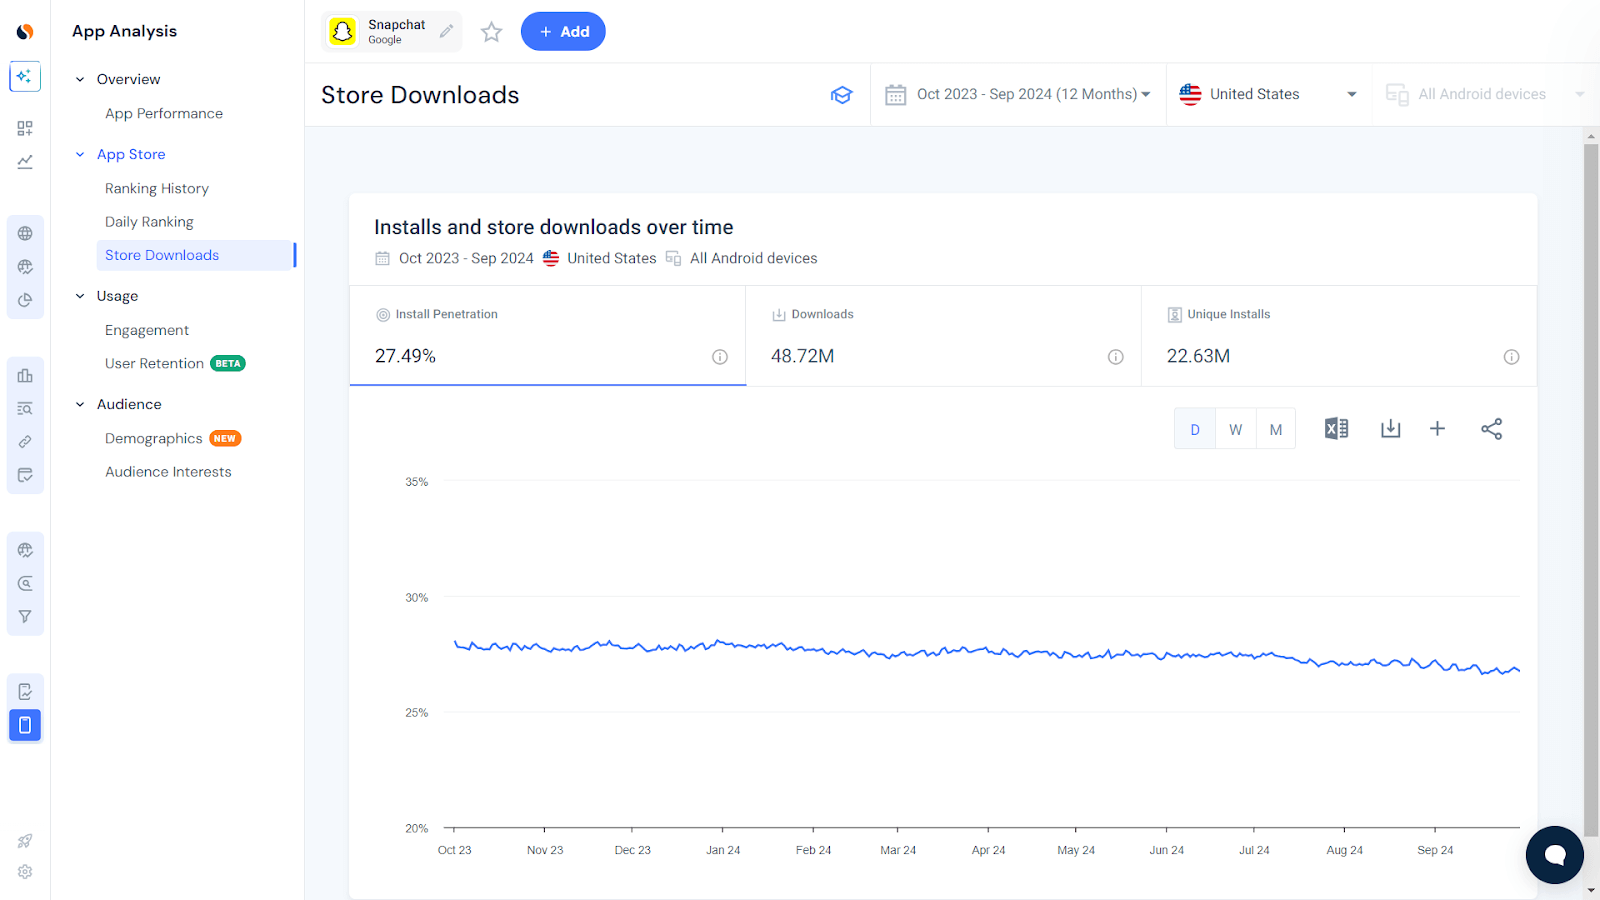
Download numbers offer a significant first impression, but they are not everything. Post-download behavior provides deeper insight into user engagement levels. It is all about turning downloads into user retention and engagement in the app.
CPA (Cost Per Acquisition) measures the cost of converting a new user into a customer across various marketing channels. Estimating this value enables marketers to allocate budgets strategically, focusing on channels that deliver the highest return on investment.
Distinguishing between organic and paid growth helps clarify independent strategies for expansion. Organic growth stems from user-driven actions like SEO and ASO, while paid growth depends on investments in ads and partnerships, each offering unique costs and returns.
The right metrics to gauge app performance and stability are important for a seamless customer experience. Tracking trends such as crash frequency, load times, and network performance can keep app quality up and users’ confidence high.
Crashes are a big deal breaker and need to be resolved quickly to avoid customer frustration. Knowing the root causes of errors will help developers to build preventative solutions to increase app performance.
Quick loading times are important to satisfy the user’s needs and keep their attention. When an app loads too slowly users are more inclined to give up on it. By always reducing load times, you encourage a good user experience.
Network latency affects app performance, particularly when it involves using the server. Low latency provides smooth operations and immediate response, which is essential in interactive or data-heavy applications.
It is important to understand the financial structure supporting an app. Revenue data such as lifetime value, average income per user, and purchase habits show your financial condition and where you can improve your strategy for monetization.
the total revenue an app can expect to generate from a single user throughout their entire relationship with the app. It accounts for factors like user retention, average purchase value, in-app purchases, subscriptions, or ad impressions over time. LTV is a critical metric for understanding the long-term profitability of acquiring and retaining users, helping developers optimize marketing strategies and resource allocation.
ARPU determines the ad revenue from current users and allows you to see whether or not monetization efforts are working. Rises in these measurements reflect successful pricing structures or user interaction.
Analyzing purchases and subscriptions gives insights into the spending patterns of users and how they earn through apps. Based on these trends, companies can tailor pricing strategies or design unique promotions to stimulate purchases
Metrics like user satisfaction reveal how users perceive the app. Recommendations, ratings, and other customer experiences help developers understand what works and what doesn’t. These observations can provide the correct modifications to meet users’ expectations.
NPS shows how willing the user is to recommend the app and represents a measure of loyalty and satisfaction. High scores improve the app’s popularity and promote word-of-mouth advertising.
Ratings and reviews represent a direct line of communication with users to provide an understanding of their experience. Depending on how closely they work with feedback, developers can make tactical adjustments to improve app satisfaction.
Studying support interaction offers a peek at your users’ pain points. By managing these issues early, businesses can increase user satisfaction and create a healthy app ecosystem. Monitoring the customer service performance can also highlight where the support system needs improvement.
If you’re tracking mobile app metrics, you must be able to analyze and draw insights from the data. Utilizing these best practices can make a huge difference in app performance and user experience:
Picking the right tools is the difference between good and great apps. The right tools are goldmines of information.
Setting benchmarks and defining KPIs is important for tracking and analyzing app performance over time and keeping tabs on retention and engagement. With strategic planning, benchmarks highlight achievements and lay out a path for continuous improvement. A/B testing new features and reviewing the findings can uncover real user interest, allowing you to provide app services to meet demand every time.
Keeping up user behavior means constant monitoring and refining. Analytics and user reviews can be monitored to fix your app quickly. This constant tinkering stimulates users to participate and allows the app to adapt to changing preferences.
Continuous testing and updates will support the app’s relevancy. Data-driven decision-making makes apps deeply connected to user behavior and builds longer-term customer relationships.
Analyzing app performance plays an important role in driving improved user experiences. Learning what metrics matter allows developers to know exactly where to make tweaks and design strategies that drive progress. Data-based decisions help implement more immersive user experiences and improve any mobile strategy. Monitor your app’s performance metrics vs. your competitors and your market with Similarweb Digital Data, and start your path to business growth.
How do mobile app metrics aid in improving app quality?
The continuous monitoring of metrics helps developers see where they can improve and make timely adjustments to optimize the user experience and drive app quality.
What role do metrics play in user retention strategies?
App metrics such as Retention Rate measure how an app retains users. The insights into these stats help designers create features that continue to build user engagement and retention.
Can app metrics be beneficial for app monetization tactics?
Yes, monetization strategies can be influenced by user demographics and duration, which allows developers to look for practices that match user patterns and habits.
How do metrics influence app feature updates?
Metrics enable developers to identify what features are hot and which ones need improvement in order to release targeted updates, resulting in greater app utility.
Are there particular metrics that directly indicate user satisfaction?
App metrics such as Average Session Length and user retention can indirectly measure satisfaction by offering hints of what app features users are excited or engaging with.

Pavel leads Product Marketing for Similarweb's Data-as-a-Service, bringing over a decade of experience in Adtech and Marketing to the role. Outside of work, Pavel enjoys long walks and mountain biking.
The Top 100 Most Visited Websites in the USA (August 2026)

Similarweb Named in Forrester's Answer Engine Optimization Technologies Landscape, Q3 2026

Anthropic IPO: What Claude's Web and App Data Show
Here are two ways you can get started with Similarweb today!
