





The Top 100 Most Visited Websites in the USA (August 2026)
by Shai Belinsky10 Min.
Sep 29, 2026
 Research Intelligence
Measuring average session duration often raises more questions than it answers. That’s precisely what makes it so interesting.
As every marketer or analyst knows, any analysis starts with questioning. You just have to figure out what to ask to get the answers you need. With session duration, there’s no reason to bust your head, the questions pop up naturally:
How did visitors spend their time on my site or app? Which pages did they visit and in which order? How many pages did they browse through per visit?
In this post, we’ll discuss how to use session duration in conjunction with other key engagement metrics, as well as how to evaluate it, and improve your average session duration. First, let’s understand what it means.
A session begins the moment a visitor arrives at your website and ends when they exit or remain inactive for a predetermined time span. As long as the visitor interacts with your site, the session continues.
To determine session duration, Google Analytics – the industry standard for tracking on-site data – relies on page visits (or ‘hits’) within your site. This means that if a user didn’t interact with the page last visited, the time spent on that page is excluded from the session. Keep this in mind when you analyze your metrics.
The average session duration accumulates all sessions within a given period and calculates the average.

Google Analytics displays session duration in seconds. To calculate the average, Google totals up the lengths of all sessions within the given timeframe and then divides that number by the number of sessions.
For example:
1) Visitor A spent 45 seconds on your site.
2) Visitor B spent 255 seconds on your site.
3) Visitor C spent 180 seconds on your site.
This brings us to a total of 480 seconds. When we divide this by three visitors, we learn that they spent an average of 160 seconds on your site—or 2.6 minutes.
According to Databox, most digital marketers report an average session duration of 2-3 minutes. One could conclude that anything above three minutes is a good average. But is that a relevant benchmark for you? It feels more like comparing a Formula 1 race car to the entire car industry to figure out how well it performs. The outcome would be useless. A race car is a different class than a microcar or a four-by-four and each has its purpose.
The same goes for your website or app. To evaluate performance, you need to benchmark your digital performance against competitor’s businesses pursuing similar goals. A local store does not want visitors to hang around on their site; they want to get contacted. A content-heavy site with professional articles and videos (such as journals.sagepub.com) can expect a much longer session duration than a brand awareness site for a physical retail store like pg.com. An interactive app is a different story altogether.
An online survey in 2017 of 181 companies revealed that visitors to business-to-consumer (B2C) companies spend on average 42.3% more time on site than visitors to business-to-business (B2B) companies.
They also found that people spend significantly longer on healthcare and hospital sites. The average there lies at 3:38 per session. Next are financial services with 2:18 and pharmaceuticals and medical devices with 2:16. All other major industries show an average lower than two minutes.
Here’s a look at the average visit duration per key industry, according to Similarweb data:
Website visitors behave differently from app users. Similarweb’s analytics software, therefore, offers separate metrics for websites and apps.
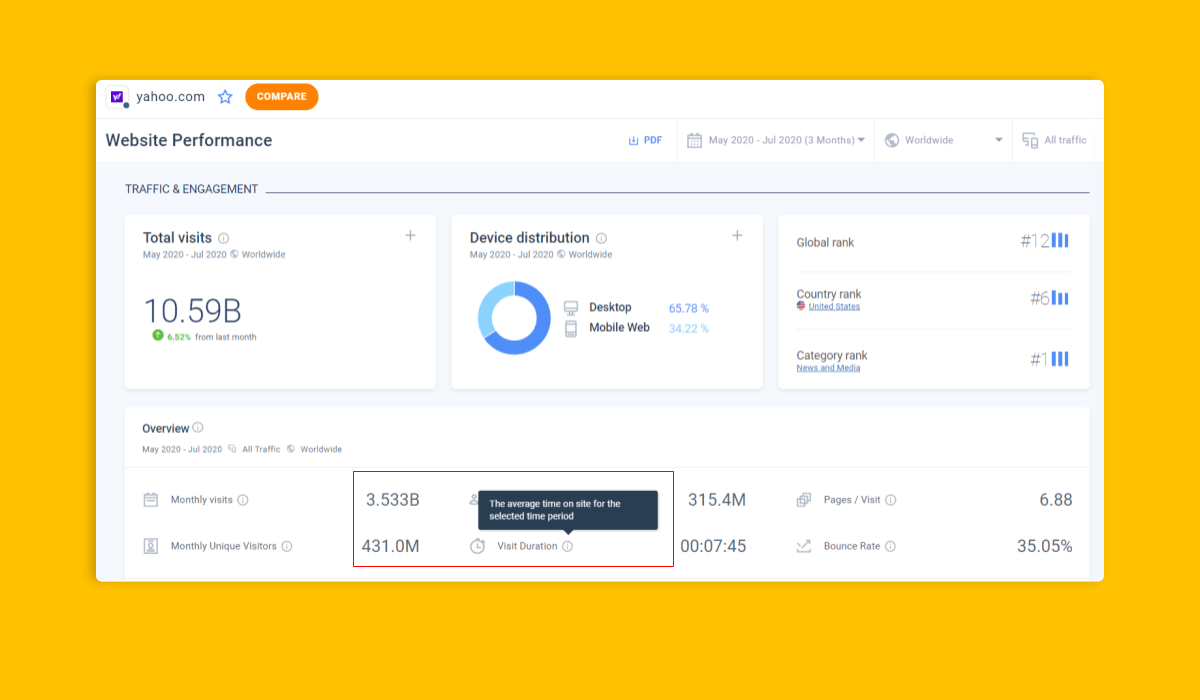
‘Visit Duration‘ is the equivalent of Google Analytics’ session duration, but with a small advantage. Similarweb puts data into context to provide you with ready-to-use data for your business decisions.
First, you get to choose your business category, so you can compare your numbers to those of similar businesses.
View the average visit duration for traffic from a country you choose or calculate globally. This helps you understand your audience’s geography and adjust region-specific marketing strategies accordingly. Also, select the period for which to calculate your average.
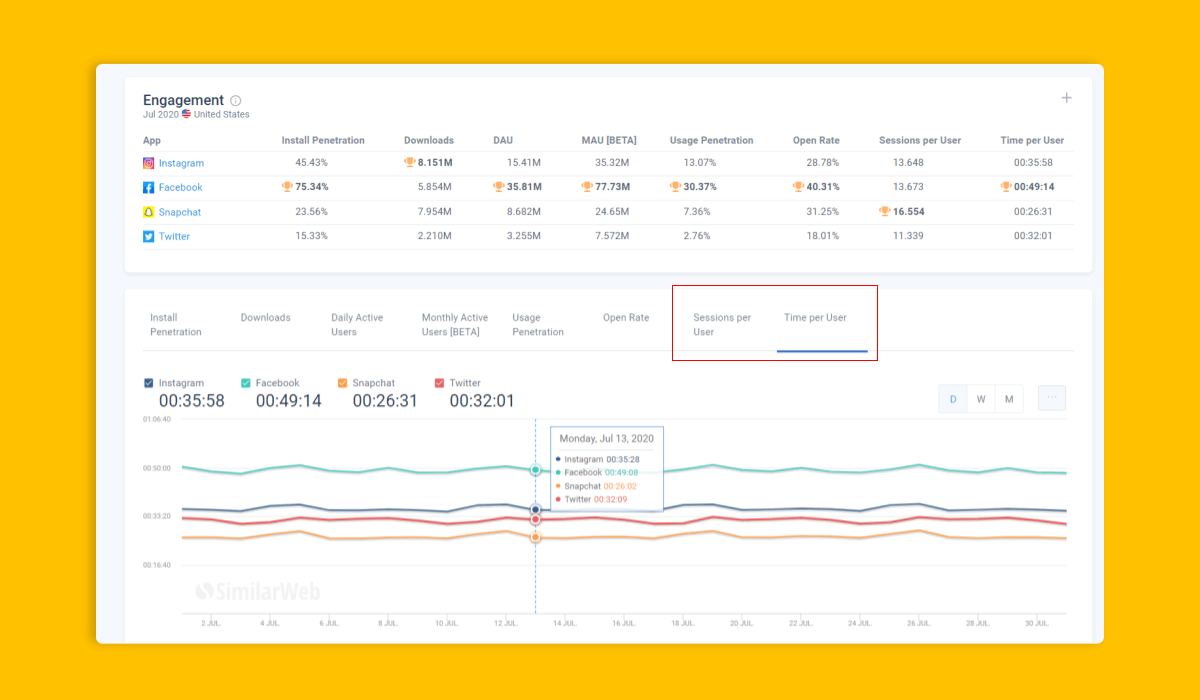
‘Time per User‘ is session duration for app users and lets you measure average app time per user. A session begins when the user logs in to your app and lasts until they close the app or move it to the background for longer than 30 seconds. The next time the app is opened, the software counts a new session.
You can either select a country you want to focus on or get a global average. If you’re getting most of your traffic from app users, then app engagement metrics offer valuable insights into how your app is being used.
Google counts a pageview each time a new page loads. A session can—and usually does—include multiple pageviews. Now’s the time questions should start popping into your head: How many pages do visitors view during a session? How much time do they spend on each page? How many are unique visitors and how many returning viewers? You got it! Now you’re using session duration as a springboard into your analysis.
To get answers, you need to look at additional metrics. On the platform, you will find the related data displayed compactly. You get all key engagement metrics in one place, making it easy and intuitive to dive into your website performance analysis.
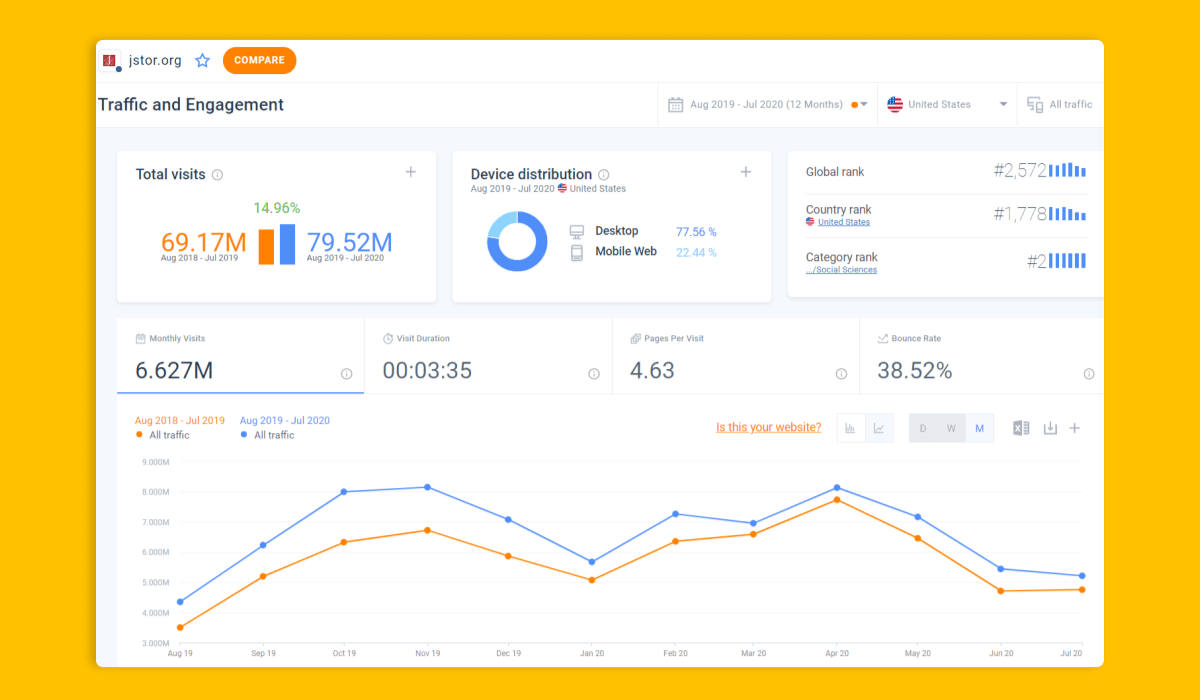
If you are happy with your average session duration, look at your engagement rate. This will tell you if people are active on your site or just window shopping. Similarweb lets you benchmark against your competition and get industry averages per category. For example, eCommerce, digital publishers, and financial services companies have different benchmark averages.
Graphic content draws more attention and is often easier to consume than text. Intro videos and recorded interviews work better than written content. Animated product graphics are highly popular on commercial sites.
Navigation on your website needs to be smooth and simple. Don’t overwhelm visitors with buttons and graphics. Help them discern calls-to-action, navigation panels, and content at first glance. It is crucial that you understand your customers’ journey and know what might interest them next.
Start by linking the most-read posts, most-watched videos, or most-bought products on your homepage and other pages where people enter your site. Also, add links to related content on the bottom of each page. Plan how you interlink your pages based on your customer journey.

Use a readable font and don’t pack the page with text. There should be enough white space to encourage effortless reading. Short paragraphs with headers and subheaders make wordy content easier to digest.
Make sure all your content is useful to your audience and addresses your customers’ intentions. Present specific information and provide updates to stay current. Educate your readers through tips, reviews, data, insights, and training. Engage users by adding interactive sections and requesting feedback.
Your Turn to Start Questioning
Do you know how your numbers measure up to others in your category? This is one more question that should always pop up in your mind when you check your site metrics. The data you receive through Similarweb’s analytics software puts you one or more steps ahead of the competition. As a result, you won’t be monitoring your average session duration and other metrics in a vacuum, but always within your industry’s landscape.
To learn more about how Similarweb can help you boost your digital presence, download our eBook, How to Build the Perfect Marketing Strategy.
What is session duration?
Session duration is the timeframe in which a user arrives, interacts, and exits your site.
What is a good session duration?
Anything over 3 minutes is generally considered a good session duration.
How is session duration calculated?
Average session duration = total duration of all on-site sessions/number of sessions

Principal Product Marketing Manager
Daniel brings 10+ years of marketing experience, specializing in both B2B and B2C audiences. He thrives at managing delivery of projects, consistently developing concepts that drive impact.
The Top 100 Most Visited Websites in the USA (August 2026)

Similarweb Named in Forrester's Answer Engine Optimization Technologies Landscape, Q3 2026

Anthropic IPO: What Claude's Web and App Data Show
Contact us to set up a call with a market research specialist
