Here at Similarweb we are constantly innovating and making improvements to the platform based on feedback from our customers and the needs of digital researchers. Check out the latest features and enhancements we’ve added to the Web Intelligence product in April and since the start of the year.
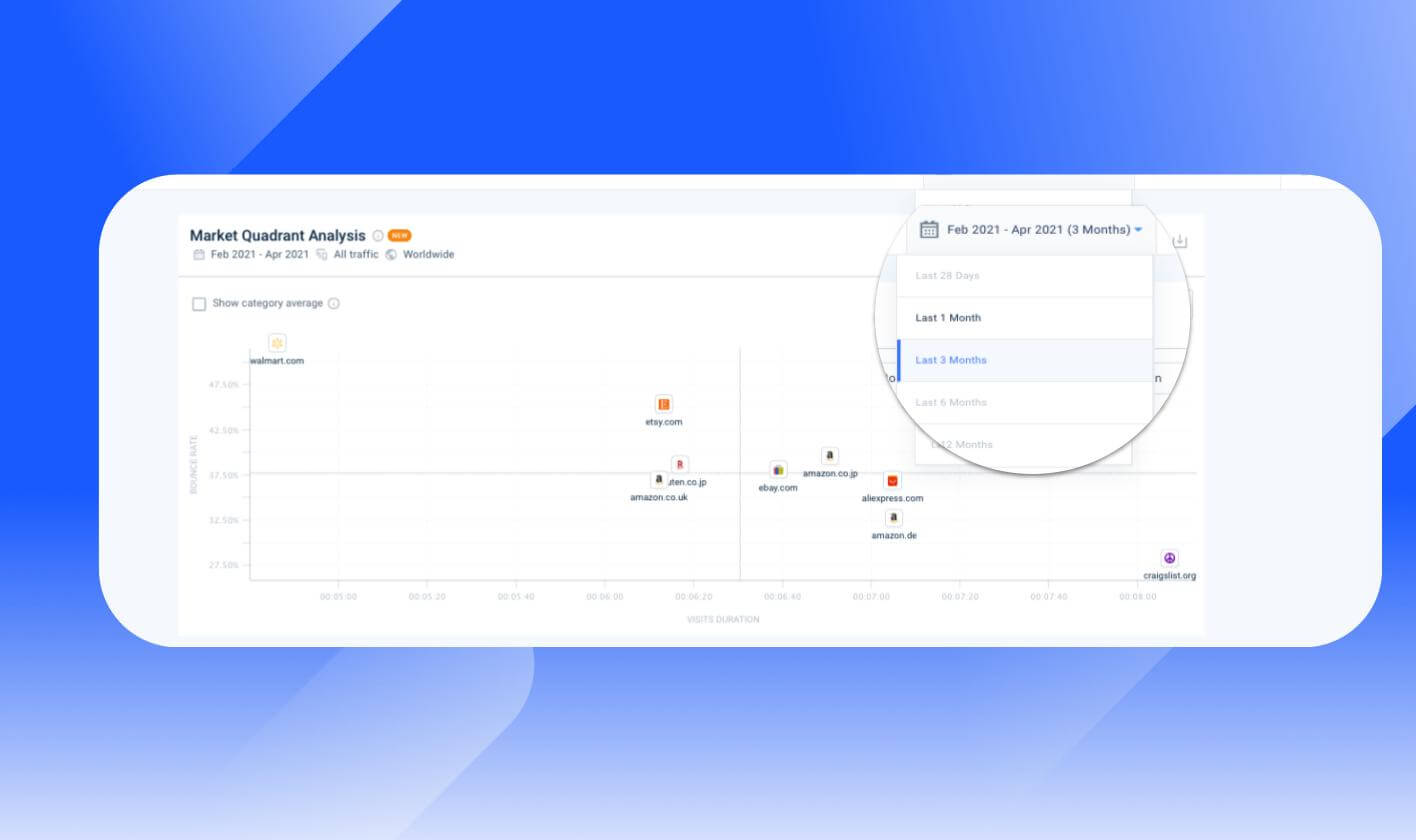
See industry leader’s position change over time: The Market Quadrant Analysis graph in Industry Leaders now comes with additional historical data (up to the last three months) to see who are the rising players and how they change position from one quarter to the next.
Automate conversion analysis insights with API: Integrate and automate your conversion analysis insights with the API to analyze funnel analytics.
Export dashboard data into powerpoint presentations: Easily create PowerPoint presentations from your custom dashboards to share insights with your team plus and export data from Industry Demographics to Excel to analyze outside of the platform.
API for Segment Analysis: Integrate segments created within the platform into your reporting and analysis workflow. Plus connect to data visualization tools like Google Looker Studio and Tableau to seamlessly centralize data sources.
Expanded coverage for Segment Analysis: Build segments beyond top pages to analyze any string combination or URL across any website without any limits.
February
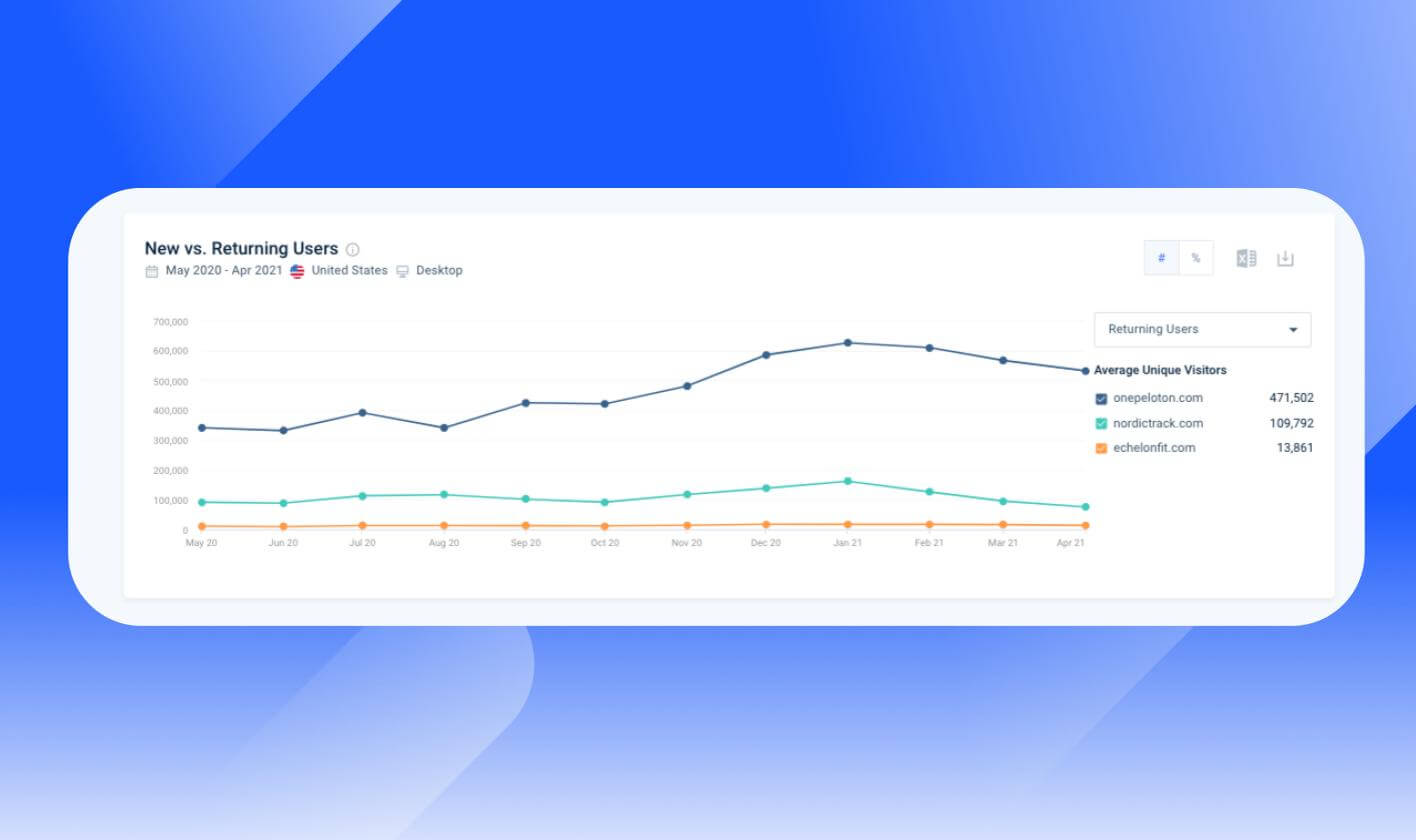
Measure website retention with New vs. Returning Users: The first time we’ve added a retention metric to the platform. This feature enables digital researchers to analyze the percent of new vs returning users when tracking audience growth and retention metrics.
January
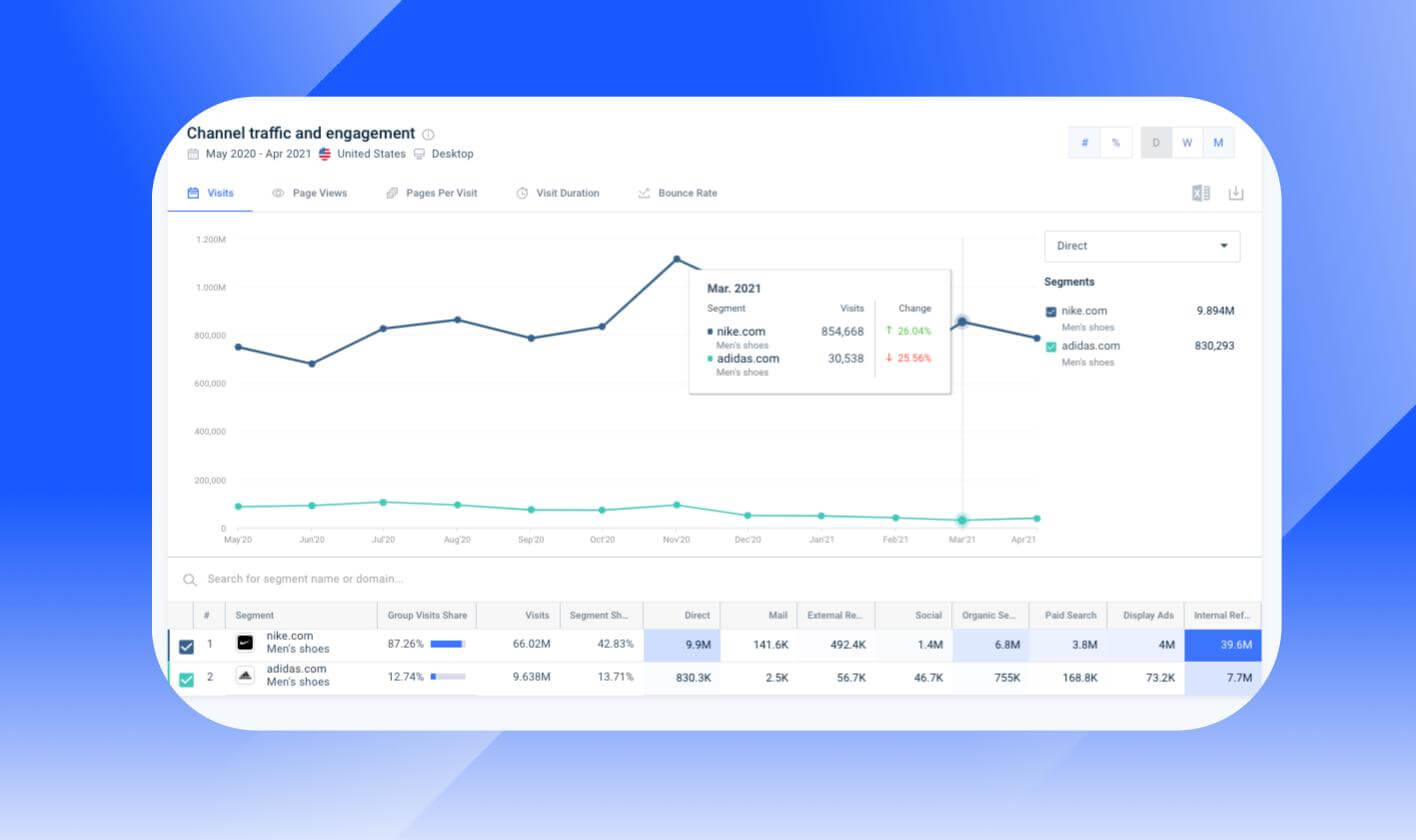
Analyze which marketing channels drive traffic for Segment Analysis: See which marketing channel drives the most traffic over time for a brand, product line or topic across websites.
Try out the latest features
Login in now to take our latest features for a spin and stay tuned for future updates.