You’ve hit your search limit
Start your free trial to keep exploring full traffic and performance insights.
Get StartedAnalyse de l'application Stats tester mini pour le 17 février
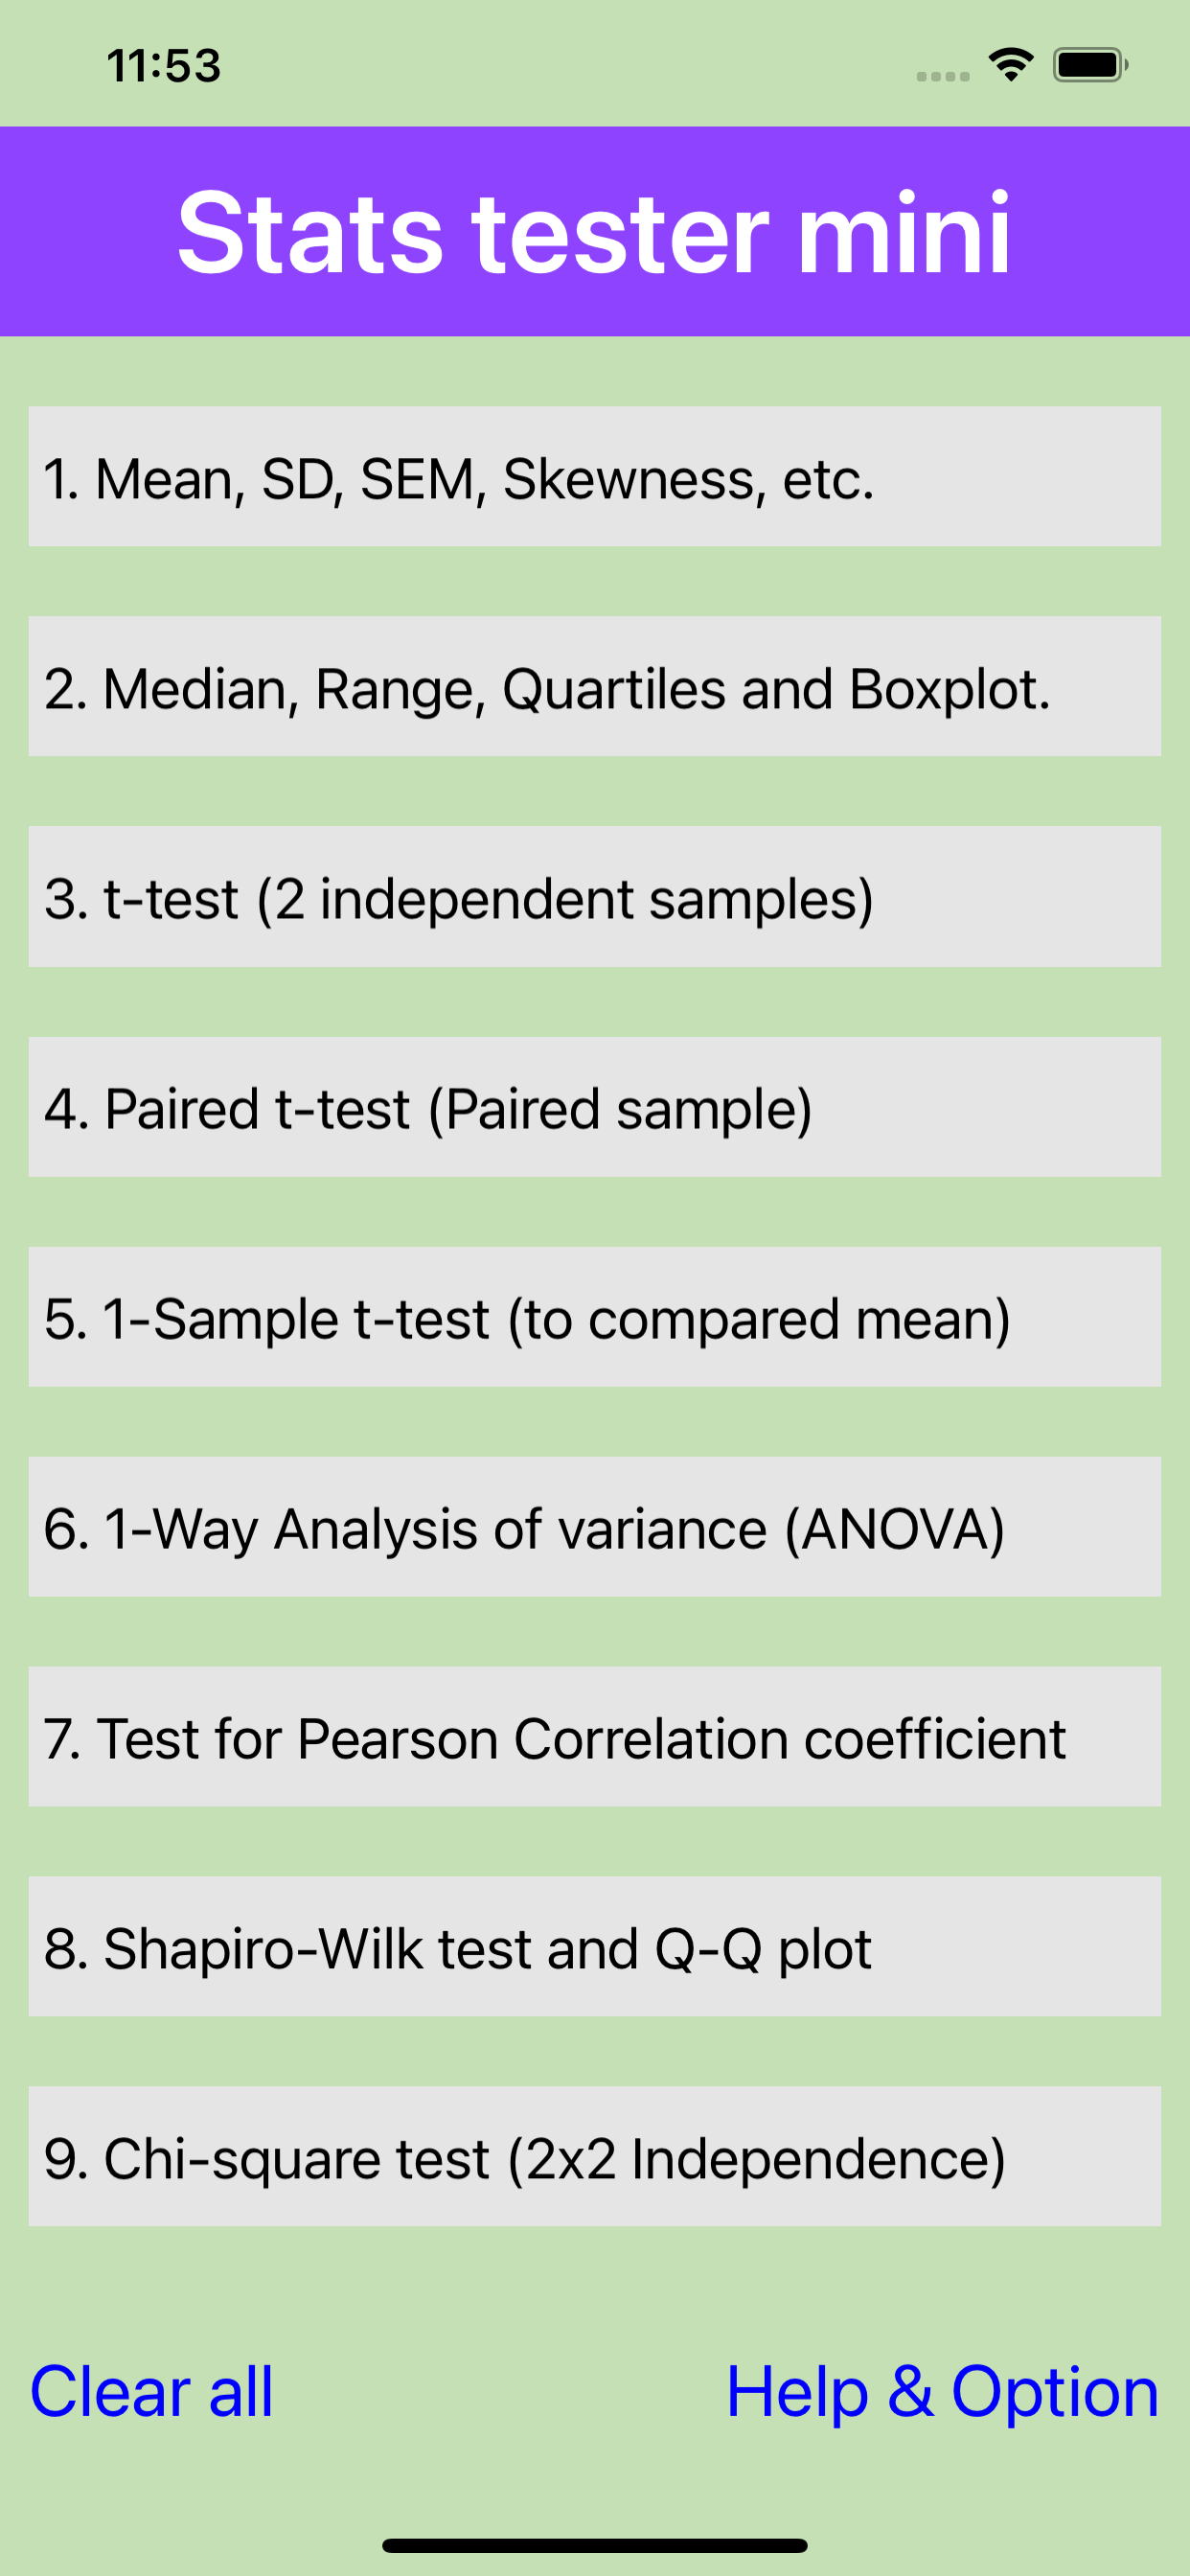
Stats tester mini
- Hideki Ono
- App Store Apple
- Gratuit
- Éducation
### Features of this app ###
1. By using Stats tester mini, you can perform some statistics tests and obtain graphs by an easy operation.
2. Since one sample group (multiple data) is entered in one window, it is very easy to enter or edit the data.
3. Unlike other test apps, not only final conclusions such as p-values, but also intermediate results are shown.
4. Input data and test results can be recorded by sharing (mail, memo). There is no need to make notes on paper.
5. You can import data by copy/paste from apps such as Excel, Numbers, memo, etc.
6. Numerical input is very easy with the built-In ten-keyboard (phone and calculator layouts).
7. This app has been fully verified to work with the M1 Mac. The M1 Mac makes it easy to work with other apps (Numbers, Excel etc.).
## how to use ##
Each test screen has [Help], [Example], [Graph], [Calc], [Clear] and [Share] Buttons.
On the "How to use this app" screen, details such as its features and specifications are written.
### Statistic methods ###
Below are the statistical methods in Stats tester mini. (The upgraded version "Stats tester plus" offers 18 more methods.)
1. Mean, SD, Skewness, Kurtosis, etc.
1) Arithmetic, Geometric and Harmonic means
2) Standard Deviation (2)
3) Standard Error of the mean (sem)
4) 95 and 99% Confidence interval (CI)
5) Sum
6) Sum of Square
7) Variance, Unbiased variance
8) Coefficient of variation (%CV)
9) Skewness (2)
10) Kurtosis (3)
11) Graph
2. Median, Range, Quartiles and Boxplot.
1) Median
2) Maximum
3) Minimum
4) 1st Quartile
5) 3rd Quartile
6) Quartile Deviation
7) Boxplot Graph
3. One-Sample t-Test (to Specified Mean)
1) Mean
2) Standard deviation (2)
3) Standard error of the mean (sem)
4) One-sample t-test --> p value
5) Confidence interval (CI)
6) Graph
4. Two-Sample t-Test (Student's and Welch's t-Tests)
1) Mean
2) Standard deviation (2)
3) Standard error of the mean (sem)
4) Student t-test --> p value
5) Welch's procedure --> p value
6) Graph
5. Paired-Sample t-test
1) Mean
2) Standard error of the mean (sem)
3) Paired t-test --> p value
4) Graph
6. One-Way Analysis of Variance (ANOVA)
1) Mean
2) Standard error of the mean (sem)
3) Analysis of variance --> p value
4) ANOVA table
5) Graph
7. Linear Regression and Test for Pearson Correlation Coefficient
1) Correlation coefficient
2) Regression coefficient (Linear Regression)
3) Coefficient of determination
4) Test for correlation coefficient --> p value
5) Graph
8. Shapiro-Wilk Test (Normality) and Q-Q Plot
1) Kurtosis α4 (α4=3 --> normal distribution)
2) Shapiro-Wilk test --> p value
3) Q-Q Plot (Normal probability plot) graph
9. Chi-Square Test (2X2 Independence)
### Acknowledgment ##
DGChartst library distributed under the Apache 2.0 license was utilized to make graphs.
https://github.com/danielgindi/Charts
http://www.apache.org/licenses/LICENSE-2.0.html
Classement dans le store
Le classement des stores est basé sur plusieurs paramètres définis par Google et Apple.
Toutes les catégories dans
États-Unis--
Éducation dans
États-Unis--
Principaux concurrents & apps alternatives
Applications ayant une forte probabilité d'être utilisées par les mêmes utilisateurs, à partir du même store.
楽しい統計学
Probability Distribution
StatsCalc
js-STAR
février 17, 2026