Best Selling Fresh & Chilled Products & Brands on amazon.co.uk
See the full list of Market Leaders In Amazon Fresh & Chilled in amazon.co.uk for April 1, and read the full analysis below
Last updated : April 1, 2026
Top Brands on the Fresh & Chilled category
See which brands are leading the Fresh & Chilled category on amazon.co.uk. Analyze data on top brands, including their revenue, product views, and conversion rates, offering a clear picture of brand competitiveness within the category.
| Brand | Revenue share | Change | Product views | Change | CVR | Change | ASP | Change | |||||||||||||||||||||||||||||||||||||||||||||||||||||||||||||||||||||||||||||||||||||||||||
|---|---|---|---|---|---|---|---|---|---|---|---|---|---|---|---|---|---|---|---|---|---|---|---|---|---|---|---|---|---|---|---|---|---|---|---|---|---|---|---|---|---|---|---|---|---|---|---|---|---|---|---|---|---|---|---|---|---|---|---|---|---|---|---|---|---|---|---|---|---|---|---|---|---|---|---|---|---|---|---|---|---|---|---|---|---|---|---|---|---|---|---|---|---|---|---|---|---|---|---|
| London Grocery | 8.93% | 5.40pp | 54.3K | 344.70% | 183.16% | 8.95% | £56.27 | 11.05% | |||||||||||||||||||||||||||||||||||||||||||||||||||||||||||||||||||||||||||||||||||||||||||
| KoalaKoi | 2.49% | 2.30pp | 7.8K | 197.29% | 158.58% | 0.62% | £31.95 | 0.26% | |||||||||||||||||||||||||||||||||||||||||||||||||||||||||||||||||||||||||||||||||||||||||||
| Generic | 3.46% | 1.90pp | 33.3K | 31.71% | 142.27% | 5.46% | £47.21 | 10.72% | |||||||||||||||||||||||||||||||||||||||||||||||||||||||||||||||||||||||||||||||||||||||||||
| Pound Veg | 1.84% | 1.81pp | 32.2K | 197.68% | 113.17% | 3.14% | £51.47 | 0.71% | |||||||||||||||||||||||||||||||||||||||||||||||||||||||||||||||||||||||||||||||||||||||||||
| My Exotic Fruit | 1.59% | 1.35pp | 50.2K | 325.04% | 87.93% | 6.46% | £16.40 | 1.35% | |||||||||||||||||||||||||||||||||||||||||||||||||||||||||||||||||||||||||||||||||||||||||||
Who’s winning your category? See top brands by revenue, views, and conversion rate. | |||||||||||||||||||||||||||||||||||||||||||||||||||||||||||||||||||||||||||||||||||||||||||||||||||
Channels Breakdown & Performance
Understand where the top brands in the Fresh & Chilled category get their traffic. This section breaks down the leading traffic sources, revealing which channels drive the most visibility and sales for top-performing brands.
See how top brands drive traffic and sales on Amazon.
See full channel breakdownTop selling sub-categories in the Fresh & Chilled category
Explore the breakdown of sub-categories within the Fresh & Chilled category. This section provides insights into the performance of different sub-categories, helping to identify which segments are growing, which are most competitive, and where consumer interest is shifting.
| Category | Unit sold | Change | Revenue | Change | Product views | Change | |||||||||||||||||||||||||||||||||||||||||||||||||||||||||||||||||||||||||||||||||||||||||||||
|---|---|---|---|---|---|---|---|---|---|---|---|---|---|---|---|---|---|---|---|---|---|---|---|---|---|---|---|---|---|---|---|---|---|---|---|---|---|---|---|---|---|---|---|---|---|---|---|---|---|---|---|---|---|---|---|---|---|---|---|---|---|---|---|---|---|---|---|---|---|---|---|---|---|---|---|---|---|---|---|---|---|---|---|---|---|---|---|---|---|---|---|---|---|---|---|---|---|---|---|
| 84 | 1.50% | 2.62% | 6.82% | < 50 | 3.86% | ||||||||||||||||||||||||||||||||||||||||||||||||||||||||||||||||||||||||||||||||||||||||||||||
| 92 | 1.95% | 7.37% | 9.38% | 84 | 7.34% | ||||||||||||||||||||||||||||||||||||||||||||||||||||||||||||||||||||||||||||||||||||||||||||||
| Plant-Based Milk | < 50 | 9.24% | 9.97% | 5.84% | 88 | 17.67% | |||||||||||||||||||||||||||||||||||||||||||||||||||||||||||||||||||||||||||||||||||||||||||||
| Milk | Unlock full list > | 5.26% | 10.20% | 9.97% | 99 | 8.01% | |||||||||||||||||||||||||||||||||||||||||||||||||||||||||||||||||||||||||||||||||||||||||||||
| < 50 | 6.76% | 16.15% | 5.72% | 88 | 16.06% | ||||||||||||||||||||||||||||||||||||||||||||||||||||||||||||||||||||||||||||||||||||||||||||||
| Cheddar | 95 | 0.96% | 5.63% | 6.90% | 80 | 9.96% | |||||||||||||||||||||||||||||||||||||||||||||||||||||||||||||||||||||||||||||||||||||||||||||
| Artisan & Speciality | 57 | 6.05% | 8.30% | 0.33% | 81 | 9.12% | |||||||||||||||||||||||||||||||||||||||||||||||||||||||||||||||||||||||||||||||||||||||||||||
| Cream Cheeses | 100 | 7.36% | 9.13% | 2.36% | 95 | 11.86% | |||||||||||||||||||||||||||||||||||||||||||||||||||||||||||||||||||||||||||||||||||||||||||||
| Lunchbox & Snacking | 92 | 0.43% | 18.22% | 13.92% | < 50 | 7.66% | |||||||||||||||||||||||||||||||||||||||||||||||||||||||||||||||||||||||||||||||||||||||||||||
| Mozzarella | Unlock full list > | 6.40% | 3.27% | 0.13% | 54 | 8.30% | |||||||||||||||||||||||||||||||||||||||||||||||||||||||||||||||||||||||||||||||||||||||||||||
| 95 | 9.75% | 9.96% | 7.19% | 100 | 19.44% | ||||||||||||||||||||||||||||||||||||||||||||||||||||||||||||||||||||||||||||||||||||||||||||||
| Flavoured | < 50 | 5.09% | 7.73% | 9.69% | 52 | 15.27% | |||||||||||||||||||||||||||||||||||||||||||||||||||||||||||||||||||||||||||||||||||||||||||||
| Kefir | 95 | 9.43% | 6.50% | 7.03% | 80 | 18.14% | |||||||||||||||||||||||||||||||||||||||||||||||||||||||||||||||||||||||||||||||||||||||||||||
| Greek & Strained | 95 | 8.65% | 1.13% | 9.62% | 100 | 8.18% | |||||||||||||||||||||||||||||||||||||||||||||||||||||||||||||||||||||||||||||||||||||||||||||
| Yoghurt Drinks | < 50 | 10.53% | 15.82% | 2.37% | 82 | 9.55% | |||||||||||||||||||||||||||||||||||||||||||||||||||||||||||||||||||||||||||||||||||||||||||||
| Greek & Strained Flavoured Yoghurt | Unlock full list > | 4.34% | 2.62% | 19.79% | 90 | 2.55% | |||||||||||||||||||||||||||||||||||||||||||||||||||||||||||||||||||||||||||||||||||||||||||||
| 84 | 13.27% | 18.65% | 4.75% | 61 | 9.91% | ||||||||||||||||||||||||||||||||||||||||||||||||||||||||||||||||||||||||||||||||||||||||||||||
| Whole Eggs | < 50 | 9.39% | 6.41% | 19.19% | < 50 | 18.33% | |||||||||||||||||||||||||||||||||||||||||||||||||||||||||||||||||||||||||||||||||||||||||||||
| Egg Whites | 82 | 9.83% | 7.65% | 16.31% | 96 | 15.46% | |||||||||||||||||||||||||||||||||||||||||||||||||||||||||||||||||||||||||||||||||||||||||||||
| Egg Substitutes | Unlock full list > | 11.19% | 3.31% | 9.93% | < 50 | 7.14% | |||||||||||||||||||||||||||||||||||||||||||||||||||||||||||||||||||||||||||||||||||||||||||||
| 71 | 11.49% | 19.86% | 6.08% | 67 | 4.45% | ||||||||||||||||||||||||||||||||||||||||||||||||||||||||||||||||||||||||||||||||||||||||||||||
| Butter | 100 | 1.67% | 2.42% | 6.93% | 91 | 3.71% | |||||||||||||||||||||||||||||||||||||||||||||||||||||||||||||||||||||||||||||||||||||||||||||
| Spreads | 99 | 2.45% | 18.90% | 3.36% | 90 | 5.09% | |||||||||||||||||||||||||||||||||||||||||||||||||||||||||||||||||||||||||||||||||||||||||||||
| Ghee | 89 | 5.86% | 11.06% | 8.98% | 85 | 9.08% | |||||||||||||||||||||||||||||||||||||||||||||||||||||||||||||||||||||||||||||||||||||||||||||
| Plant-Based Butter | Unlock full list > | 6.62% | 9.47% | 13.20% | 98 | 0.17% | |||||||||||||||||||||||||||||||||||||||||||||||||||||||||||||||||||||||||||||||||||||||||||||
| 58 | 8.78% | 10.00% | 5.21% | < 50 | 5.64% | ||||||||||||||||||||||||||||||||||||||||||||||||||||||||||||||||||||||||||||||||||||||||||||||
| 82 | 19.94% | 14.44% | 9.23% | 78 | 2.23% | ||||||||||||||||||||||||||||||||||||||||||||||||||||||||||||||||||||||||||||||||||||||||||||||
| Dates | < 50 | 6.68% | 11.94% | 9.20% | < 50 | 8.85% | |||||||||||||||||||||||||||||||||||||||||||||||||||||||||||||||||||||||||||||||||||||||||||||
| Berries | 89 | 9.48% | 9.83% | 18.04% | 92 | 7.12% | |||||||||||||||||||||||||||||||||||||||||||||||||||||||||||||||||||||||||||||||||||||||||||||
| Apples | < 50 | 14.44% | 16.83% | 7.45% | < 50 | 7.09% | |||||||||||||||||||||||||||||||||||||||||||||||||||||||||||||||||||||||||||||||||||||||||||||
| Citrus Fruits | 72 | 13.44% | 17.85% | 7.02% | < 50 | 6.63% | |||||||||||||||||||||||||||||||||||||||||||||||||||||||||||||||||||||||||||||||||||||||||||||
| Prepared Fruit | Unlock full list > | 16.73% | 17.64% | 9.78% | < 50 | 4.26% | |||||||||||||||||||||||||||||||||||||||||||||||||||||||||||||||||||||||||||||||||||||||||||||
| 100 | 9.46% | 7.88% | 7.79% | 93 | 4.02% | ||||||||||||||||||||||||||||||||||||||||||||||||||||||||||||||||||||||||||||||||||||||||||||||
| Prepared Vegetables | 77 | 14.79% | 19.60% | 9.96% | 93 | 5.36% | |||||||||||||||||||||||||||||||||||||||||||||||||||||||||||||||||||||||||||||||||||||||||||||
| Potatoes | < 50 | 9.78% | 7.48% | 16.75% | < 50 | 15.90% | |||||||||||||||||||||||||||||||||||||||||||||||||||||||||||||||||||||||||||||||||||||||||||||
| Peppers | 67 | 6.82% | 9.55% | 0.81% | 62 | 0.16% | |||||||||||||||||||||||||||||||||||||||||||||||||||||||||||||||||||||||||||||||||||||||||||||
| Salad Bags & Bowls | 89 | 10.45% | 2.67% | 9.87% | 70 | 9.94% | |||||||||||||||||||||||||||||||||||||||||||||||||||||||||||||||||||||||||||||||||||||||||||||
| Onions & Leeks | Unlock full list > | 1.55% | 2.55% | 1.16% | 62 | 14.93% | |||||||||||||||||||||||||||||||||||||||||||||||||||||||||||||||||||||||||||||||||||||||||||||
| < 50 | 9.82% | 9.50% | 10.05% | < 50 | 2.48% | ||||||||||||||||||||||||||||||||||||||||||||||||||||||||||||||||||||||||||||||||||||||||||||||
| Parsley | < 50 | 11.70% | 17.24% | 9.96% | < 50 | 6.91% | |||||||||||||||||||||||||||||||||||||||||||||||||||||||||||||||||||||||||||||||||||||||||||||
| Coriander | Unlock full list > | 9.89% | 9.84% | 15.65% | 98 | 1.74% | |||||||||||||||||||||||||||||||||||||||||||||||||||||||||||||||||||||||||||||||||||||||||||||
| Fresh Mixed Fruit & Vegetables Boxes | Unlock full list > | 8.07% | 5.59% | 3.31% | < 50 | 6.72% | |||||||||||||||||||||||||||||||||||||||||||||||||||||||||||||||||||||||||||||||||||||||||||||
| 89 | 8.19% | 4.05% | 16.42% | 92 | 17.28% | ||||||||||||||||||||||||||||||||||||||||||||||||||||||||||||||||||||||||||||||||||||||||||||||
| 75 | 4.02% | 2.17% | 7.96% | 79 | 8.76% | ||||||||||||||||||||||||||||||||||||||||||||||||||||||||||||||||||||||||||||||||||||||||||||||
| Breasts | < 50 | 4.06% | 0.28% | 2.92% | 62 | 9.45% | |||||||||||||||||||||||||||||||||||||||||||||||||||||||||||||||||||||||||||||||||||||||||||||
| Legs & Thighs | 100 | 2.17% | 9.87% | 0.56% | 100 | 1.23% | |||||||||||||||||||||||||||||||||||||||||||||||||||||||||||||||||||||||||||||||||||||||||||||
| Whole Chickens | 69 | 4.14% | 8.25% | 2.83% | 64 | 3.39% | |||||||||||||||||||||||||||||||||||||||||||||||||||||||||||||||||||||||||||||||||||||||||||||
| Breaded Chicken | Unlock full list > | 9.05% | 7.14% | 6.11% | 100 | 5.08% | |||||||||||||||||||||||||||||||||||||||||||||||||||||||||||||||||||||||||||||||||||||||||||||
| 100 | 8.40% | 3.61% | 17.31% | 71 | 5.66% | ||||||||||||||||||||||||||||||||||||||||||||||||||||||||||||||||||||||||||||||||||||||||||||||
| Beef Mince | < 50 | 5.71% | 0.17% | 10.79% | 51 | 14.13% | |||||||||||||||||||||||||||||||||||||||||||||||||||||||||||||||||||||||||||||||||||||||||||||
| Steaks | 95 | 2.22% | 7.08% | 4.68% | 100 | 9.86% | |||||||||||||||||||||||||||||||||||||||||||||||||||||||||||||||||||||||||||||||||||||||||||||
| Burgers | 82 | 9.37% | 7.79% | 9.84% | 97 | 9.63% | |||||||||||||||||||||||||||||||||||||||||||||||||||||||||||||||||||||||||||||||||||||||||||||
| Joints | 82 | 2.27% | 5.64% | 5.49% | 96 | 19.87% | |||||||||||||||||||||||||||||||||||||||||||||||||||||||||||||||||||||||||||||||||||||||||||||
| Diced & Stew Meat | Unlock full list > | 8.27% | 16.72% | 4.23% | 99 | 3.71% | |||||||||||||||||||||||||||||||||||||||||||||||||||||||||||||||||||||||||||||||||||||||||||||
| Sausages & Chipolatas | 100 | 8.28% | 6.21% | 3.70% | 94 | 4.54% | |||||||||||||||||||||||||||||||||||||||||||||||||||||||||||||||||||||||||||||||||||||||||||||
| 66 | 6.41% | 3.42% | 9.48% | 99 | 2.04% | ||||||||||||||||||||||||||||||||||||||||||||||||||||||||||||||||||||||||||||||||||||||||||||||
| Chops & Steaks | 64 | 2.40% | 5.74% | 5.66% | 69 | 19.68% | |||||||||||||||||||||||||||||||||||||||||||||||||||||||||||||||||||||||||||||||||||||||||||||
| Black Pudding | Unlock full list > | 7.24% | 0.04% | 9.34% | 99 | 9.51% | |||||||||||||||||||||||||||||||||||||||||||||||||||||||||||||||||||||||||||||||||||||||||||||
| Bacon & Gammon | Unlock full list > | 2.16% | 6.98% | 7.54% | < 50 | 9.85% | |||||||||||||||||||||||||||||||||||||||||||||||||||||||||||||||||||||||||||||||||||||||||||||
| < 50 | 6.72% | 3.70% | 0.64% | < 50 | 8.07% | ||||||||||||||||||||||||||||||||||||||||||||||||||||||||||||||||||||||||||||||||||||||||||||||
| 99 | 9.78% | 4.69% | 5.15% | 99 | 6.02% | ||||||||||||||||||||||||||||||||||||||||||||||||||||||||||||||||||||||||||||||||||||||||||||||
| Ham | 99 | 9.09% | 9.97% | 6.23% | 100 | 5.01% | |||||||||||||||||||||||||||||||||||||||||||||||||||||||||||||||||||||||||||||||||||||||||||||
| Salami | 99 | 9.16% | 9.96% | 19.76% | 88 | 5.59% | |||||||||||||||||||||||||||||||||||||||||||||||||||||||||||||||||||||||||||||||||||||||||||||
| Chicken | 100 | 7.10% | 9.66% | 1.31% | 96 | 7.75% | |||||||||||||||||||||||||||||||||||||||||||||||||||||||||||||||||||||||||||||||||||||||||||||
| Chorizo | 50 | 8.24% | 9.96% | 3.73% | 56 | 3.01% | |||||||||||||||||||||||||||||||||||||||||||||||||||||||||||||||||||||||||||||||||||||||||||||
| Turkey | Unlock full list > | 9.68% | 9.68% | 16.88% | 91 | 8.19% | |||||||||||||||||||||||||||||||||||||||||||||||||||||||||||||||||||||||||||||||||||||||||||||
| 99 | 14.11% | 17.16% | 7.31% | 89 | 2.20% | ||||||||||||||||||||||||||||||||||||||||||||||||||||||||||||||||||||||||||||||||||||||||||||||
| Houmous | 90 | 9.86% | 9.43% | 10.37% | 93 | 9.56% | |||||||||||||||||||||||||||||||||||||||||||||||||||||||||||||||||||||||||||||||||||||||||||||
| Dips | Unlock full list > | 9.88% | 9.86% | 15.86% | < 50 | 1.91% | |||||||||||||||||||||||||||||||||||||||||||||||||||||||||||||||||||||||||||||||||||||||||||||
| 90 | 6.46% | 14.74% | 2.99% | 99 | 2.43% | ||||||||||||||||||||||||||||||||||||||||||||||||||||||||||||||||||||||||||||||||||||||||||||||
| Chopped Herring | Unlock full list > | 9.91% | 9.32% | 10.89% | 100 | 1.88% | |||||||||||||||||||||||||||||||||||||||||||||||||||||||||||||||||||||||||||||||||||||||||||||
| 98 | 5.30% | 7.87% | 10.06% | 99 | 14.89% | ||||||||||||||||||||||||||||||||||||||||||||||||||||||||||||||||||||||||||||||||||||||||||||||
| Olives | Unlock full list > | 19.56% | 1.39% | 4.20% | 74 | 10.83% | |||||||||||||||||||||||||||||||||||||||||||||||||||||||||||||||||||||||||||||||||||||||||||||
| 92 | 9.97% | 8.30% | 14.53% | 94 | 13.69% | ||||||||||||||||||||||||||||||||||||||||||||||||||||||||||||||||||||||||||||||||||||||||||||||
| 98 | 3.89% | 0.23% | 8.26% | 84 | 1.46% | ||||||||||||||||||||||||||||||||||||||||||||||||||||||||||||||||||||||||||||||||||||||||||||||
| Salmon | 63 | 4.29% | 0.21% | 1.32% | 69 | 11.66% | |||||||||||||||||||||||||||||||||||||||||||||||||||||||||||||||||||||||||||||||||||||||||||||
| Tuna | 72 | 15.14% | 9.69% | 7.73% | 90 | 1.37% | |||||||||||||||||||||||||||||||||||||||||||||||||||||||||||||||||||||||||||||||||||||||||||||
| Cod | 83 | 3.86% | 0.04% | 3.13% | 62 | 9.51% | |||||||||||||||||||||||||||||||||||||||||||||||||||||||||||||||||||||||||||||||||||||||||||||
| Anchovies | < 50 | 2.00% | 2.20% | 4.86% | 72 | 9.89% | |||||||||||||||||||||||||||||||||||||||||||||||||||||||||||||||||||||||||||||||||||||||||||||
| Sardines | Unlock full list > | 2.09% | 7.00% | 4.78% | 74 | 5.26% | |||||||||||||||||||||||||||||||||||||||||||||||||||||||||||||||||||||||||||||||||||||||||||||
| 96 | 8.13% | 9.94% | 3.46% | 98 | 6.64% | ||||||||||||||||||||||||||||||||||||||||||||||||||||||||||||||||||||||||||||||||||||||||||||||
| Shrimp & Prawns | 100 | 0.09% | 4.46% | 5.76% | 92 | 5.13% | |||||||||||||||||||||||||||||||||||||||||||||||||||||||||||||||||||||||||||||||||||||||||||||
| Scallops | 80 | 9.01% | 7.06% | 5.95% | 75 | 5.19% | |||||||||||||||||||||||||||||||||||||||||||||||||||||||||||||||||||||||||||||||||||||||||||||
| Oysters | Unlock full list > | 5.83% | 8.15% | 0.00% | < 50 | 8.71% | |||||||||||||||||||||||||||||||||||||||||||||||||||||||||||||||||||||||||||||||||||||||||||||
| Smoked Salmon | 100 | 6.95% | 15.28% | 3.34% | 95 | 2.79% | |||||||||||||||||||||||||||||||||||||||||||||||||||||||||||||||||||||||||||||||||||||||||||||
| Caviars & Roes | Unlock full list > | 0.34% | 3.98% | 7.28% | 77 | 1.19% | |||||||||||||||||||||||||||||||||||||||||||||||||||||||||||||||||||||||||||||||||||||||||||||
| 84 | 1.50% | 2.62% | 6.82% | < 50 | 3.86% | ||||||||||||||||||||||||||||||||||||||||||||||||||||||||||||||||||||||||||||||||||||||||||||||
| 92 | 1.95% | 7.37% | 9.38% | 84 | 7.34% | ||||||||||||||||||||||||||||||||||||||||||||||||||||||||||||||||||||||||||||||||||||||||||||||
| Plant-Based Milk | < 50 | 9.24% | 9.97% | 5.84% | 88 | 17.67% | |||||||||||||||||||||||||||||||||||||||||||||||||||||||||||||||||||||||||||||||||||||||||||||
| Milk | Unlock full list > | 5.26% | 10.20% | 9.97% | 99 | 8.01% | |||||||||||||||||||||||||||||||||||||||||||||||||||||||||||||||||||||||||||||||||||||||||||||
| < 50 | 6.76% | 16.15% | 5.72% | 88 | 16.06% | ||||||||||||||||||||||||||||||||||||||||||||||||||||||||||||||||||||||||||||||||||||||||||||||
Track category trends month over month See which categories are growing based on sales, revenue, and views. | |||||||||||||||||||||||||||||||||||||||||||||||||||||||||||||||||||||||||||||||||||||||||||||||||||
Top Products on the Fresh & Chilled Category
Discover the most-viewed products in the Fresh & Chilled category. This section highlights the top-performing products based on product views, revenue, and units sold, giving a snapshot of what’s driving consumer interest and purchases.
| Product | Category | Brand | Product Views | Change | Revenue | Change | Units Sold | Change | |||||||||||||||||||||||||||||||||||||||||||||||||||||||||||||||||||||||||||||||||||||||||||
|---|---|---|---|---|---|---|---|---|---|---|---|---|---|---|---|---|---|---|---|---|---|---|---|---|---|---|---|---|---|---|---|---|---|---|---|---|---|---|---|---|---|---|---|---|---|---|---|---|---|---|---|---|---|---|---|---|---|---|---|---|---|---|---|---|---|---|---|---|---|---|---|---|---|---|---|---|---|---|---|---|---|---|---|---|---|---|---|---|---|---|---|---|---|---|---|---|---|---|---|
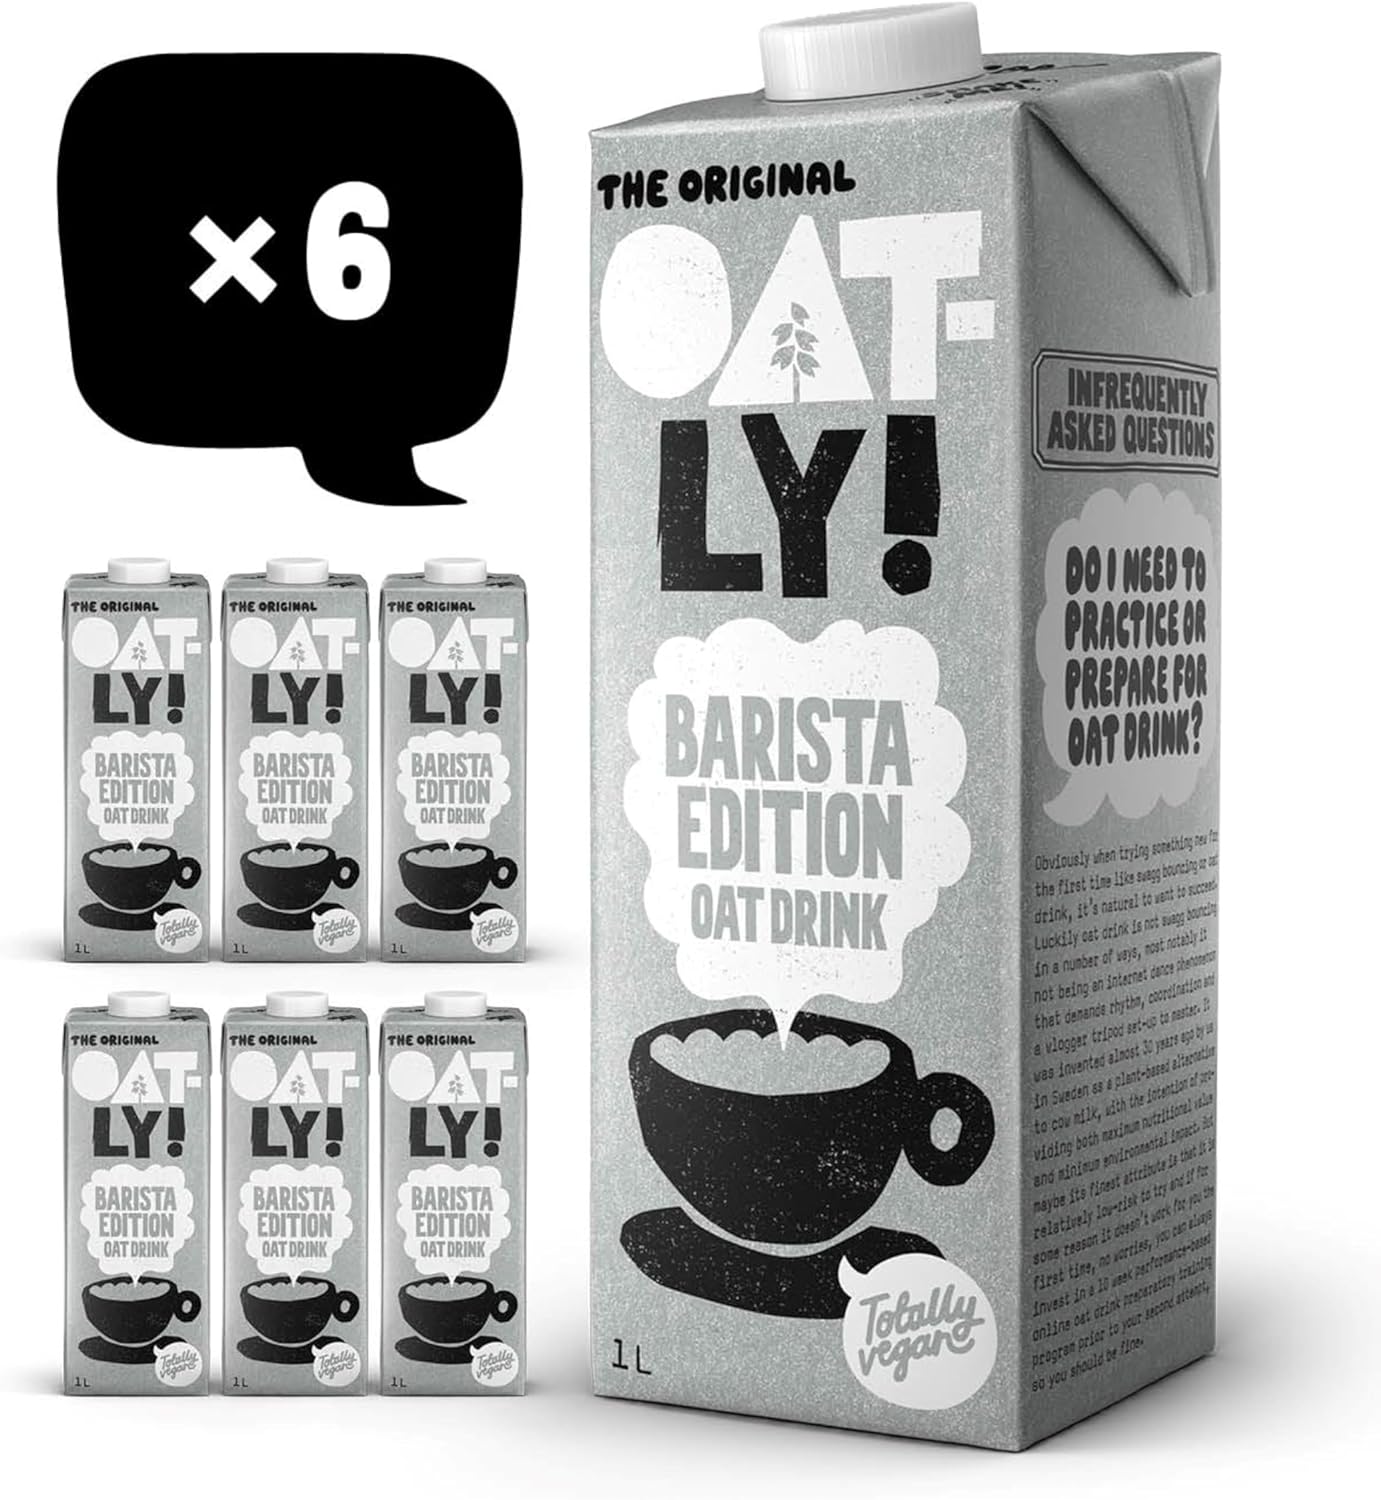 | ...> Oat | OATLY | 42.7K | 69.13% | 13.81% | 2.24% | 93 | 9.01% | |||||||||||||||||||||||||||||||||||||||||||||||||||||||||||||||||||||||||||||||||||||||||||
 | ...> Breasts | Morrisons | 22.9K | = | 6.02% | 9.77% | 72 | 2.60% | |||||||||||||||||||||||||||||||||||||||||||||||||||||||||||||||||||||||||||||||||||||||||||
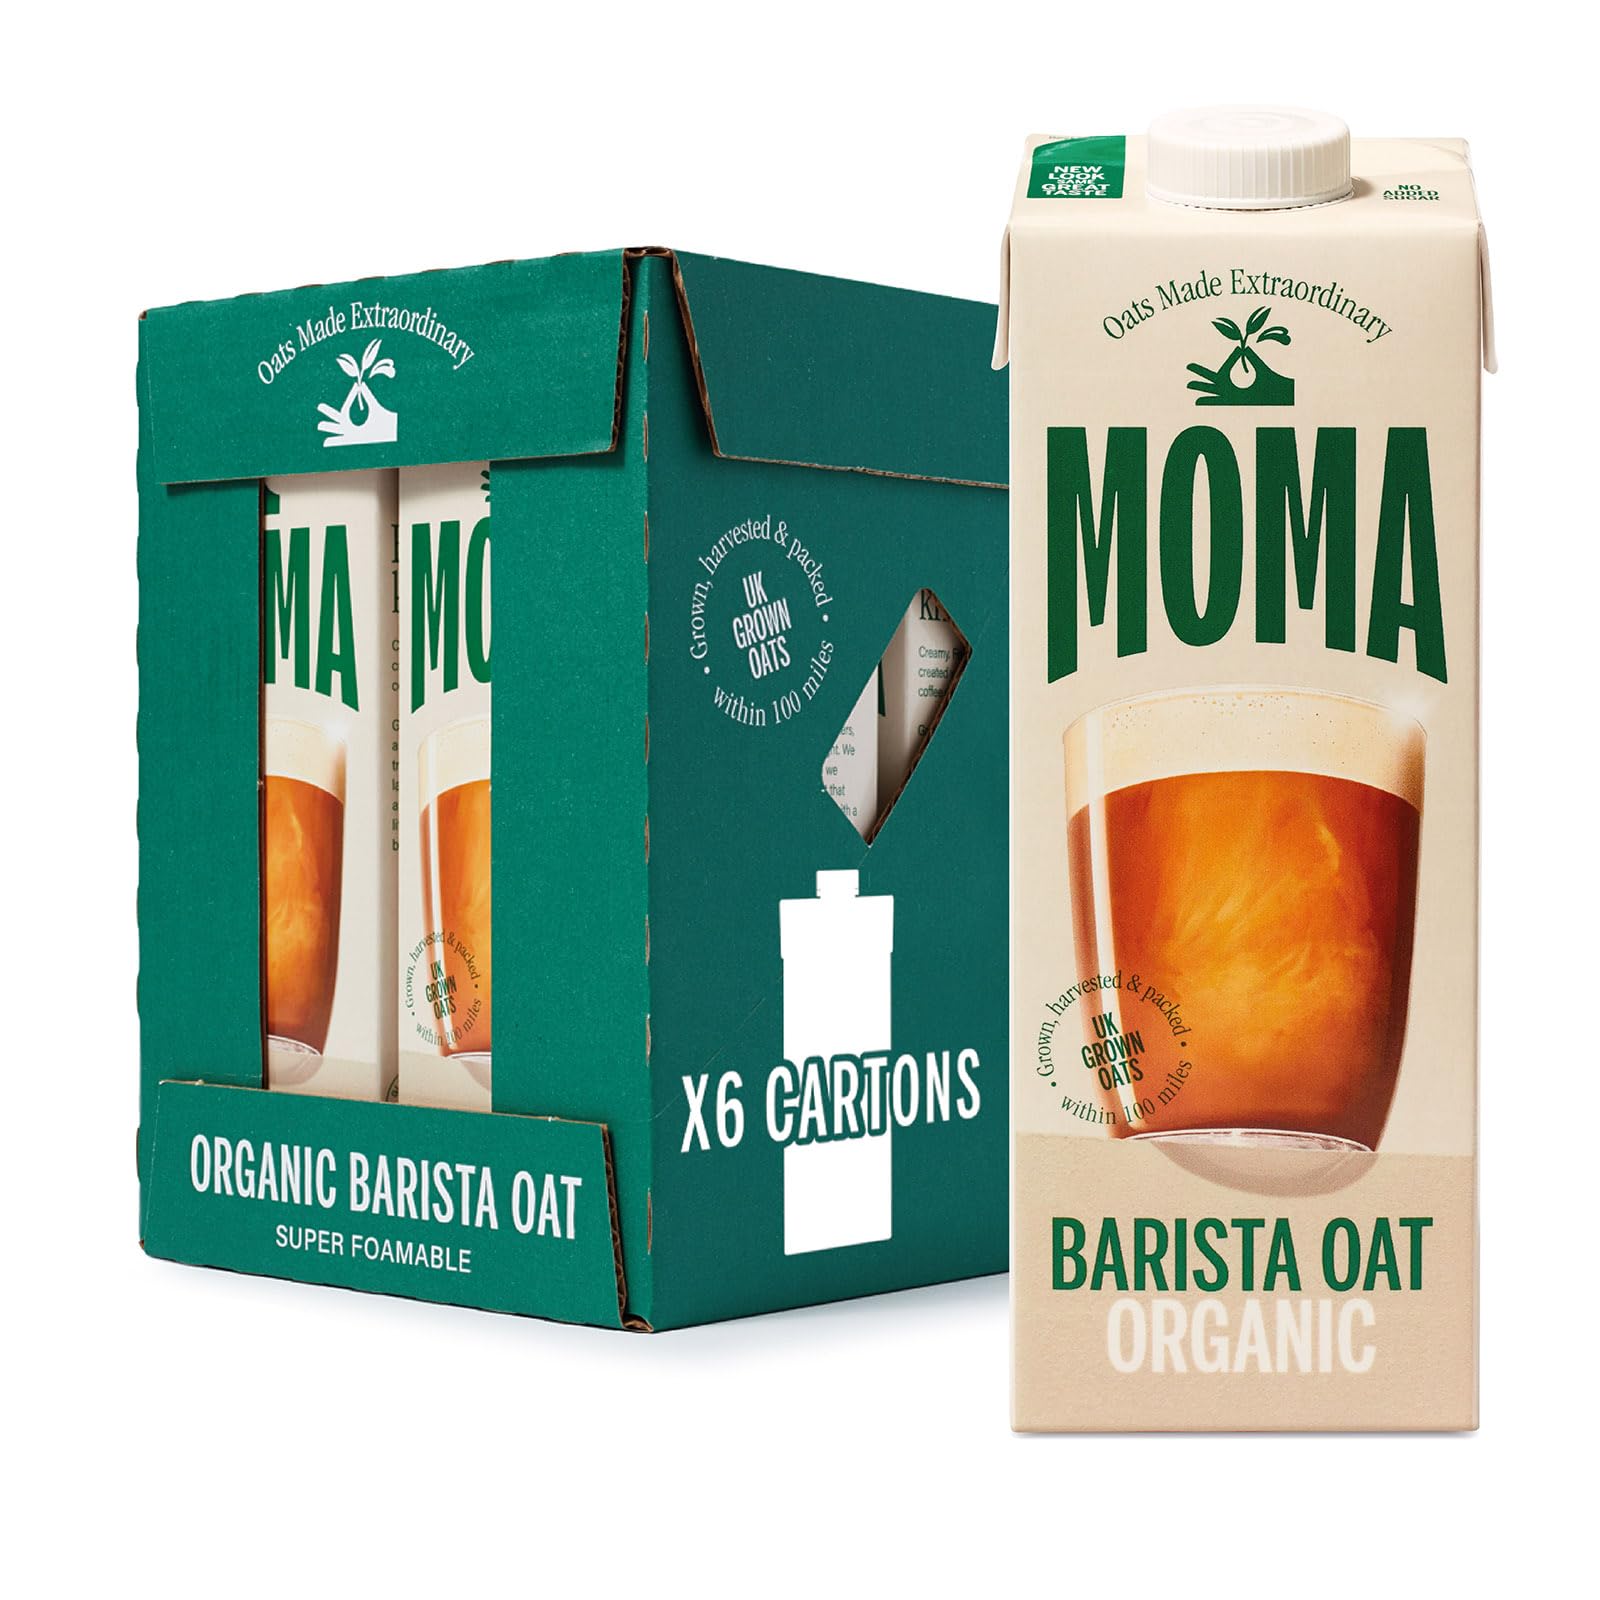 | ...> Oat | MOMA | 21K | = | 7.06% | 9.34% | 94 | 14.92% | |||||||||||||||||||||||||||||||||||||||||||||||||||||||||||||||||||||||||||||||||||||||||||
 | ...> Milk | Amazon | 19.9K | = | 9.71% | 8.96% | 73 | 1.62% | |||||||||||||||||||||||||||||||||||||||||||||||||||||||||||||||||||||||||||||||||||||||||||
 | ...> Oat | OATLY | 19.4K | 2.48% | 1.51% | 10.21% | 60 | 8.43% | |||||||||||||||||||||||||||||||||||||||||||||||||||||||||||||||||||||||||||||||||||||||||||
| ...> Oat | OATLY | 42.7K | 69.13% | 13.81% | 2.24% | 93 | 9.01% | |||||||||||||||||||||||||||||||||||||||||||||||||||||||||||||||||||||||||||||||||||||||||||
| ...> Breasts | Morrisons | 22.9K | = | 6.02% | 9.77% | 72 | 2.60% | |||||||||||||||||||||||||||||||||||||||||||||||||||||||||||||||||||||||||||||||||||||||||||
| ...> Oat | MOMA | 21K | = | 7.06% | 9.34% | 94 | 14.92% | |||||||||||||||||||||||||||||||||||||||||||||||||||||||||||||||||||||||||||||||||||||||||||
| ...> Milk | Amazon | 19.9K | = | 9.71% | 8.96% | 73 | 1.62% | |||||||||||||||||||||||||||||||||||||||||||||||||||||||||||||||||||||||||||||||||||||||||||
| ...> Oat | OATLY | 19.4K | 2.48% | 1.51% | 10.21% | 60 | 8.43% | |||||||||||||||||||||||||||||||||||||||||||||||||||||||||||||||||||||||||||||||||||||||||||
What’s selling—and why Explore the top-performing products on Amazon based on product views, sales, and revenue.Spot trends, category winners, and emerging bestsellers at a glance. | |||||||||||||||||||||||||||||||||||||||||||||||||||||||||||||||||||||||||||||||||||||||||||||||||||