

Best Selling Grocery Products & Brands on amazon.co.uk
See the full list of Market Leaders In Amazon Grocery in amazon.co.uk for November 1, and read the full analysis below
Last updated : November 1, 2026
Top Brands on the Grocery category
See which brands are leading the Grocery category on amazon.co.uk. Analyze data on top brands, including their revenue, product views, and conversion rates, offering a clear picture of brand competitiveness within the category.
| Brand | Revenue share | Change | Product views | Change | CVR | Change | ASP | Change | |||||||||||||||||||||||||||||||||||||||||||||||||||||||||||||||||||||||||||||||||||||||||||
|---|---|---|---|---|---|---|---|---|---|---|---|---|---|---|---|---|---|---|---|---|---|---|---|---|---|---|---|---|---|---|---|---|---|---|---|---|---|---|---|---|---|---|---|---|---|---|---|---|---|---|---|---|---|---|---|---|---|---|---|---|---|---|---|---|---|---|---|---|---|---|---|---|---|---|---|---|---|---|---|---|---|---|---|---|---|---|---|---|---|---|---|---|---|---|---|---|---|---|---|
| PerfectDraft | 0.51% | 0.47pp | 23.4K | 153.84% | 38.96% | 1.06% | £269.66 | 634.60% | |||||||||||||||||||||||||||||||||||||||||||||||||||||||||||||||||||||||||||||||||||||||||||
| Amazon | 3.29% | 0.44pp | 21.5K | 153.15% | 23.84% | 0.47% | £30.44 | 573.28% | |||||||||||||||||||||||||||||||||||||||||||||||||||||||||||||||||||||||||||||||||||||||||||
| Kenco | 0.61% | 0.33pp | 14.3K | 57.70% | 14.77% | 1.05% | £228.93 | 615.65% | |||||||||||||||||||||||||||||||||||||||||||||||||||||||||||||||||||||||||||||||||||||||||||
| Ariel | 0.48% | 0.30pp | 16.9K | 47.73% | 2.81% | 0.09% | £39.25 | 582.05% | |||||||||||||||||||||||||||||||||||||||||||||||||||||||||||||||||||||||||||||||||||||||||||
| Ecover | 0.74% | 0.29pp | 15.9K | 46.71% | 0.02% | 0.21% | £255.37 | 261.52% | |||||||||||||||||||||||||||||||||||||||||||||||||||||||||||||||||||||||||||||||||||||||||||
| PerfectDraft | 0.51% | 0.47pp | 23.4K | 153.84% | 38.96% | 1.06% | £269.66 | 634.60% | |||||||||||||||||||||||||||||||||||||||||||||||||||||||||||||||||||||||||||||||||||||||||||
| Amazon | 3.29% | 0.44pp | 21.5K | 153.15% | 23.84% | 0.47% | £30.44 | 573.28% | |||||||||||||||||||||||||||||||||||||||||||||||||||||||||||||||||||||||||||||||||||||||||||
| Kenco | 0.61% | 0.33pp | 14.3K | 57.70% | 14.77% | 1.05% | £228.93 | 615.65% | |||||||||||||||||||||||||||||||||||||||||||||||||||||||||||||||||||||||||||||||||||||||||||
| Ariel | 0.48% | 0.30pp | 16.9K | 47.73% | 2.81% | 0.09% | £39.25 | 582.05% | |||||||||||||||||||||||||||||||||||||||||||||||||||||||||||||||||||||||||||||||||||||||||||
| Ecover | 0.74% | 0.29pp | 15.9K | 46.71% | 0.02% | 0.21% | £255.37 | 261.52% | |||||||||||||||||||||||||||||||||||||||||||||||||||||||||||||||||||||||||||||||||||||||||||
Who’s winning your category? See top brands by revenue, views, and conversion rate. | |||||||||||||||||||||||||||||||||||||||||||||||||||||||||||||||||||||||||||||||||||||||||||||||||||
Channels Breakdown & Performance
Understand where the top brands in the Grocery category get their traffic. This section breaks down the leading traffic sources, revealing which channels drive the most visibility and sales for top-performing brands.
See how top brands drive traffic and sales on Amazon.
See full channel breakdownTop selling sub-categories in the Grocery category
Explore the breakdown of sub-categories within the Grocery category. This section provides insights into the performance of different sub-categories, helping to identify which segments are growing, which are most competitive, and where consumer interest is shifting.
| Category | Unit sold | Change | Revenue | Change | Product views | Change | |||||||||||||||||||||||||||||||||||||||||||||||||||||||||||||||||||||||||||||||||||||||||||||
|---|---|---|---|---|---|---|---|---|---|---|---|---|---|---|---|---|---|---|---|---|---|---|---|---|---|---|---|---|---|---|---|---|---|---|---|---|---|---|---|---|---|---|---|---|---|---|---|---|---|---|---|---|---|---|---|---|---|---|---|---|---|---|---|---|---|---|---|---|---|---|---|---|---|---|---|---|---|---|---|---|---|---|---|---|---|---|---|---|---|---|---|---|---|---|---|---|---|---|---|
| 61 | 12.98% | 5.94% | 9.85% | < 50 | 4.03% | ||||||||||||||||||||||||||||||||||||||||||||||||||||||||||||||||||||||||||||||||||||||||||||||
| 54 | 10.00% | 0.31% | 3.08% | 91 | 8.25% | ||||||||||||||||||||||||||||||||||||||||||||||||||||||||||||||||||||||||||||||||||||||||||||||
| Chocolate Candy | 77 | 2.88% | 6.00% | 4.06% | 51 | 4.18% | |||||||||||||||||||||||||||||||||||||||||||||||||||||||||||||||||||||||||||||||||||||||||||||
| Snack Foods | 54 | 5.70% | 8.07% | 0.18% | < 50 | 8.49% | |||||||||||||||||||||||||||||||||||||||||||||||||||||||||||||||||||||||||||||||||||||||||||||
| Confectionery | 96 | 3.97% | 12.72% | 2.93% | 64 | 12.81% | |||||||||||||||||||||||||||||||||||||||||||||||||||||||||||||||||||||||||||||||||||||||||||||
| Breakfast Bars | Unlock full list > | 8.98% | 5.52% | 5.29% | < 50 | 19.90% | |||||||||||||||||||||||||||||||||||||||||||||||||||||||||||||||||||||||||||||||||||||||||||||
| 100 | 3.67% | 7.98% | 3.32% | 100 | 9.56% | ||||||||||||||||||||||||||||||||||||||||||||||||||||||||||||||||||||||||||||||||||||||||||||||
| Vegetables | < 50 | 4.28% | 0.22% | 1.31% | 68 | 11.68% | |||||||||||||||||||||||||||||||||||||||||||||||||||||||||||||||||||||||||||||||||||||||||||||
| Pulses & Beans | 88 | 9.21% | 14.64% | 9.71% | 99 | 7.96% | |||||||||||||||||||||||||||||||||||||||||||||||||||||||||||||||||||||||||||||||||||||||||||||
| Fish & Seafood | 89 | 0.52% | 3.41% | 2.21% | 99 | 16.24% | |||||||||||||||||||||||||||||||||||||||||||||||||||||||||||||||||||||||||||||||||||||||||||||
| Soups, Stews & Chillies | 64 | 0.68% | 3.75% | 5.86% | 69 | 9.99% | |||||||||||||||||||||||||||||||||||||||||||||||||||||||||||||||||||||||||||||||||||||||||||||
| Pickles & Relishes | Unlock full list > | 13.51% | 18.89% | 4.96% | 71 | 9.93% | |||||||||||||||||||||||||||||||||||||||||||||||||||||||||||||||||||||||||||||||||||||||||||||
| 90 | 3.12% | 9.59% | 6.88% | 99 | 9.58% | ||||||||||||||||||||||||||||||||||||||||||||||||||||||||||||||||||||||||||||||||||||||||||||||
| Sugars | < 50 | 6.51% | 1.90% | 15.25% | < 50 | 4.52% | |||||||||||||||||||||||||||||||||||||||||||||||||||||||||||||||||||||||||||||||||||||||||||||
| Icing & Decorations | < 50 | 1.80% | 9.96% | 3.40% | 76 | 7.24% | |||||||||||||||||||||||||||||||||||||||||||||||||||||||||||||||||||||||||||||||||||||||||||||
| Baking Mixes | < 50 | 9.79% | 9.94% | 7.32% | 73 | 19.12% | |||||||||||||||||||||||||||||||||||||||||||||||||||||||||||||||||||||||||||||||||||||||||||||
| Baking Powder & Raising Agents | < 50 | 11.98% | 6.90% | 18.90% | 62 | 7.41% | |||||||||||||||||||||||||||||||||||||||||||||||||||||||||||||||||||||||||||||||||||||||||||||
| Sugar Substitutes | Unlock full list > | 0.39% | 5.89% | 9.87% | 54 | 5.84% | |||||||||||||||||||||||||||||||||||||||||||||||||||||||||||||||||||||||||||||||||||||||||||||
| 92 | 2.97% | 7.70% | 3.70% | < 50 | 6.94% | ||||||||||||||||||||||||||||||||||||||||||||||||||||||||||||||||||||||||||||||||||||||||||||||
| Whole Spices & Herbs | 83 | 9.40% | 7.84% | 9.83% | 99 | 9.76% | |||||||||||||||||||||||||||||||||||||||||||||||||||||||||||||||||||||||||||||||||||||||||||||
| Powdered Spices & Seasonings | < 50 | 4.48% | 1.54% | 8.68% | < 50 | 9.49% | |||||||||||||||||||||||||||||||||||||||||||||||||||||||||||||||||||||||||||||||||||||||||||||
| Salt | 90 | 17.37% | 17.20% | 8.46% | 69 | 9.95% | |||||||||||||||||||||||||||||||||||||||||||||||||||||||||||||||||||||||||||||||||||||||||||||
| Pepper | Unlock full list > | 7.85% | 17.35% | 4.67% | 91 | 17.26% | |||||||||||||||||||||||||||||||||||||||||||||||||||||||||||||||||||||||||||||||||||||||||||||
| 74 | 7.05% | 12.14% | 0.52% | < 50 | 8.67% | ||||||||||||||||||||||||||||||||||||||||||||||||||||||||||||||||||||||||||||||||||||||||||||||
| Rice | 99 | 11.30% | 6.27% | 19.61% | 81 | 7.11% | |||||||||||||||||||||||||||||||||||||||||||||||||||||||||||||||||||||||||||||||||||||||||||||
| Pasta | 84 | 14.49% | 16.79% | 7.47% | 80 | 1.90% | |||||||||||||||||||||||||||||||||||||||||||||||||||||||||||||||||||||||||||||||||||||||||||||
| Beans & Pulses | < 50 | 19.92% | 11.44% | 9.20% | < 50 | 8.99% | |||||||||||||||||||||||||||||||||||||||||||||||||||||||||||||||||||||||||||||||||||||||||||||
| Whole Grains | 100 | 5.04% | 0.79% | 9.59% | 99 | 10.41% | |||||||||||||||||||||||||||||||||||||||||||||||||||||||||||||||||||||||||||||||||||||||||||||
| Noodles | Unlock full list > | 10.00% | 9.51% | 13.39% | < 50 | 0.03% | |||||||||||||||||||||||||||||||||||||||||||||||||||||||||||||||||||||||||||||||||||||||||||||
| 97 | 8.52% | 9.73% | 4.37% | 99 | 15.00% | ||||||||||||||||||||||||||||||||||||||||||||||||||||||||||||||||||||||||||||||||||||||||||||||
| 82 | 5.37% | 10.32% | 1.87% | 59 | 8.06% | ||||||||||||||||||||||||||||||||||||||||||||||||||||||||||||||||||||||||||||||||||||||||||||||
| Toilet Cleaners | < 50 | 8.08% | 13.23% | 0.31% | 73 | 8.98% | |||||||||||||||||||||||||||||||||||||||||||||||||||||||||||||||||||||||||||||||||||||||||||||
| All-Purpose Cleaners | 90 | 2.92% | 6.03% | 4.01% | 95 | 4.23% | |||||||||||||||||||||||||||||||||||||||||||||||||||||||||||||||||||||||||||||||||||||||||||||
| Drain Openers | 81 | 6.24% | 8.43% | 0.62% | 99 | 9.49% | |||||||||||||||||||||||||||||||||||||||||||||||||||||||||||||||||||||||||||||||||||||||||||||
| De-Scalers | 81 | 4.34% | 9.21% | 2.66% | 57 | 7.62% | |||||||||||||||||||||||||||||||||||||||||||||||||||||||||||||||||||||||||||||||||||||||||||||
| Floor Cleaners | Unlock full list > | 5.87% | 2.71% | 9.25% | < 50 | 1.17% | |||||||||||||||||||||||||||||||||||||||||||||||||||||||||||||||||||||||||||||||||||||||||||||
| 80 | 9.99% | 9.62% | 8.40% | 96 | 16.21% | ||||||||||||||||||||||||||||||||||||||||||||||||||||||||||||||||||||||||||||||||||||||||||||||
| Toilet Tissues | < 50 | 8.58% | 9.76% | 4.49% | 50 | 15.20% | |||||||||||||||||||||||||||||||||||||||||||||||||||||||||||||||||||||||||||||||||||||||||||||
| Kitchen Roll | 96 | 9.92% | 9.02% | 9.20% | 81 | 13.36% | |||||||||||||||||||||||||||||||||||||||||||||||||||||||||||||||||||||||||||||||||||||||||||||
| Facial Tissues | 62 | 13.66% | 19.04% | 5.08% | 60 | 9.94% | |||||||||||||||||||||||||||||||||||||||||||||||||||||||||||||||||||||||||||||||||||||||||||||
| Moist Wipes | Unlock full list > | 16.51% | 18.07% | 7.66% | 100 | 9.99% | |||||||||||||||||||||||||||||||||||||||||||||||||||||||||||||||||||||||||||||||||||||||||||||
| 99 | 19.39% | 15.20% | 10.35% | 63 | 9.76% | ||||||||||||||||||||||||||||||||||||||||||||||||||||||||||||||||||||||||||||||||||||||||||||||
| Liquid Detergent | 78 | 10.00% | 9.60% | 8.44% | 95 | 16.08% | |||||||||||||||||||||||||||||||||||||||||||||||||||||||||||||||||||||||||||||||||||||||||||||
| Detergent Capsules & Tablets | 88 | 9.33% | 9.99% | 6.04% | 99 | 18.07% | |||||||||||||||||||||||||||||||||||||||||||||||||||||||||||||||||||||||||||||||||||||||||||||
| Liquid Fabric Softener | < 50 | 17.72% | 12.37% | 13.12% | < 50 | 9.25% | |||||||||||||||||||||||||||||||||||||||||||||||||||||||||||||||||||||||||||||||||||||||||||||
| Stain Removers | 97 | 9.90% | 8.99% | 9.23% | 83 | 13.23% | |||||||||||||||||||||||||||||||||||||||||||||||||||||||||||||||||||||||||||||||||||||||||||||
| Powder Detergent | Unlock full list > | 11.95% | 6.88% | 18.93% | < 50 | 7.40% | |||||||||||||||||||||||||||||||||||||||||||||||||||||||||||||||||||||||||||||||||||||||||||||
| < 50 | 6.16% | 1.59% | 14.86% | 94 | 4.29% | ||||||||||||||||||||||||||||||||||||||||||||||||||||||||||||||||||||||||||||||||||||||||||||||
| Scourers & Sponges | 58 | 2.52% | 9.01% | 5.65% | 56 | 9.99% | |||||||||||||||||||||||||||||||||||||||||||||||||||||||||||||||||||||||||||||||||||||||||||||
| Wet & Dry Mops | < 50 | 4.65% | 7.32% | 1.68% | 72 | 6.71% | |||||||||||||||||||||||||||||||||||||||||||||||||||||||||||||||||||||||||||||||||||||||||||||
| Brushes | 99 | 3.67% | 0.60% | 12.04% | 84 | 2.48% | |||||||||||||||||||||||||||||||||||||||||||||||||||||||||||||||||||||||||||||||||||||||||||||
| Buckets & Bowls | 91 | 8.12% | 7.40% | 11.78% | 98 | 2.01% | |||||||||||||||||||||||||||||||||||||||||||||||||||||||||||||||||||||||||||||||||||||||||||||
| Dustpan & Brush Sets | Unlock full list > | 0.85% | 4.40% | 6.65% | 83 | 1.74% | |||||||||||||||||||||||||||||||||||||||||||||||||||||||||||||||||||||||||||||||||||||||||||||
| 70 | 16.64% | 4.34% | 18.18% | 90 | 6.10% | ||||||||||||||||||||||||||||||||||||||||||||||||||||||||||||||||||||||||||||||||||||||||||||||
| Bin Liners | 91 | 7.78% | 9.36% | 3.05% | 100 | 12.88% | |||||||||||||||||||||||||||||||||||||||||||||||||||||||||||||||||||||||||||||||||||||||||||||
| Foil | 61 | 8.89% | 6.97% | 9.98% | 99 | 7.76% | |||||||||||||||||||||||||||||||||||||||||||||||||||||||||||||||||||||||||||||||||||||||||||||
| Napkins | 100 | 7.98% | 5.58% | 9.94% | 94 | 5.18% | |||||||||||||||||||||||||||||||||||||||||||||||||||||||||||||||||||||||||||||||||||||||||||||
| Food Bags | 52 | 17.59% | 12.24% | 13.25% | < 50 | 9.22% | |||||||||||||||||||||||||||||||||||||||||||||||||||||||||||||||||||||||||||||||||||||||||||||
| Cling Film | Unlock full list > | 19.52% | 15.07% | 10.47% | 89 | 9.74% | |||||||||||||||||||||||||||||||||||||||||||||||||||||||||||||||||||||||||||||||||||||||||||||
| 80 | 9.96% | 1.82% | 14.35% | 100 | 1.88% | ||||||||||||||||||||||||||||||||||||||||||||||||||||||||||||||||||||||||||||||||||||||||||||||
| 58 | 8.78% | 10.00% | 5.21% | < 50 | 5.64% | ||||||||||||||||||||||||||||||||||||||||||||||||||||||||||||||||||||||||||||||||||||||||||||||
| Fresh Vegetables | 100 | 9.46% | 7.88% | 7.79% | 93 | 4.02% | |||||||||||||||||||||||||||||||||||||||||||||||||||||||||||||||||||||||||||||||||||||||||||||
| Fresh Fruits | 82 | 19.94% | 14.44% | 9.23% | 78 | 2.23% | |||||||||||||||||||||||||||||||||||||||||||||||||||||||||||||||||||||||||||||||||||||||||||||
| Fresh Salads & Herbs | < 50 | 9.82% | 9.50% | 10.05% | < 50 | 2.48% | |||||||||||||||||||||||||||||||||||||||||||||||||||||||||||||||||||||||||||||||||||||||||||||
| Fresh Mixed Fruit & Vegetables Boxes | Unlock full list > | 8.07% | 5.59% | 3.31% | < 50 | 6.72% | |||||||||||||||||||||||||||||||||||||||||||||||||||||||||||||||||||||||||||||||||||||||||||||
| 84 | 1.50% | 2.62% | 6.82% | < 50 | 3.86% | ||||||||||||||||||||||||||||||||||||||||||||||||||||||||||||||||||||||||||||||||||||||||||||||
| Dairy & Plant-Based Milk | 92 | 1.95% | 7.37% | 9.38% | 84 | 7.34% | |||||||||||||||||||||||||||||||||||||||||||||||||||||||||||||||||||||||||||||||||||||||||||||
| Dairy & Plant-Based Cheese | < 50 | 6.76% | 16.15% | 5.72% | 88 | 16.06% | |||||||||||||||||||||||||||||||||||||||||||||||||||||||||||||||||||||||||||||||||||||||||||||
| Dairy & Plant-Based Yoghurt | 95 | 9.75% | 9.96% | 7.19% | 100 | 19.44% | |||||||||||||||||||||||||||||||||||||||||||||||||||||||||||||||||||||||||||||||||||||||||||||
| Eggs & Eggs Substitutes | 84 | 13.27% | 18.65% | 4.75% | 61 | 9.91% | |||||||||||||||||||||||||||||||||||||||||||||||||||||||||||||||||||||||||||||||||||||||||||||
| Butter, Margarine & Plant-Based Alternatives | Unlock full list > | 11.49% | 19.86% | 6.08% | 67 | 4.45% | |||||||||||||||||||||||||||||||||||||||||||||||||||||||||||||||||||||||||||||||||||||||||||||
| 89 | 8.19% | 4.05% | 16.42% | 92 | 17.28% | ||||||||||||||||||||||||||||||||||||||||||||||||||||||||||||||||||||||||||||||||||||||||||||||
| Chicken | 75 | 4.02% | 2.17% | 7.96% | 79 | 8.76% | |||||||||||||||||||||||||||||||||||||||||||||||||||||||||||||||||||||||||||||||||||||||||||||
| Beef | 100 | 8.40% | 3.61% | 17.31% | 71 | 5.66% | |||||||||||||||||||||||||||||||||||||||||||||||||||||||||||||||||||||||||||||||||||||||||||||
| Sausages & Chipolatas | 100 | 8.28% | 6.21% | 3.70% | 94 | 4.54% | |||||||||||||||||||||||||||||||||||||||||||||||||||||||||||||||||||||||||||||||||||||||||||||
| Pork | 66 | 6.41% | 3.42% | 9.48% | 99 | 2.04% | |||||||||||||||||||||||||||||||||||||||||||||||||||||||||||||||||||||||||||||||||||||||||||||
| Bacon & Gammon | Unlock full list > | 2.16% | 6.98% | 7.54% | < 50 | 9.85% | |||||||||||||||||||||||||||||||||||||||||||||||||||||||||||||||||||||||||||||||||||||||||||||
| 92 | 9.97% | 8.30% | 14.53% | 94 | 13.69% | ||||||||||||||||||||||||||||||||||||||||||||||||||||||||||||||||||||||||||||||||||||||||||||||
| Fish | 98 | 3.89% | 0.23% | 8.26% | 84 | 1.46% | |||||||||||||||||||||||||||||||||||||||||||||||||||||||||||||||||||||||||||||||||||||||||||||
| Shellfish | 96 | 8.13% | 9.94% | 3.46% | 98 | 6.64% | |||||||||||||||||||||||||||||||||||||||||||||||||||||||||||||||||||||||||||||||||||||||||||||
| Smoked Salmon | 100 | 6.95% | 15.28% | 3.34% | 95 | 2.79% | |||||||||||||||||||||||||||||||||||||||||||||||||||||||||||||||||||||||||||||||||||||||||||||
| Caviars & Roes | Unlock full list > | 0.34% | 3.98% | 7.28% | 77 | 1.19% | |||||||||||||||||||||||||||||||||||||||||||||||||||||||||||||||||||||||||||||||||||||||||||||
| < 50 | 0.52% | 3.94% | 5.98% | 68 | 10.00% | ||||||||||||||||||||||||||||||||||||||||||||||||||||||||||||||||||||||||||||||||||||||||||||||
| Main Meals | 91 | 13.26% | 5.13% | 10.00% | 99 | 6.16% | |||||||||||||||||||||||||||||||||||||||||||||||||||||||||||||||||||||||||||||||||||||||||||||
| Vegetables & Side Dishes | 94 | 9.92% | 9.28% | 11.09% | 78 | 10.27% | |||||||||||||||||||||||||||||||||||||||||||||||||||||||||||||||||||||||||||||||||||||||||||||
| Soups | 100 | 7.96% | 13.31% | 9.49% | 99 | 8.43% | |||||||||||||||||||||||||||||||||||||||||||||||||||||||||||||||||||||||||||||||||||||||||||||
| Fresh Pasta & Sauces | 97 | 4.41% | 1.64% | 8.57% | 100 | 9.37% | |||||||||||||||||||||||||||||||||||||||||||||||||||||||||||||||||||||||||||||||||||||||||||||
| Sandwiches & Wraps | Unlock full list > | 9.91% | 8.95% | 10.96% | 80 | 1.83% | |||||||||||||||||||||||||||||||||||||||||||||||||||||||||||||||||||||||||||||||||||||||||||||
| 65 | 5.31% | 10.27% | 1.91% | 87 | 8.04% | ||||||||||||||||||||||||||||||||||||||||||||||||||||||||||||||||||||||||||||||||||||||||||||||
| 100 | 11.41% | 6.85% | 7.77% | 80 | 9.96% | ||||||||||||||||||||||||||||||||||||||||||||||||||||||||||||||||||||||||||||||||||||||||||||||
| Instant Coffee | 99 | 18.76% | 11.50% | 3.72% | 91 | 11.59% | |||||||||||||||||||||||||||||||||||||||||||||||||||||||||||||||||||||||||||||||||||||||||||||
| Single-Serve Capsules & Pods | < 50 | 15.88% | 1.35% | 1.84% | 88 | 14.40% | |||||||||||||||||||||||||||||||||||||||||||||||||||||||||||||||||||||||||||||||||||||||||||||
| Whole Coffee Beans | 84 | 9.89% | 2.47% | 0.62% | < 50 | 9.13% | |||||||||||||||||||||||||||||||||||||||||||||||||||||||||||||||||||||||||||||||||||||||||||||
| Ground Coffee | < 50 | 9.19% | 5.17% | 9.14% | 81 | 9.87% | |||||||||||||||||||||||||||||||||||||||||||||||||||||||||||||||||||||||||||||||||||||||||||||
| Ready to Drink Liquid Coffee | Unlock full list > | 9.72% | 3.48% | 11.88% | 95 | 9.47% | |||||||||||||||||||||||||||||||||||||||||||||||||||||||||||||||||||||||||||||||||||||||||||||
| 53 | 2.87% | 5.99% | 4.07% | < 50 | 4.17% | ||||||||||||||||||||||||||||||||||||||||||||||||||||||||||||||||||||||||||||||||||||||||||||||
| Still Water | 51 | 7.17% | 9.07% | 13.80% | < 50 | 11.11% | |||||||||||||||||||||||||||||||||||||||||||||||||||||||||||||||||||||||||||||||||||||||||||||
| Carbonated Water | 92 | 15.54% | 7.18% | 9.90% | 94 | 9.82% | |||||||||||||||||||||||||||||||||||||||||||||||||||||||||||||||||||||||||||||||||||||||||||||
| Flavoured Water | Unlock full list > | 0.44% | 5.28% | 6.59% | 95 | 9.99% | |||||||||||||||||||||||||||||||||||||||||||||||||||||||||||||||||||||||||||||||||||||||||||||
| 87 | 5.19% | 1.84% | 8.94% | 99 | 0.17% | ||||||||||||||||||||||||||||||||||||||||||||||||||||||||||||||||||||||||||||||||||||||||||||||
| Cola | < 50 | 9.67% | 7.13% | 17.58% | < 50 | 16.72% | |||||||||||||||||||||||||||||||||||||||||||||||||||||||||||||||||||||||||||||||||||||||||||||
| Soda | 76 | 9.88% | 8.85% | 10.61% | 93 | 2.09% | |||||||||||||||||||||||||||||||||||||||||||||||||||||||||||||||||||||||||||||||||||||||||||||
| Root Beer | Unlock full list > | 11.68% | 19.67% | 6.18% | 96 | 5.74% | |||||||||||||||||||||||||||||||||||||||||||||||||||||||||||||||||||||||||||||||||||||||||||||
| < 50 | 5.82% | 9.34% | 3.63% | 80 | 14.20% | ||||||||||||||||||||||||||||||||||||||||||||||||||||||||||||||||||||||||||||||||||||||||||||||
| Fruit & Herbal Tea | < 50 | 9.07% | 7.34% | 6.18% | 69 | 7.42% | |||||||||||||||||||||||||||||||||||||||||||||||||||||||||||||||||||||||||||||||||||||||||||||
| Black | < 50 | 10.64% | 5.66% | 19.70% | 95 | 6.81% | |||||||||||||||||||||||||||||||||||||||||||||||||||||||||||||||||||||||||||||||||||||||||||||
| Iced Tea | 65 | 6.14% | 8.37% | 0.47% | 56 | 9.30% | |||||||||||||||||||||||||||||||||||||||||||||||||||||||||||||||||||||||||||||||||||||||||||||
| Green | 99 | 7.94% | 3.19% | 16.81% | 83 | 5.39% | |||||||||||||||||||||||||||||||||||||||||||||||||||||||||||||||||||||||||||||||||||||||||||||
| Chai | Unlock full list > | 14.58% | 2.40% | 8.49% | 85 | 15.71% | |||||||||||||||||||||||||||||||||||||||||||||||||||||||||||||||||||||||||||||||||||||||||||||
| 77 | 8.85% | 5.87% | 7.91% | < 50 | 9.97% | ||||||||||||||||||||||||||||||||||||||||||||||||||||||||||||||||||||||||||||||||||||||||||||||
| Syrups | 86 | 10.50% | 1.83% | 8.70% | 100 | 1.90% | |||||||||||||||||||||||||||||||||||||||||||||||||||||||||||||||||||||||||||||||||||||||||||||
| Concentrates | Unlock full list > | 9.98% | 0.03% | 16.90% | < 50 | 8.09% | |||||||||||||||||||||||||||||||||||||||||||||||||||||||||||||||||||||||||||||||||||||||||||||
| 98 | 0.90% | 4.44% | 6.58% | 86 | 1.80% | ||||||||||||||||||||||||||||||||||||||||||||||||||||||||||||||||||||||||||||||||||||||||||||||
| 75 | 5.29% | 7.67% | 1.01% | 93 | 7.49% | ||||||||||||||||||||||||||||||||||||||||||||||||||||||||||||||||||||||||||||||||||||||||||||||
| Whisky | < 50 | 6.64% | 3.72% | 9.56% | < 50 | 2.43% | |||||||||||||||||||||||||||||||||||||||||||||||||||||||||||||||||||||||||||||||||||||||||||||
| Liqueurs | 76 | 0.55% | 3.24% | 8.37% | < 50 | 0.27% | |||||||||||||||||||||||||||||||||||||||||||||||||||||||||||||||||||||||||||||||||||||||||||||
| Vodka | 92 | 1.38% | 2.56% | 9.36% | 100 | 0.52% | |||||||||||||||||||||||||||||||||||||||||||||||||||||||||||||||||||||||||||||||||||||||||||||
| Gin | 66 | 1.28% | 5.81% | 4.93% | 88 | 5.95% | |||||||||||||||||||||||||||||||||||||||||||||||||||||||||||||||||||||||||||||||||||||||||||||
| Rum | Unlock full list > | 3.63% | 8.42% | 3.21% | 91 | 7.28% | |||||||||||||||||||||||||||||||||||||||||||||||||||||||||||||||||||||||||||||||||||||||||||||
| 100 | 10.70% | 5.71% | 19.76% | 69 | 6.84% | ||||||||||||||||||||||||||||||||||||||||||||||||||||||||||||||||||||||||||||||||||||||||||||||
| Lager | 100 | 2.95% | 0.91% | 7.72% | 77 | 2.50% | |||||||||||||||||||||||||||||||||||||||||||||||||||||||||||||||||||||||||||||||||||||||||||||
| Ale | Unlock full list > | 7.99% | 3.24% | 16.87% | < 50 | 5.42% | |||||||||||||||||||||||||||||||||||||||||||||||||||||||||||||||||||||||||||||||||||||||||||||
| 99 | 0.80% | 4.35% | 6.71% | 64 | 1.68% | ||||||||||||||||||||||||||||||||||||||||||||||||||||||||||||||||||||||||||||||||||||||||||||||
| Red Wine | 95 | 9.78% | 9.57% | 9.68% | 100 | 2.74% | |||||||||||||||||||||||||||||||||||||||||||||||||||||||||||||||||||||||||||||||||||||||||||||
| White Wine | 76 | 10.73% | 19.34% | 9.94% | 52 | 5.22% | |||||||||||||||||||||||||||||||||||||||||||||||||||||||||||||||||||||||||||||||||||||||||||||
| Rosé Wine | Unlock full list > | 12.13% | 17.68% | 9.98% | 66 | 6.71% | |||||||||||||||||||||||||||||||||||||||||||||||||||||||||||||||||||||||||||||||||||||||||||||
| 68 | 7.48% | 4.87% | 9.83% | 100 | 4.06% | ||||||||||||||||||||||||||||||||||||||||||||||||||||||||||||||||||||||||||||||||||||||||||||||
| Champagne | 100 | 6.20% | 3.14% | 9.39% | 90 | 1.69% | |||||||||||||||||||||||||||||||||||||||||||||||||||||||||||||||||||||||||||||||||||||||||||||
| Prosecco | 58 | 3.43% | 6.42% | 3.33% | < 50 | 4.92% | |||||||||||||||||||||||||||||||||||||||||||||||||||||||||||||||||||||||||||||||||||||||||||||
| Sparkling Wine | 100 | 2.86% | 1.01% | 7.66% | 96 | 2.58% | |||||||||||||||||||||||||||||||||||||||||||||||||||||||||||||||||||||||||||||||||||||||||||||
| Cava | < 50 | 0.66% | 3.16% | 8.50% | < 50 | 0.17% | |||||||||||||||||||||||||||||||||||||||||||||||||||||||||||||||||||||||||||||||||||||||||||||
| Cremant | Unlock full list > | 4.62% | 1.13% | 8.65% | 97 | 0.58% | |||||||||||||||||||||||||||||||||||||||||||||||||||||||||||||||||||||||||||||||||||||||||||||
| Cider | Unlock full list > | 2.95% | 1.22% | 11.22% | 84 | 1.90% | |||||||||||||||||||||||||||||||||||||||||||||||||||||||||||||||||||||||||||||||||||||||||||||
| 61 | 12.98% | 5.94% | 9.85% | < 50 | 4.03% | ||||||||||||||||||||||||||||||||||||||||||||||||||||||||||||||||||||||||||||||||||||||||||||||
| 54 | 10.00% | 0.31% | 3.08% | 91 | 8.25% | ||||||||||||||||||||||||||||||||||||||||||||||||||||||||||||||||||||||||||||||||||||||||||||||
| Chocolate Candy | 77 | 2.88% | 6.00% | 4.06% | 51 | 4.18% | |||||||||||||||||||||||||||||||||||||||||||||||||||||||||||||||||||||||||||||||||||||||||||||
| Snack Foods | 54 | 5.70% | 8.07% | 0.18% | < 50 | 8.49% | |||||||||||||||||||||||||||||||||||||||||||||||||||||||||||||||||||||||||||||||||||||||||||||
| Confectionery | 96 | 3.97% | 12.72% | 2.93% | 64 | 12.81% | |||||||||||||||||||||||||||||||||||||||||||||||||||||||||||||||||||||||||||||||||||||||||||||
Track category trends month over month See which categories are growing based on sales, revenue, and views. | |||||||||||||||||||||||||||||||||||||||||||||||||||||||||||||||||||||||||||||||||||||||||||||||||||
Top Products on the Grocery Category
Discover the most-viewed products in the Grocery category. This section highlights the top-performing products based on product views, revenue, and units sold, giving a snapshot of what’s driving consumer interest and purchases.
| Product | Category | Brand | Product Views | Change | Revenue | Change | Units Sold | Change | |||||||||||||||||||||||||||||||||||||||||||||||||||||||||||||||||||||||||||||||||||||||||||
|---|---|---|---|---|---|---|---|---|---|---|---|---|---|---|---|---|---|---|---|---|---|---|---|---|---|---|---|---|---|---|---|---|---|---|---|---|---|---|---|---|---|---|---|---|---|---|---|---|---|---|---|---|---|---|---|---|---|---|---|---|---|---|---|---|---|---|---|---|---|---|---|---|---|---|---|---|---|---|---|---|---|---|---|---|---|---|---|---|---|---|---|---|---|---|---|---|---|---|---|
 | ...> Still Water | Amazon | 299.6K | 56.08% | 8.02% | 5.32% | 96 | 9.60% | |||||||||||||||||||||||||||||||||||||||||||||||||||||||||||||||||||||||||||||||||||||||||||
 | ...> Cola | Pepsi | 275.6K | 45.06% | 9.99% | 7.25% | 55 | 8.54% | |||||||||||||||||||||||||||||||||||||||||||||||||||||||||||||||||||||||||||||||||||||||||||
 | ...> Cola | Diet Coke | 195.5K | 250.66% | 4.90% | 3.86% | 81 | 9.44% | |||||||||||||||||||||||||||||||||||||||||||||||||||||||||||||||||||||||||||||||||||||||||||
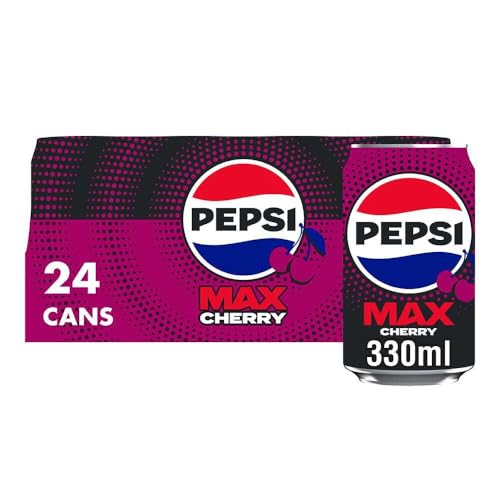 | ...> Cola | Pepsi | 168.6K | 176.91% | 0.68% | 6.64% | 92 | 14.15% | |||||||||||||||||||||||||||||||||||||||||||||||||||||||||||||||||||||||||||||||||||||||||||
 | ...> Kitchen Roll | Amazon | 160.7K | 30.47% | 9.07% | 9.70% | 54 | 3.65% | |||||||||||||||||||||||||||||||||||||||||||||||||||||||||||||||||||||||||||||||||||||||||||
| ...> Still Water | Amazon | 299.6K | 56.08% | 8.02% | 5.32% | 96 | 9.60% | |||||||||||||||||||||||||||||||||||||||||||||||||||||||||||||||||||||||||||||||||||||||||||
| ...> Cola | Pepsi | 275.6K | 45.06% | 9.99% | 7.25% | 55 | 8.54% | |||||||||||||||||||||||||||||||||||||||||||||||||||||||||||||||||||||||||||||||||||||||||||
| ...> Cola | Diet Coke | 195.5K | 250.66% | 4.90% | 3.86% | 81 | 9.44% | |||||||||||||||||||||||||||||||||||||||||||||||||||||||||||||||||||||||||||||||||||||||||||
| ...> Cola | Pepsi | 168.6K | 176.91% | 0.68% | 6.64% | 92 | 14.15% | |||||||||||||||||||||||||||||||||||||||||||||||||||||||||||||||||||||||||||||||||||||||||||
| ...> Kitchen Roll | Amazon | 160.7K | 30.47% | 9.07% | 9.70% | 54 | 3.65% | |||||||||||||||||||||||||||||||||||||||||||||||||||||||||||||||||||||||||||||||||||||||||||
What’s selling—and why Explore the top-performing products on Amazon based on product views, sales, and revenue.Spot trends, category winners, and emerging bestsellers at a glance. | |||||||||||||||||||||||||||||||||||||||||||||||||||||||||||||||||||||||||||||||||||||||||||||||||||