






The Top 100 Most Visited Websites in the USA (August 2026)
by Shai Belinsky10 Min.
Sep 29, 2026

Running a business is hard. Understanding how your business is performing compared to its competitors is even harder.
Your website directly reflects your company’s health and can help you determine where you stand in your market. Who is your primary audience? How are they getting to your site? Which pages are they visiting the most? Is that new PPC campaign working?
Analyzing your website traffic is the key to answering all these questions and is crucial for success in the digital world. With the right data, you can understand what users are up to, monitor market changes, size up the competition, and see how well your efforts convert.
This comprehensive guide will walk you through the ins and outs of checking your website traffic, equipping you with the tools and insight you need to navigate the ever-changing digital world and make data-driven business decisions.
Summarize with ChatGPT | Google AI | Perplexity | Grok
Website traffic is the number of visitors a website receives over a given period and is a crucial metric for assessing its popularity. There are a variety of ways that you can analyze website traffic; however, some of the most common metrics include monthly visitors, user engagement, marketing channel performance, and new vs. returning audience split. Don’t worry, we’ll dive deeper into each of these in a bit!
“Website traffic is the number of visitors a website receives over a given period and is a crucial metric for assessing its popularity.”
You can check your website traffic for free, or open Similarweb and go to Website Analysis > enter your URL > Website performance. Here, you’ll get a breakdown of traffic and engagement, marketing channels, audience demographics, search trends, and more. You can compare your website to your main competitors or similar sites.
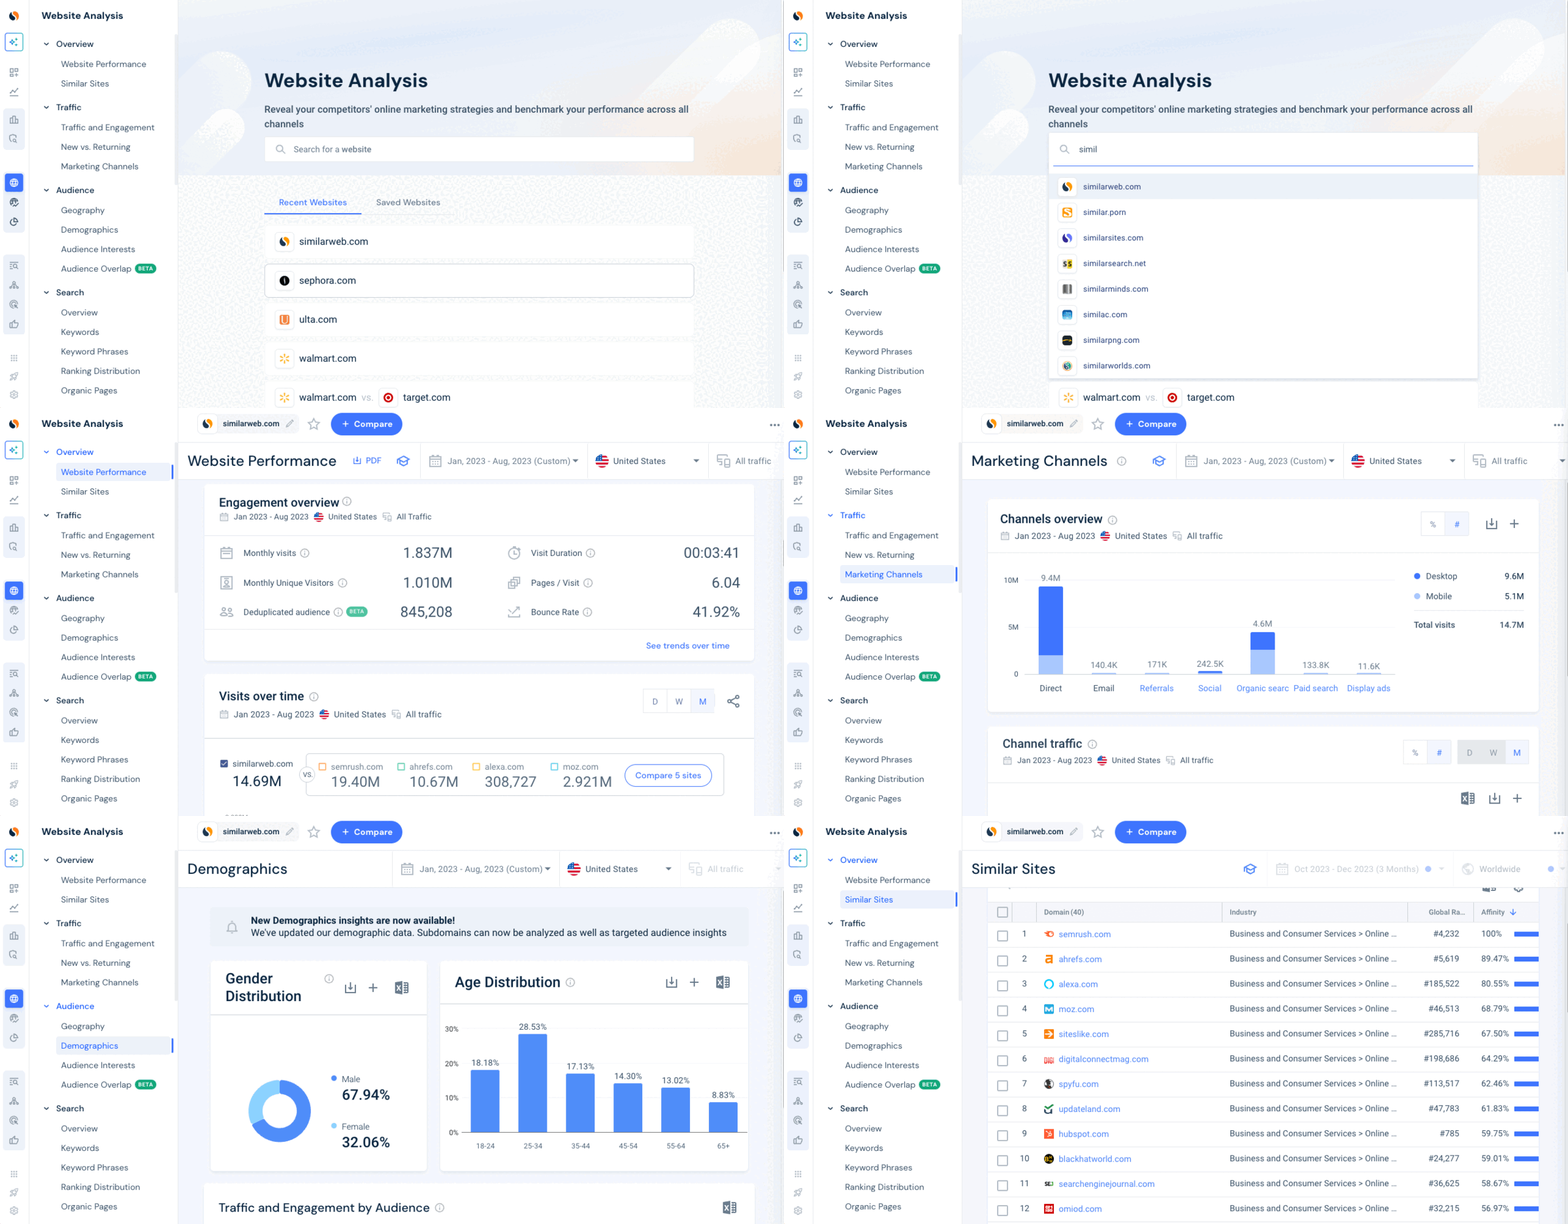
Analyzing the traffic of a website provides valuable insight into user behavior. Understanding how and why your audience visits your site helps you enhance user experience and drive new traffic. It can also contextualize your performance compared to competitors and pinpoint areas to improve to be more effective.
Various metrics are used when checking website traffic, depending on your goals, objectives, or even the team measuring the data. The ten below provide a general overview of your website performance:
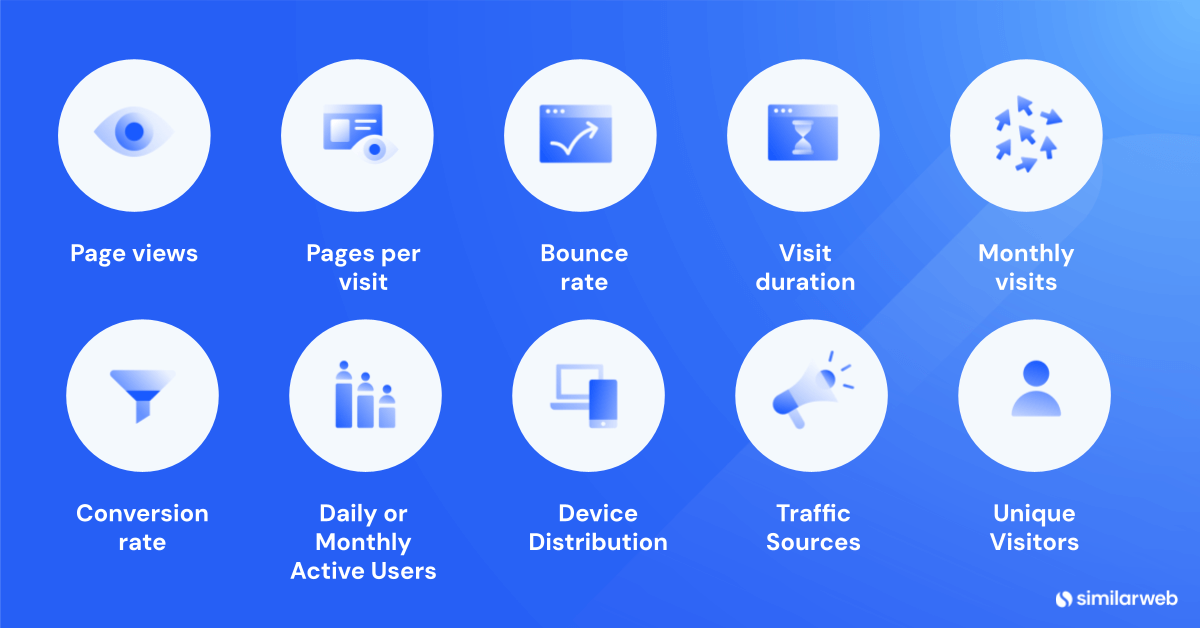
Your goal is to use a combination of these metrics to analyze and understand your website traffic, performance, and user behavior. Set KPIs that you’d like to meet quarterly or yearly and track any major fluctuations over time. This could be a sign to reevaluate your goals or adjust your digital strategy.
Similarweb is a digital intelligence platform that enables users to track, measure, and analyze all components of their website performance – from traffic and engagement metrics to audience demographics, conversion analysis, marketing channel performance, and more. Let’s examine how our tools can help you check web traffic and analyze your online presence in real-time.
Any KPI that reveals how visitors interact with your website, including session duration, pages per visit, bounce rate, or click-through rate (CTR), falls under user engagement metrics.
These metrics help you measure your engagement rate or how much your audience is actively engaged with content on your site. Monitoring your engagement rate helps you determine customer satisfaction, identify potential churns, analyze the efficacy of a campaign, and spot areas for improvement.
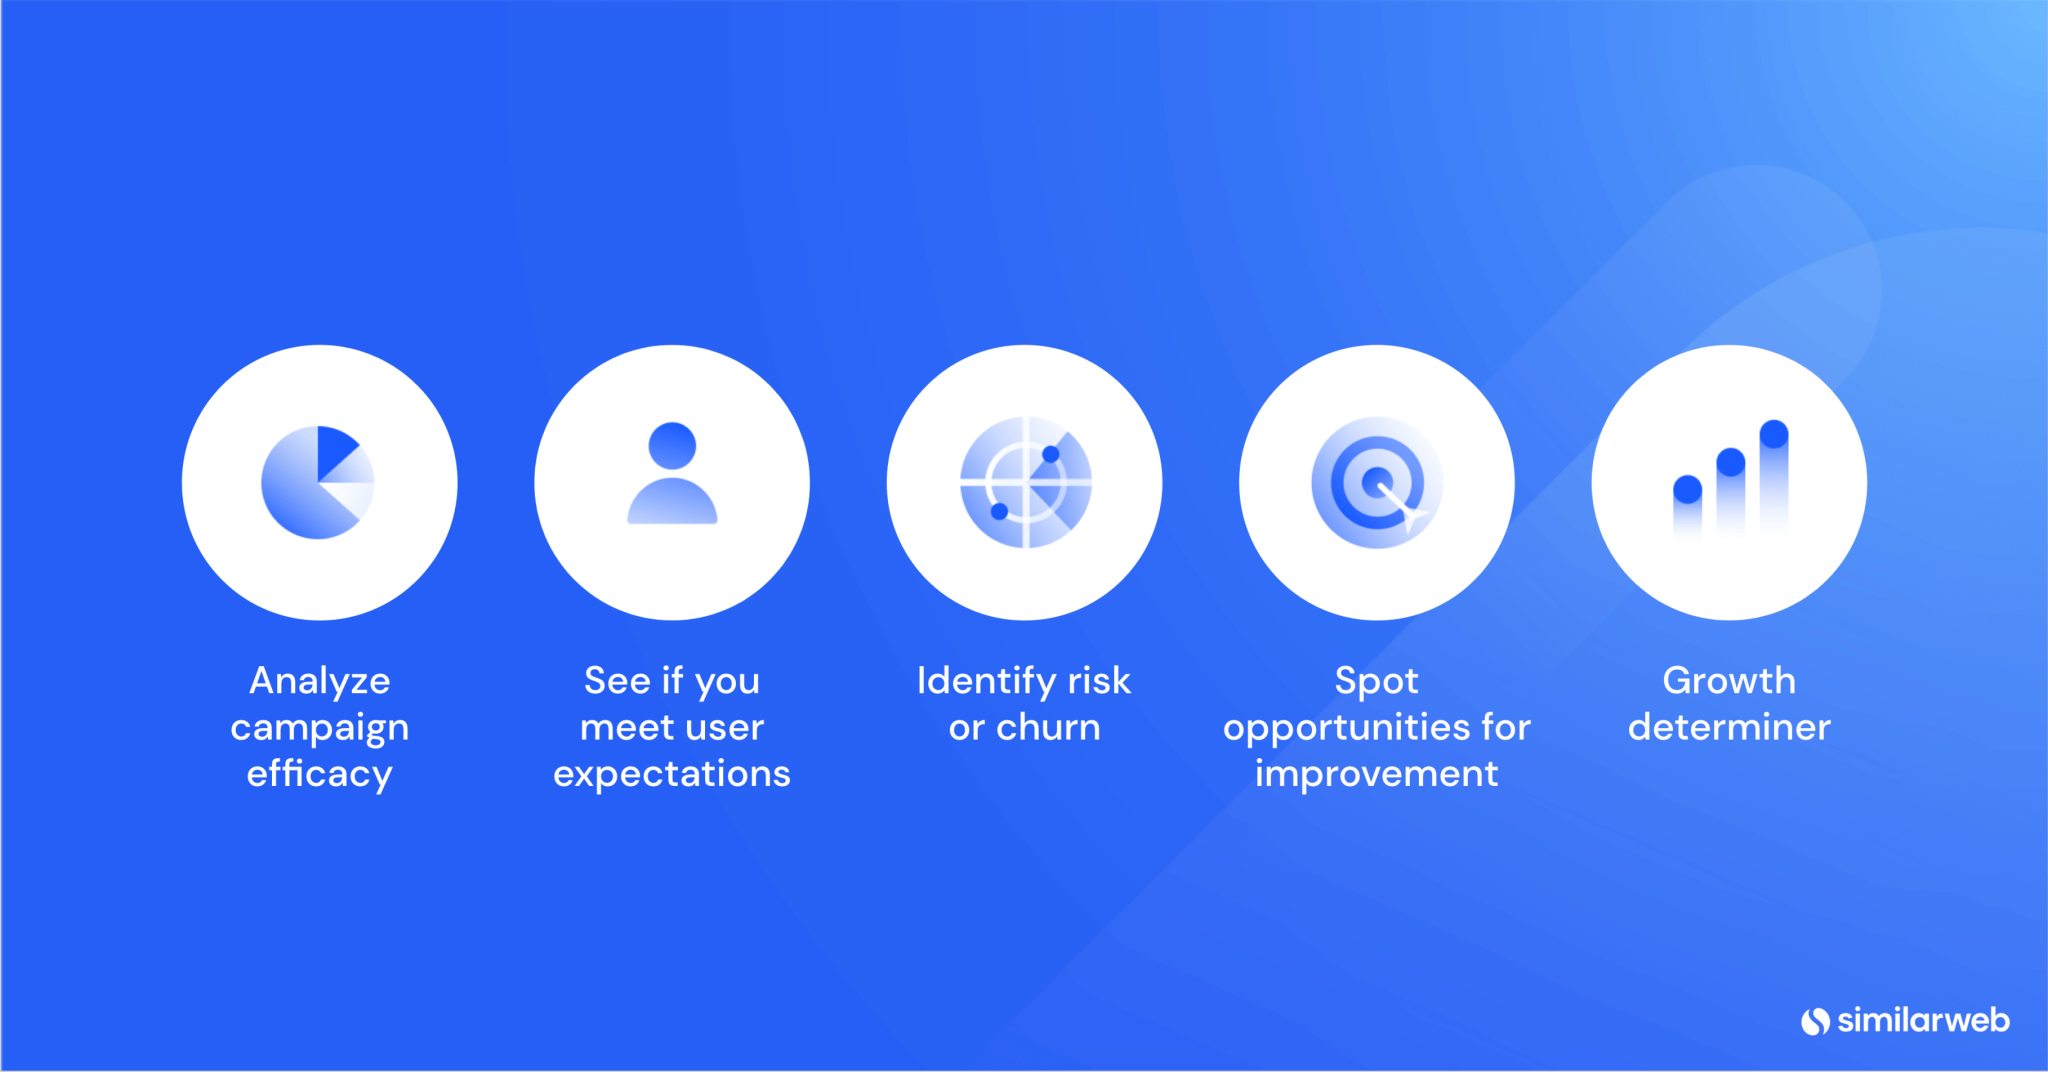
Here are some key engagement metrics to use when checking your website traffic with Similarweb:
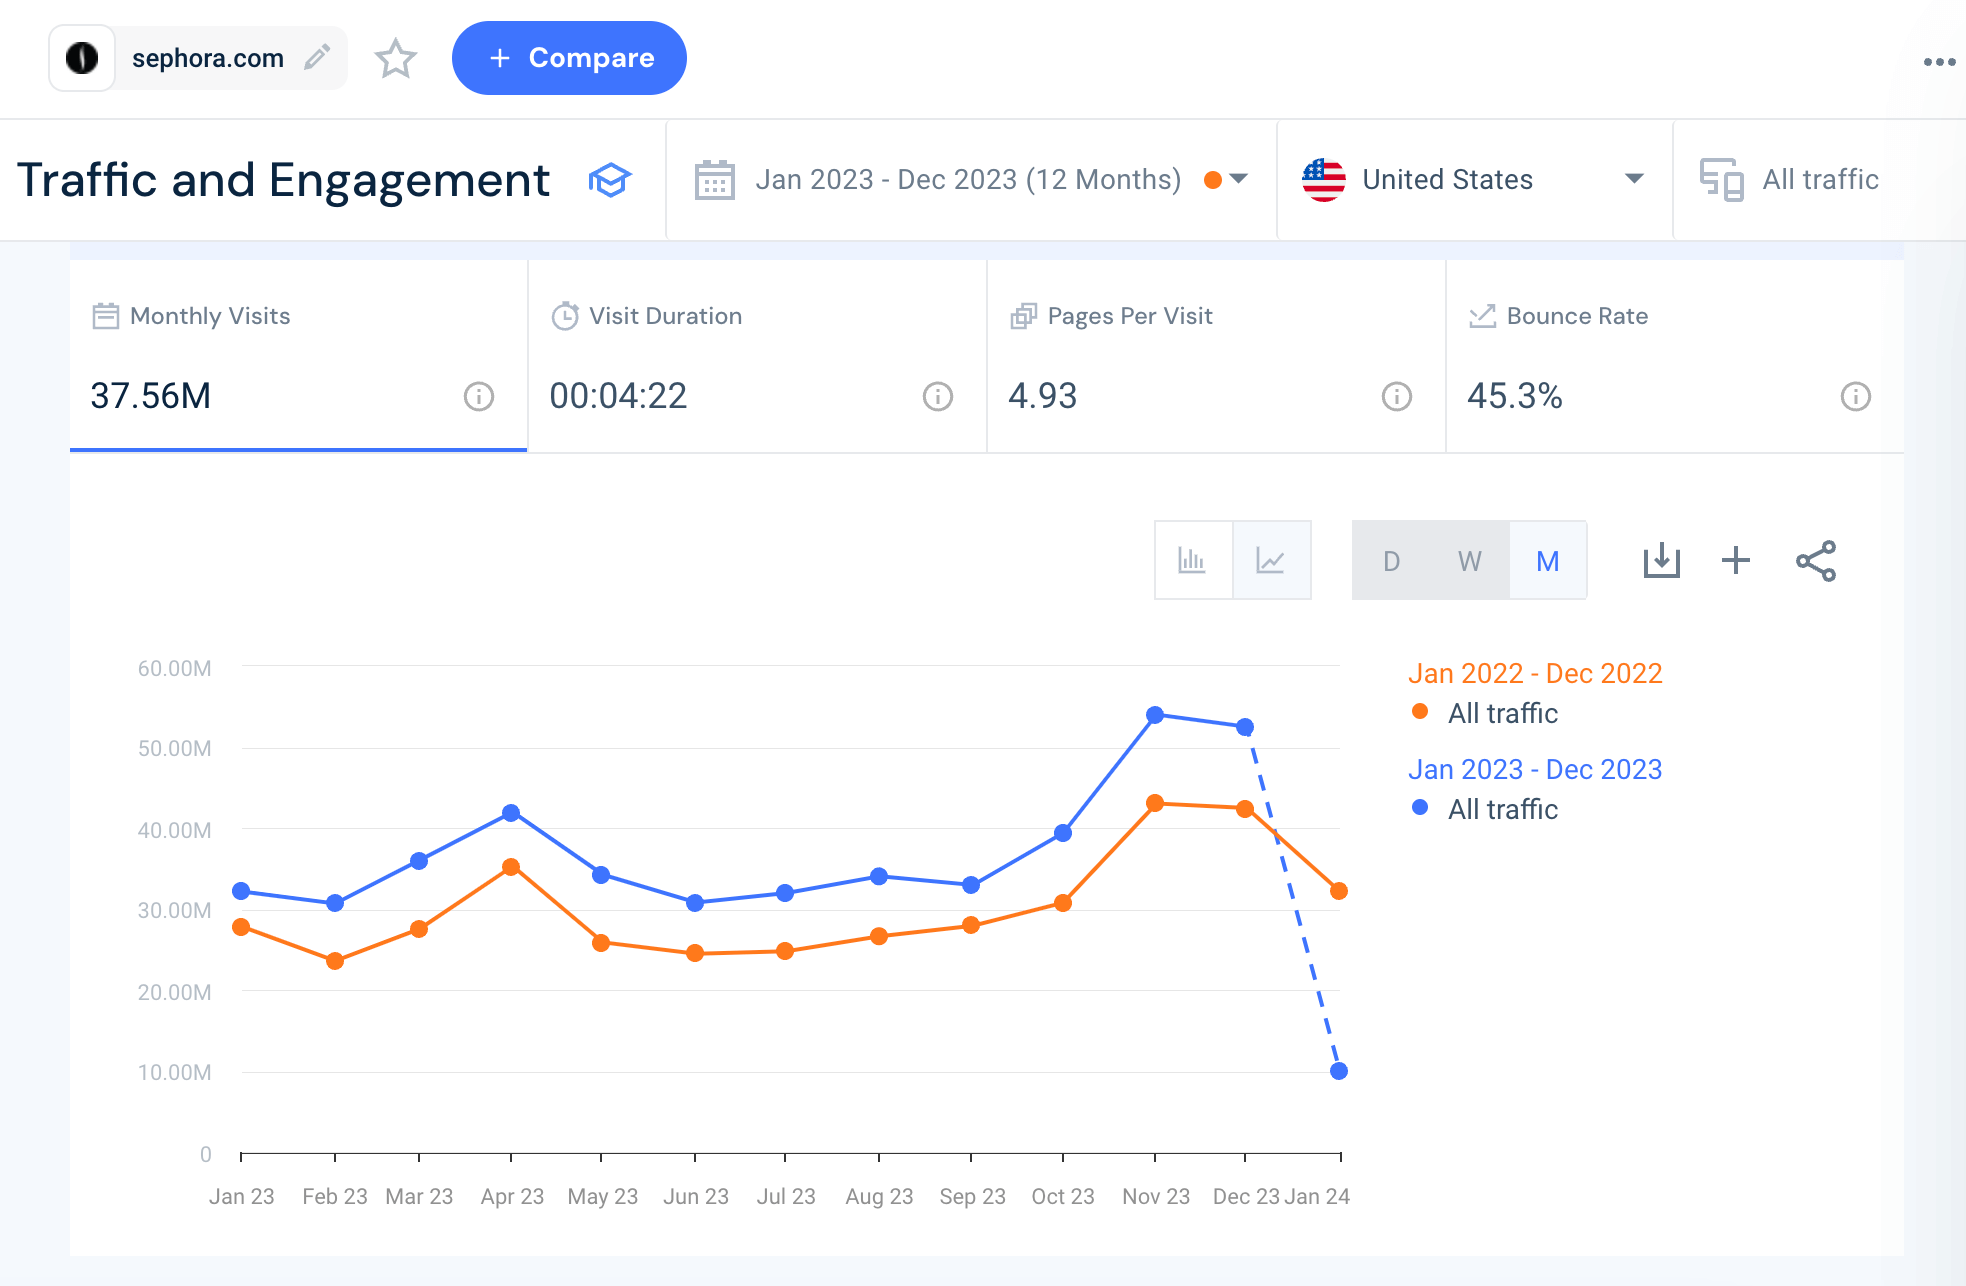
On average, how much traffic does your website receive each month? This metric is the foundation of your website traffic analysis and can help you answer general questions about your performance vs. your competitors and the industry. Keep in mind that regular traffic fluctuations are normal and are to be expected during certain periods, such as the holiday season. You can anticipate and prepare accordingly if your monthly visits follow the same pattern each year.
Sephora.com, for example, shows an increase in monthly traffic year-over-year (YoY), growing 25% from 360.2M in 2022 to 450.7M in 2023. The average monthly traffic to sephora.com in 2023 was approximately 37.6M visits. The traffic peaked in November with 54M visits. This surge was primarily driven by direct traffic, which increased in November, and organic search traffic, which rose over the same period. These traffic jumps can likely be attributed to holiday shopping.
Visit duration, page views, and average pages per visit all give you an idea of how a user interacts with your website. These metrics answer how long the average user spends browsing, which pages they’re most likely to visit, and how many.
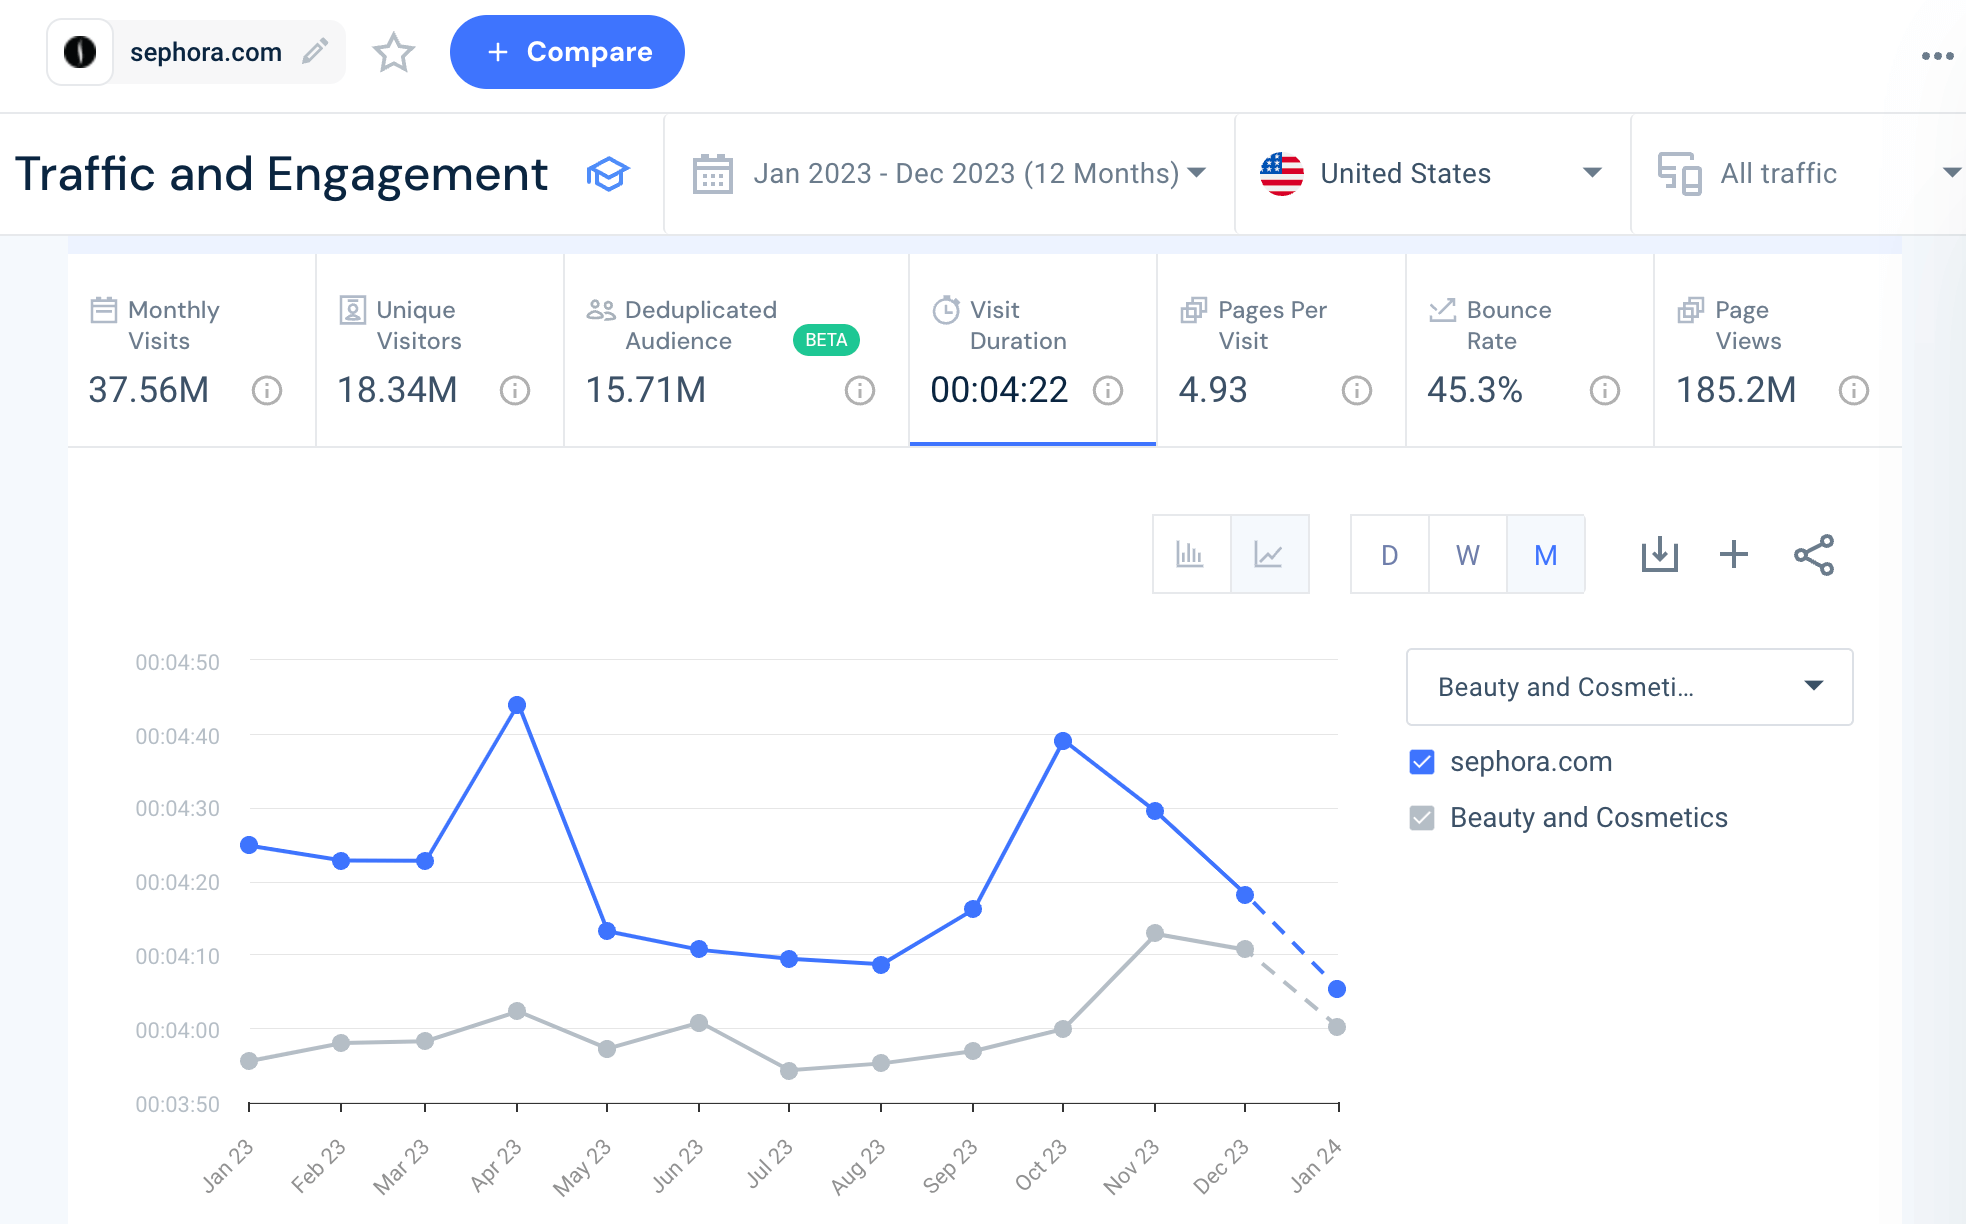
The average visit duration to sephora.com in 2023 was 4 minutes and 22 seconds, significantly higher than the Beauty industry benchmark. Most visitors to Sephora view 4.9 pages, which is higher than the industry average and peaks at 5.5 pages per visit in November, around the holidays. Monthly page views are, on average, 185.2M. These metrics point to a good user experience – customers frequently visit multiple pages and browse through the website before ending a session.
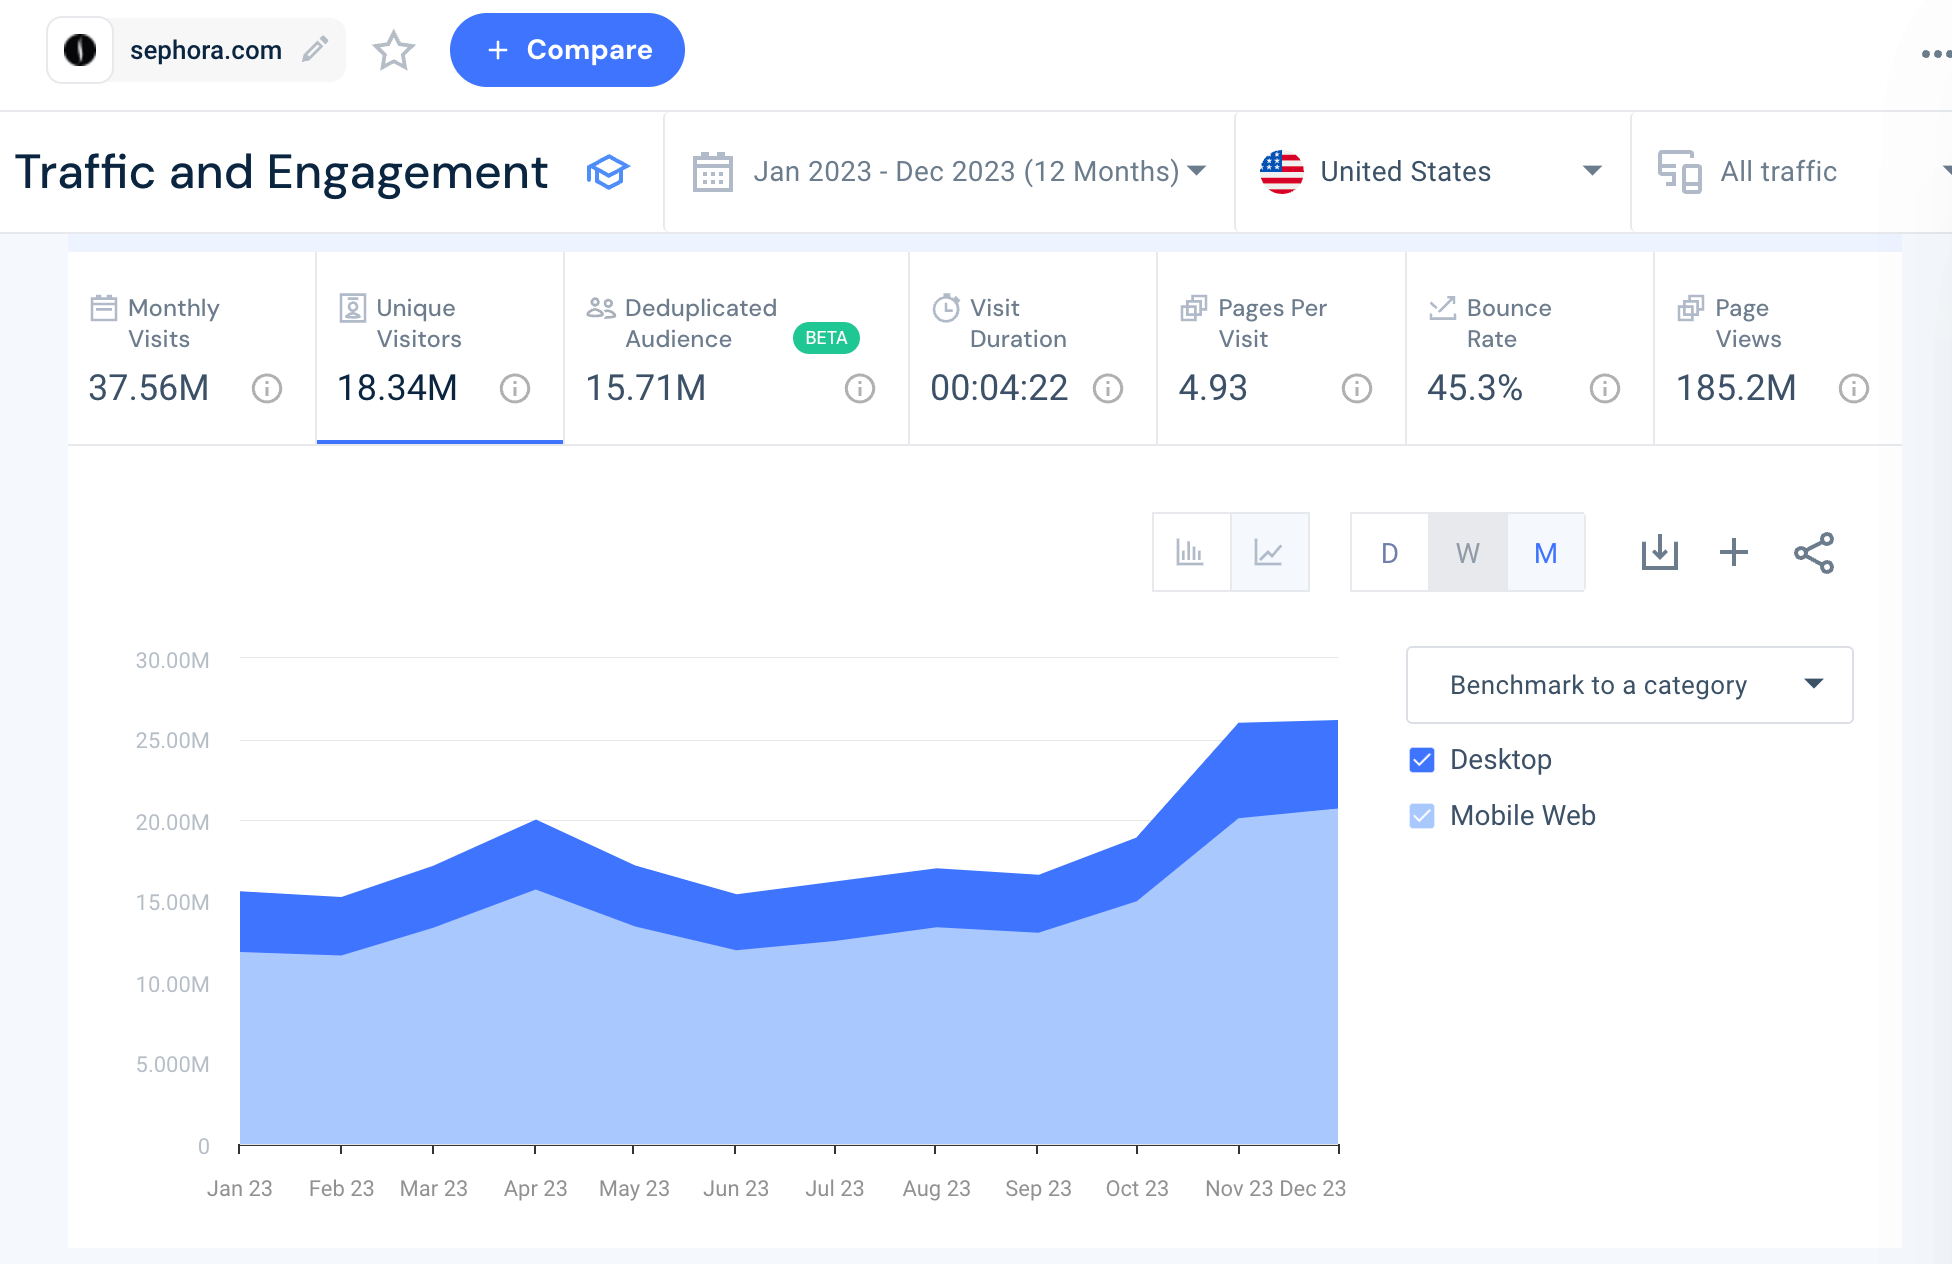
Unique visitors are not duplicated across devices — visitors within the specified period are counted only once.
There were an average of 18.3M unique visitors to sephora.com in the US in 2023 – mostly from mobile web, highlighting the importance of a functional and easy-to-use mobile design.
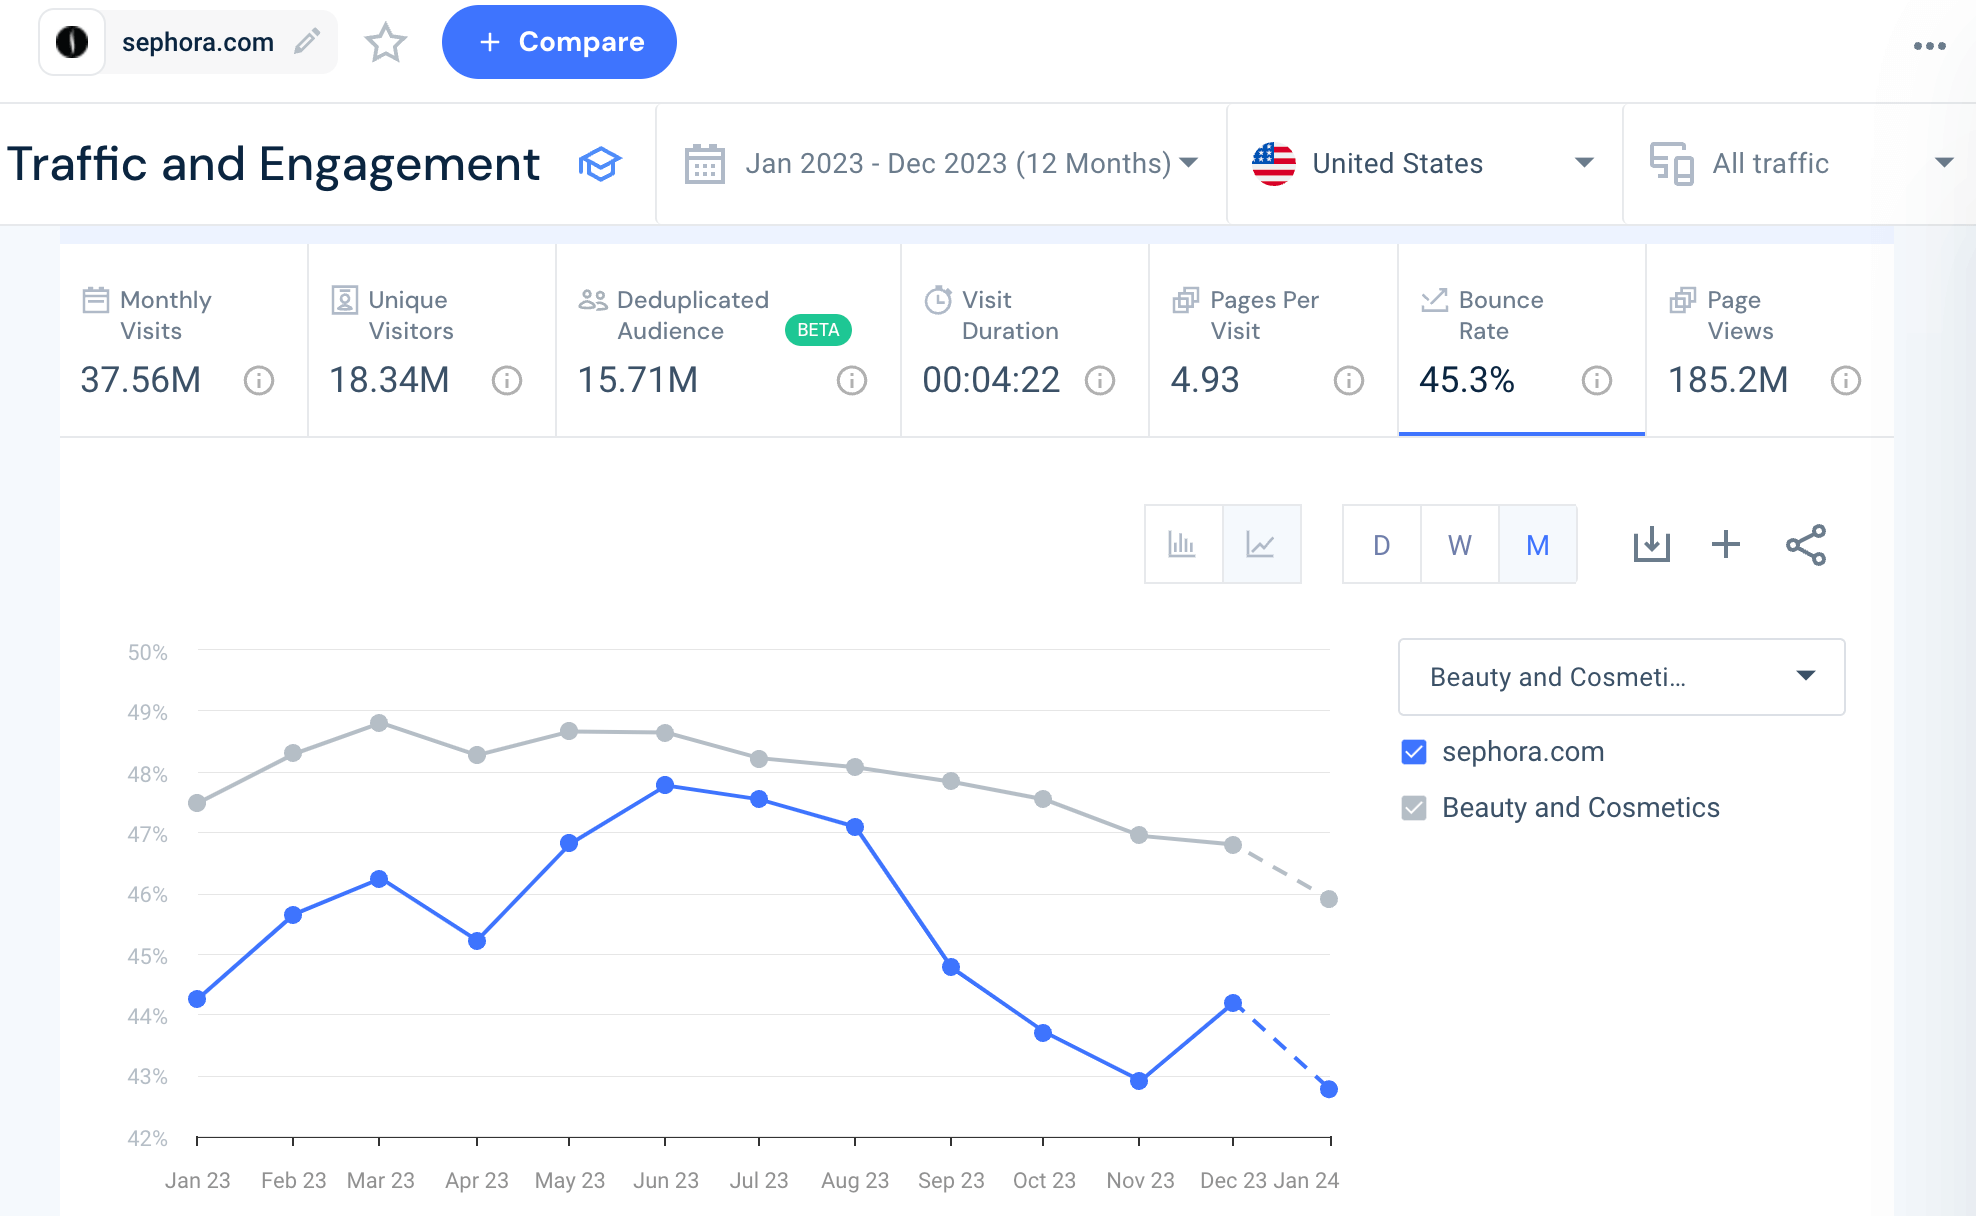
Bounce rate counts all visitors who leave your website from the same page they entered without taking action. A high bounce rate indicates false visitor expectations, a technical error, or a leaking funnel. Sephora has a 45% bounce rate, which may seem high but is lower than the Beauty & Cosmetic industry average. We see that the lowest bounce rates correlate with periods of high traffic volume, like in November and December.
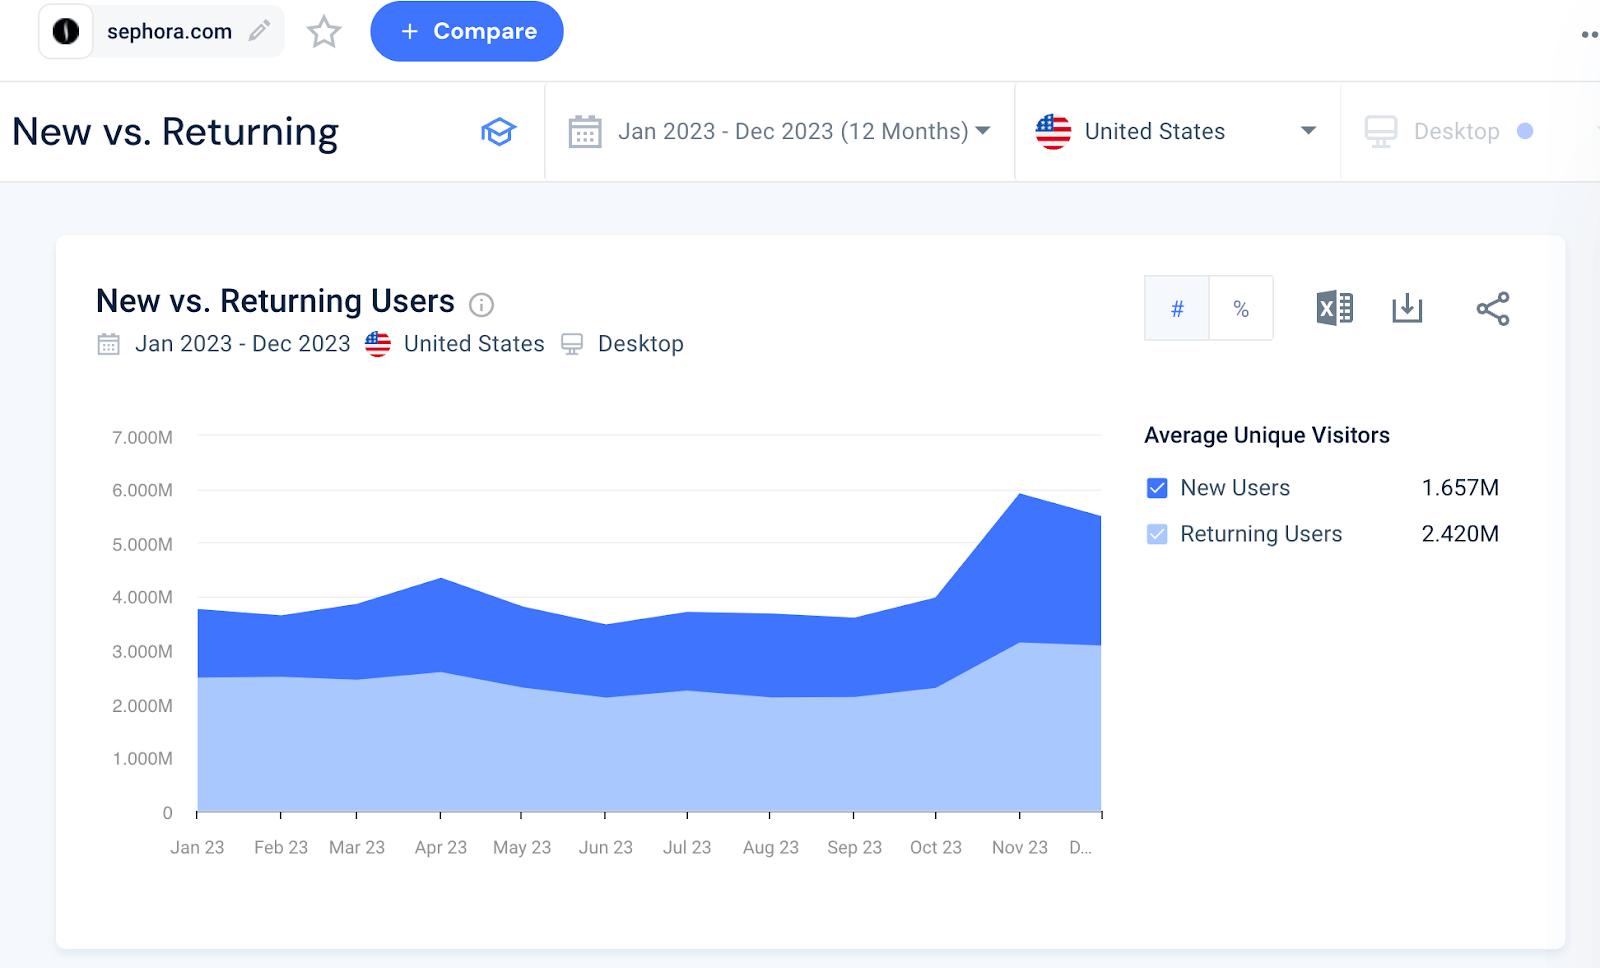
Analyzing the ratio of new vs. returning users showcases the split between acquiring traffic and/or retaining current customers. It can gauge the “stickiness” of your website. A sticky website means customers come back rather than seeking alternatives. Looking at sephora.com, there are more returning users than new ones, 59% vs. 41%. Use these numbers to evaluate if you are aligned with your current marketing goals: are you focusing on acquisition or retention?
Examining device distribution gives insight into how your audiences access your website. This metric is crucial for optimization, as user experience between desktop and mobile web varies greatly.
Like most industries today, sephora.com is experiencing a significant shift to mobile usage. Users are nearly three times more likely to access the website from their phones than from desktops. Mobile web visits to sephora.com are up almost 7% YoY.
Audience analysis tools help you define your users’ demographic and behavioral characteristics, including age, gender, location, interests, and more. It’s an important part of checking website traffic; as you gather information about where your audience spends time online, you can better engage them and explore new growth opportunities.
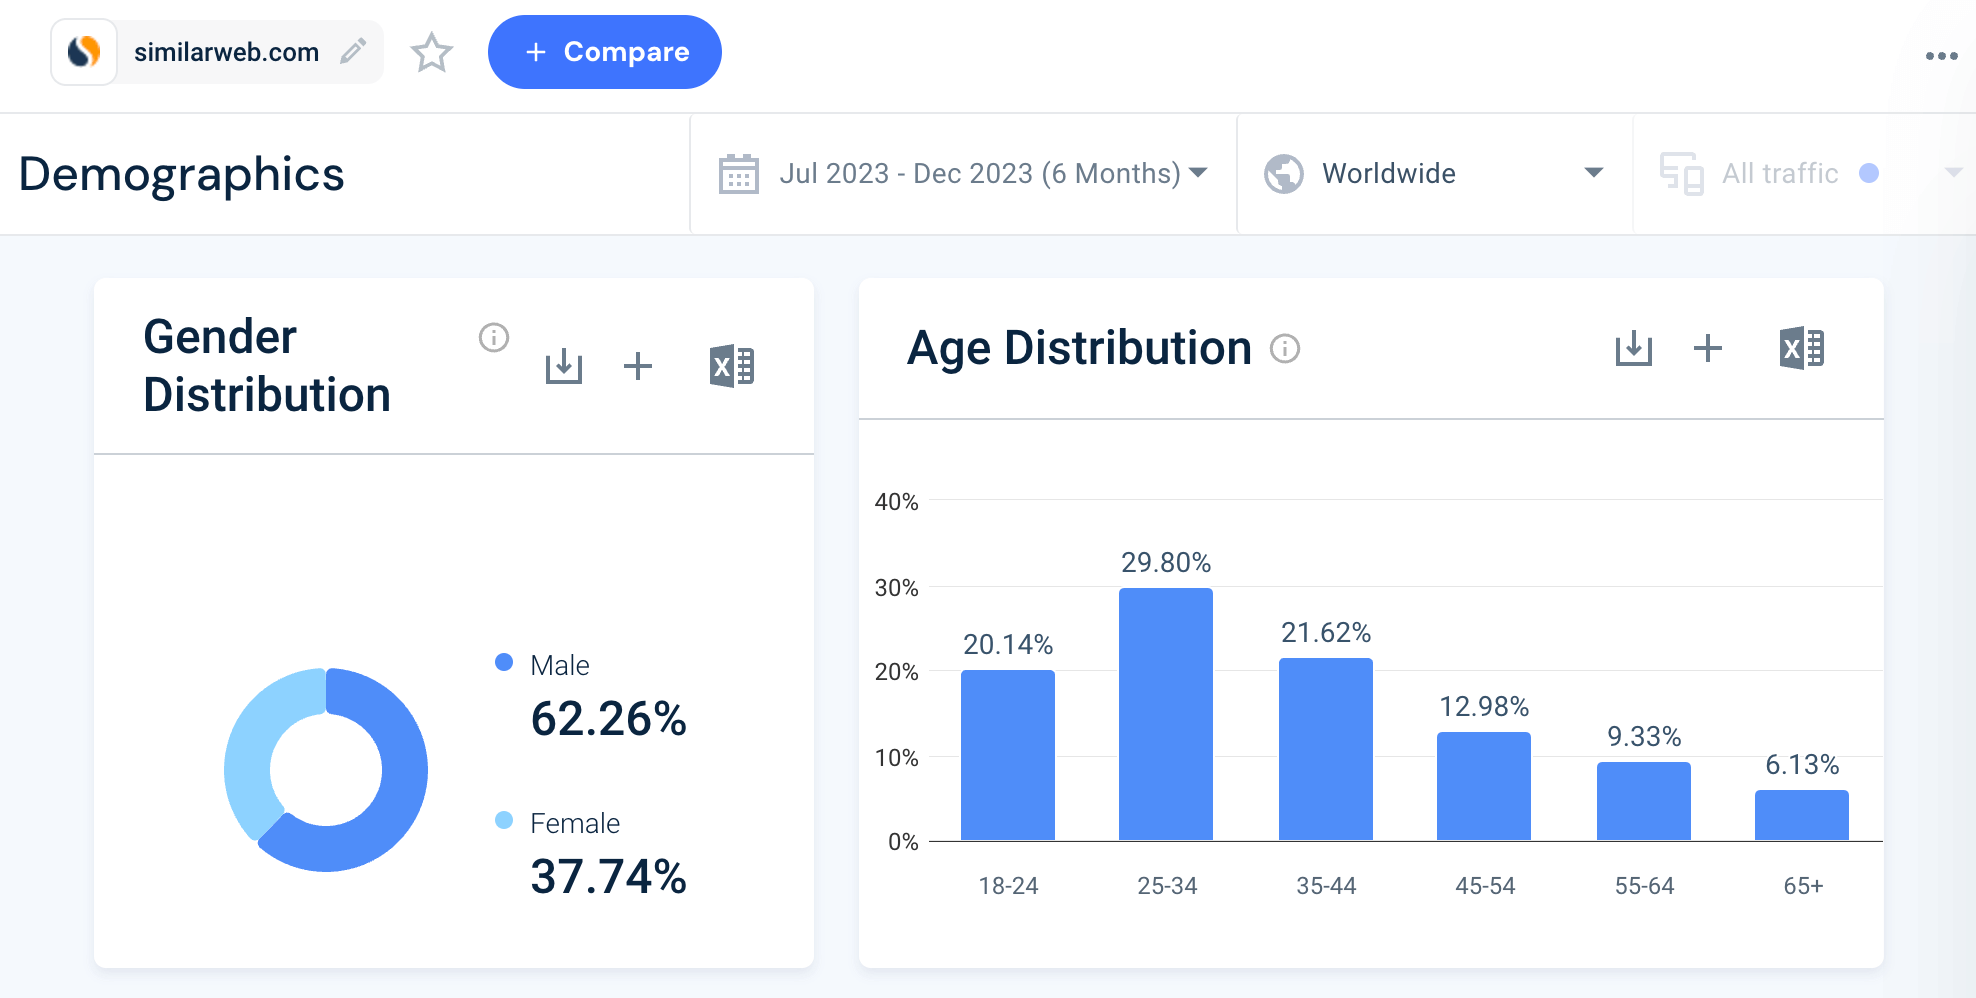
Audience demographics pinpoint exactly who your customers are – and knowing their challenges is crucial when developing marketing, advertising, and sales strategies. The demographics tab of Website Analysis gives a general overview of the gender and age distribution of any website in any given country.
If we look at similarweb.com traffic stats, the data shows that globally, gender demographics are skewed more male than female (62% vs. 38%). If we look at just the US, the difference is even greater – 70% male compared to 30% female. Worldwide, users between the ages of 25 and 34 are the most active, with 30% of the traffic share, followed by 35-44 year olds (22%) and 18-24 year olds (20%).
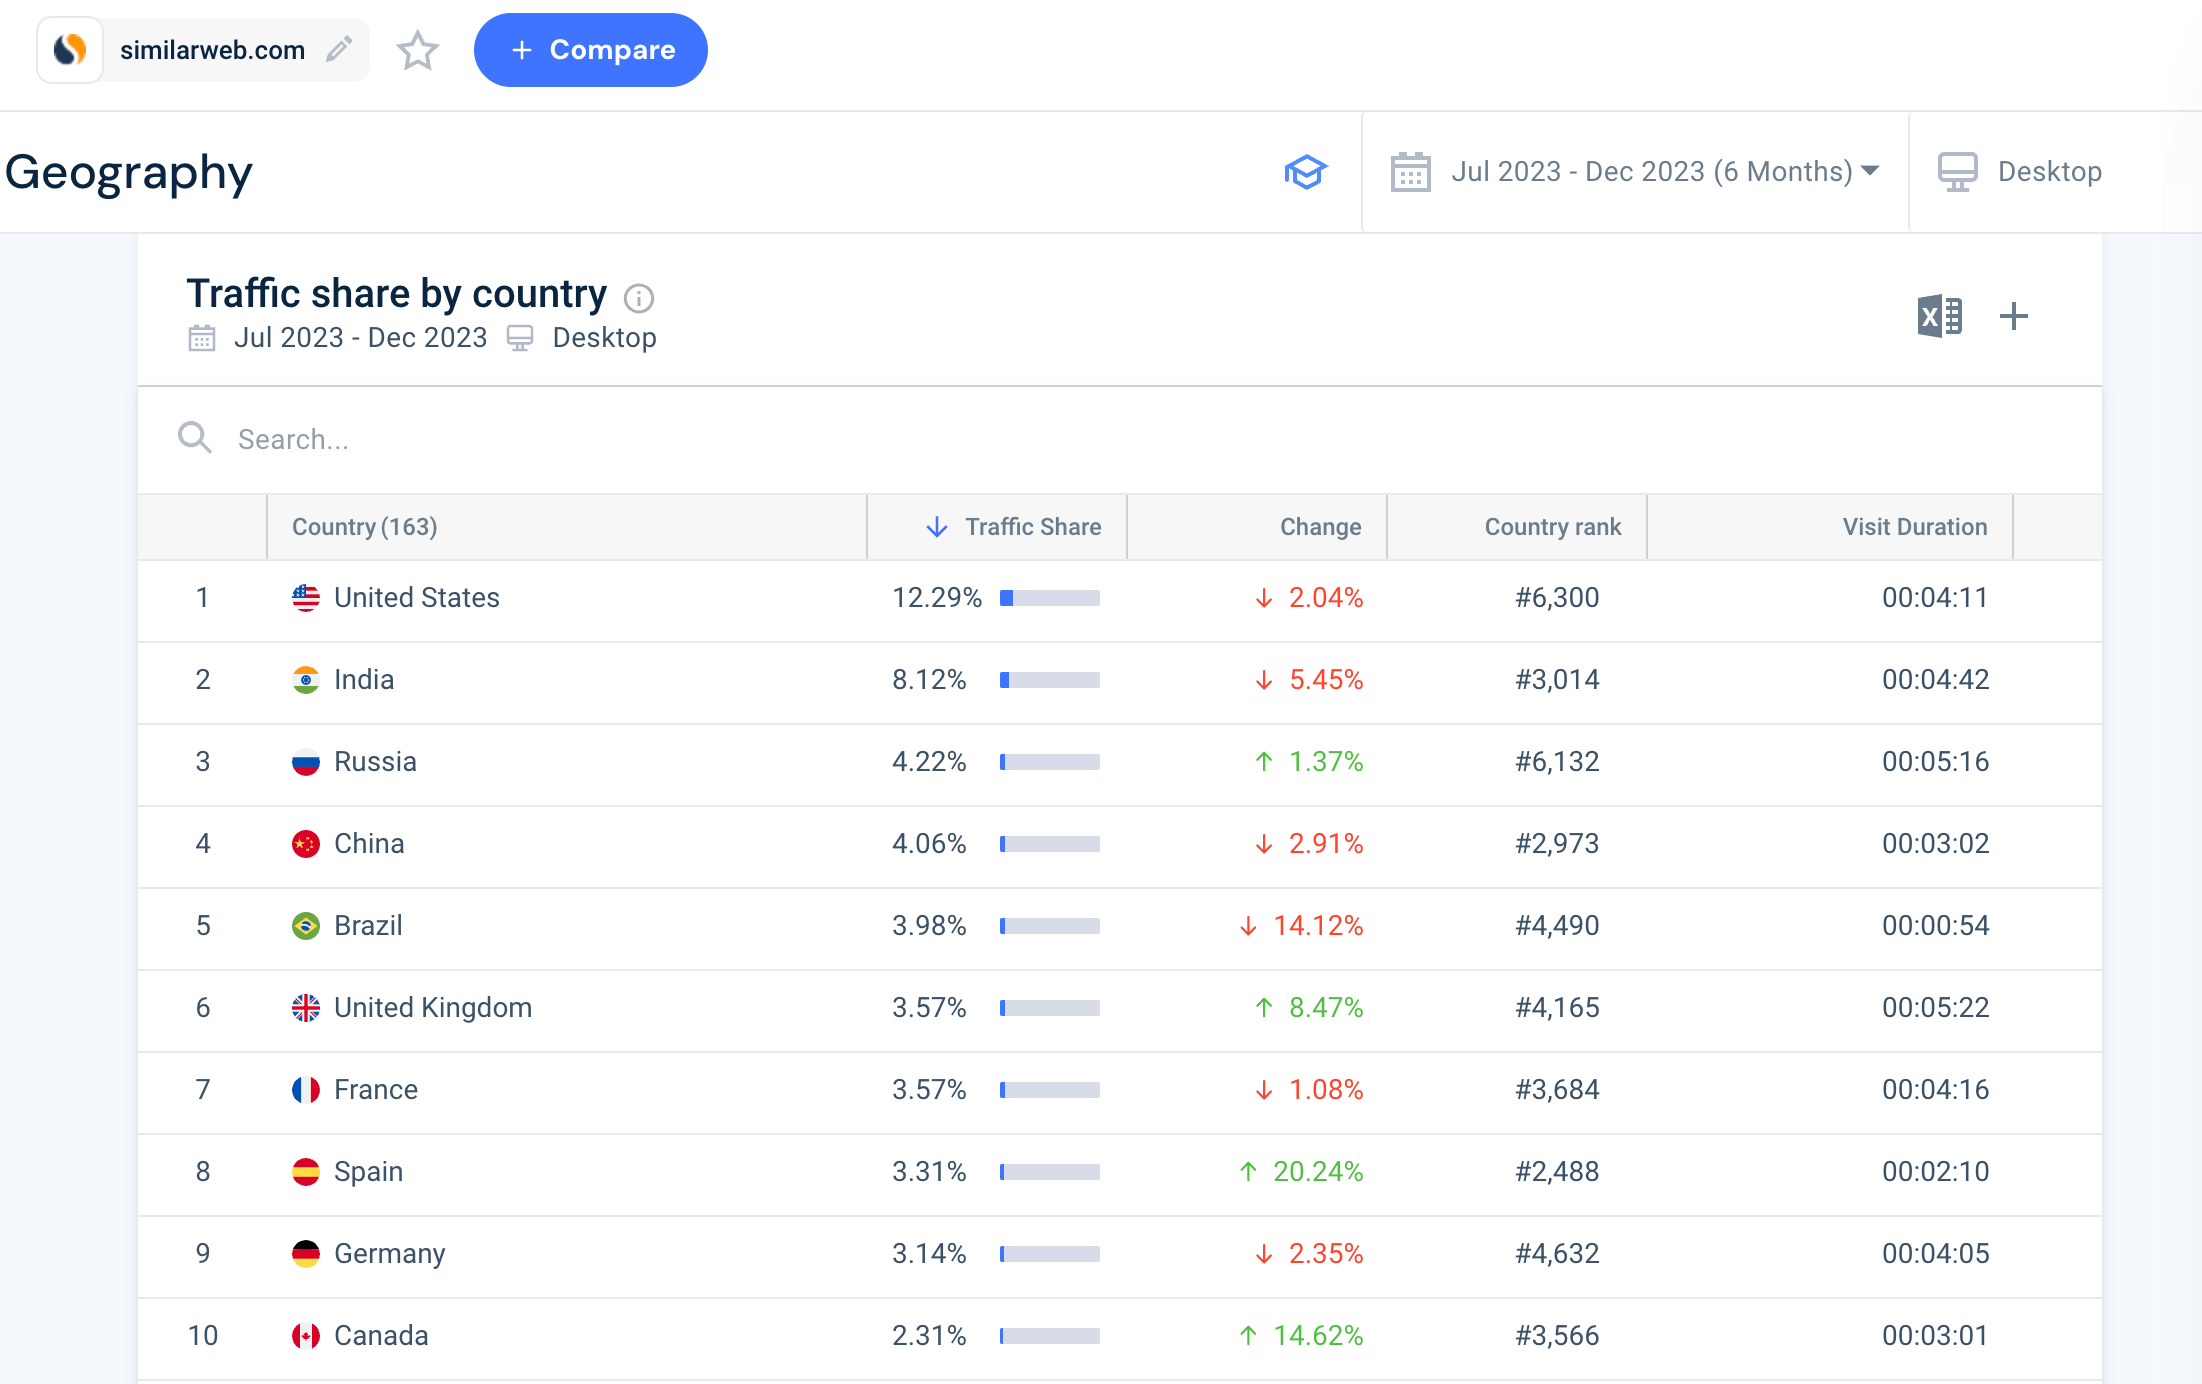
Geographic data can give you an idea of where and how your customers live. The example below shows that most users come to similarweb.com from the US. Spain is a promising region, with over 20% growth in traffic share in the last six months.
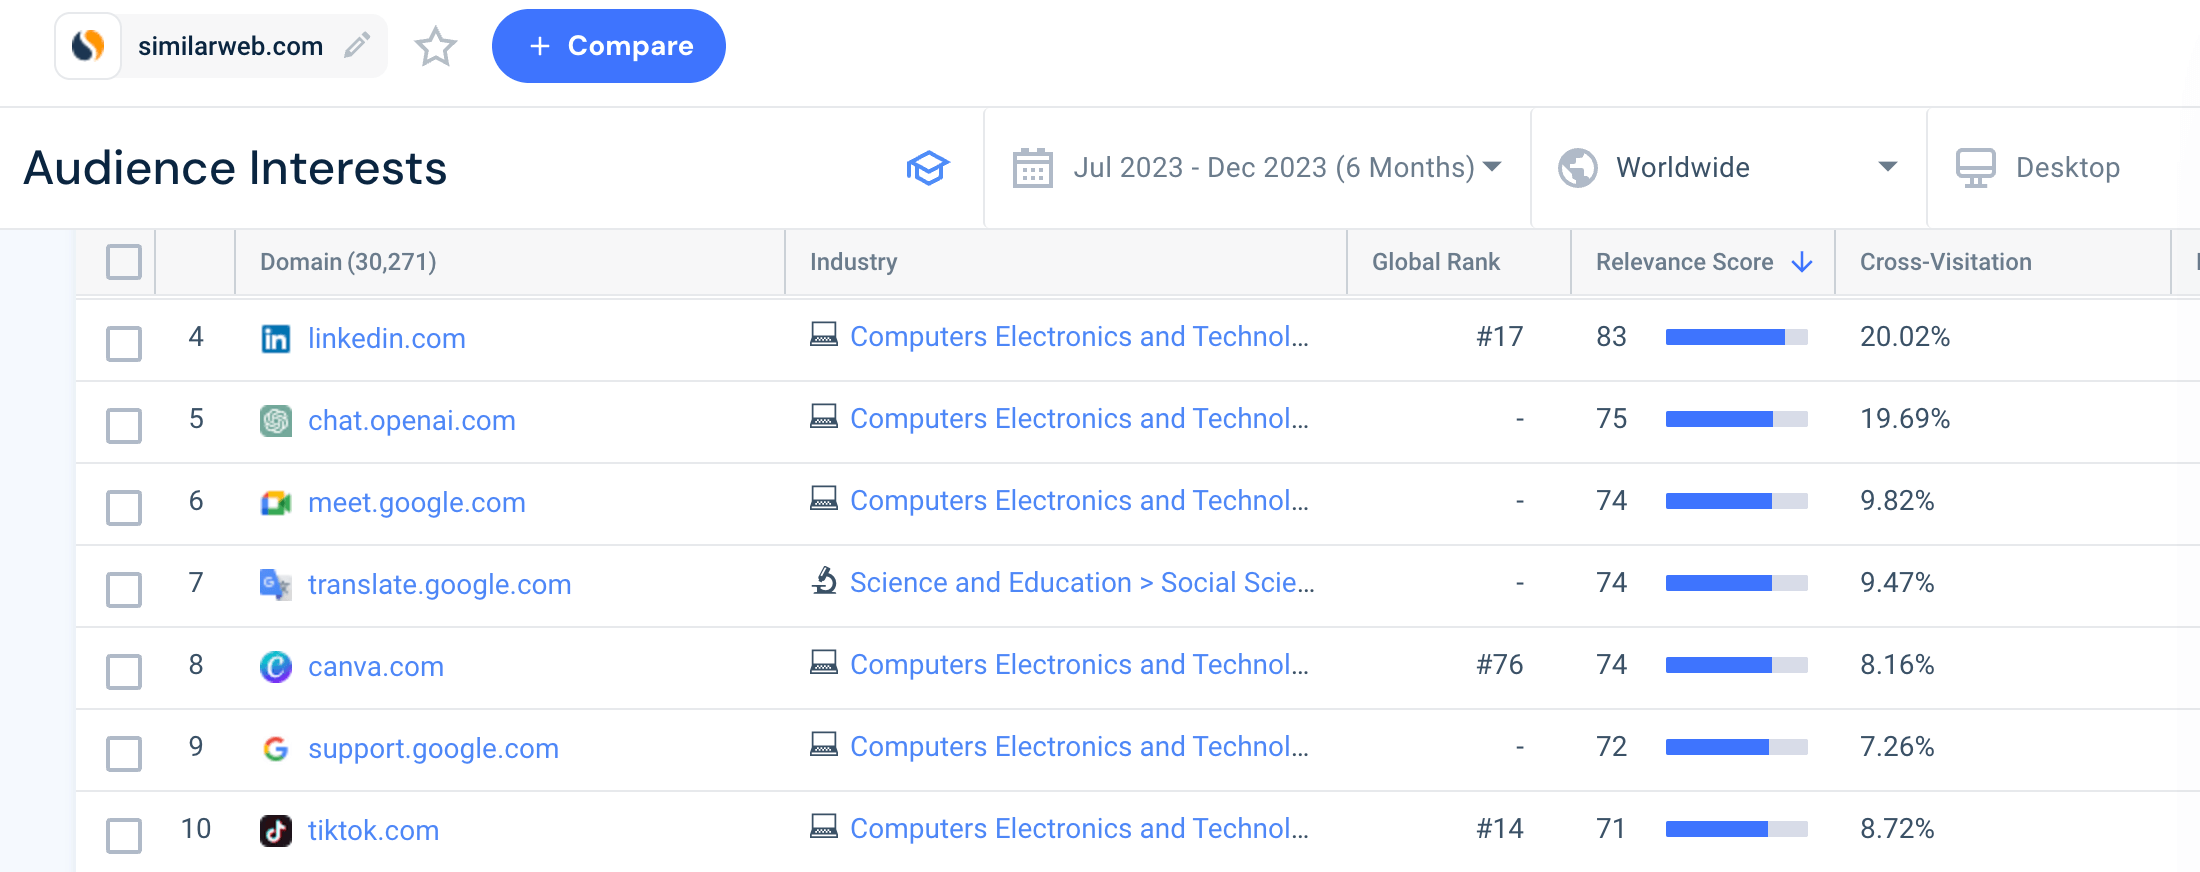
Once you know your audience, an important step in analyzing website traffic is understanding their browsing habits, including industries, topics, and other domains they are interested in.
Most visitors to similarweb.com visit other computer electronics and technology websites, as well as online marketing, programming, web design, and multimedia domains, such as LinkedIn, ChatGPT, Canva, Google Translate, and Google Meet. This makes sense, as Similarweb would just be one tool in their tech stack.
Identifying the marketing channels that bring the most traffic to your website is crucial so that you can concentrate your marketing budget and uncover opportunities to win even more traffic.
With Similarweb Marketing Channels Overview, you can identify the leading channels generating traffic, including:
In the last year (January-December 2023), two traffic sources fought for the top spot for walmart.com: direct and organic search. As a global ecommerce giant, it makes sense that brand awareness is strong and the major driver of traffic to their website. Organic search wins, accounting for 39.4% of the traffic (or 1.8 billion visits); direct is in a close second with 37.6% of traffic share.
Paid search drives a significant amount of traffic at 15.6%, with a noticeable spike around the holidays. Some of the highest-performing product ads focus on electronics like televisions and laptops.
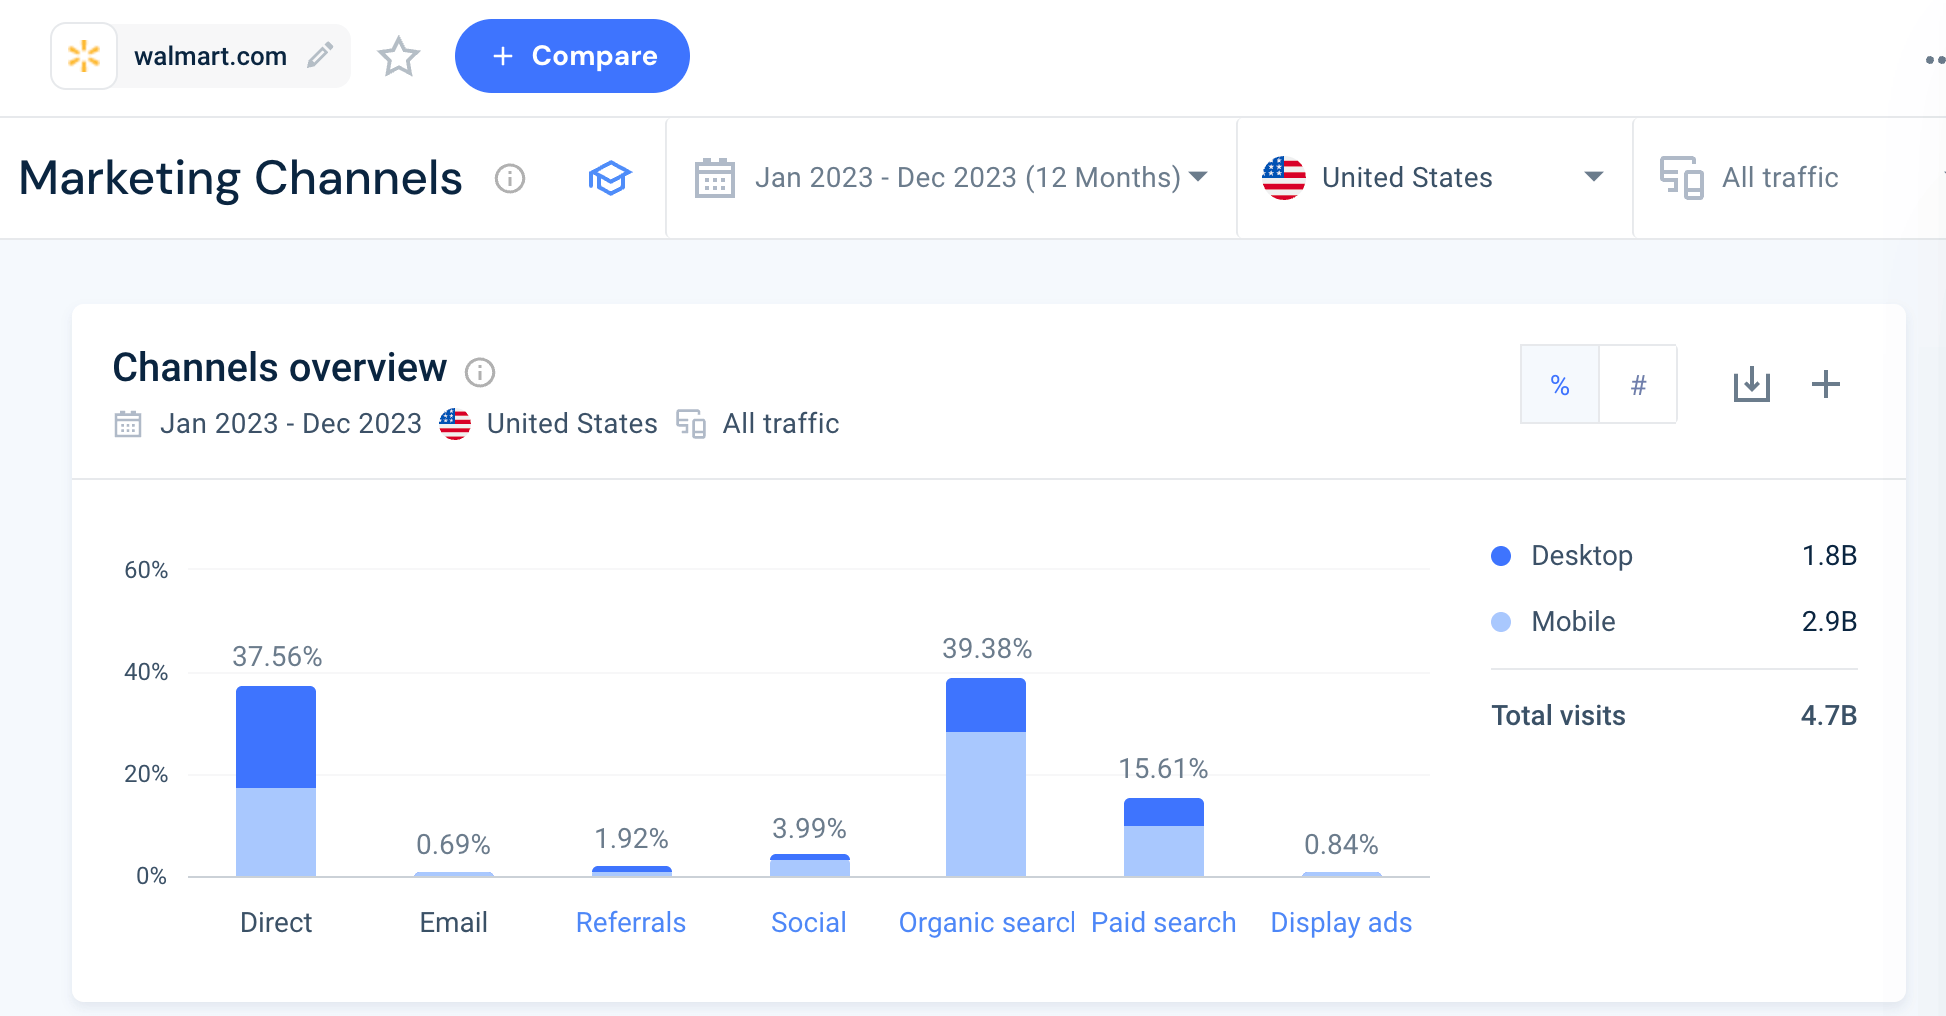
Social media sends 4% of traffic share to walmart.com, a total of 187M visits. Most social traffic comes from mobile web – 160M compared to 27M from desktop. Strong channels are YouTube, Facebook, and Reddit.
Analyzing your website traffic is just the tip of the iceberg. To use the data you collect effectively, you must watch out for peaks or, more importantly, dips in traffic over time.
Although slightly alarming, drops in traffic aren’t something to panic about as long as you have the digital tools to correct any issues. Here are some key reasons why you may experience drops in website traffic:
Finding the source of the website traffic drop will help you solve the problem and develop a solution. Here are 5 steps to do so:
Let’s go back to our example of walmart.com. If we look at the company’s website traffic over the last 12 months, in the US, there was a significant dip in traffic of 15.6% from July to September 2023.
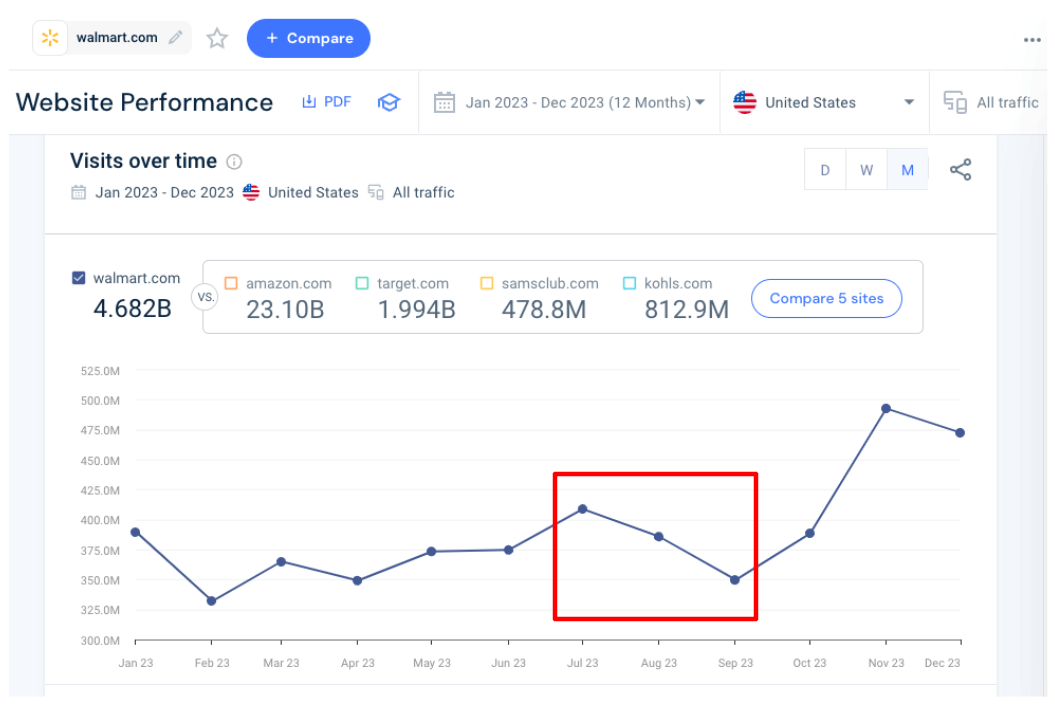
At first glance, this drop seems seasonal due to the summer and decreased consumer spending accompanying this period. The sharp uptick in September, when most people conduct back-to-school shopping, supports this.
In addition, user engagement metrics, including visit duration, pages per visit, and bounce rate remain stable during this period, which suggests that user preferences and content quality are likely not the cause of the drop in traffic.
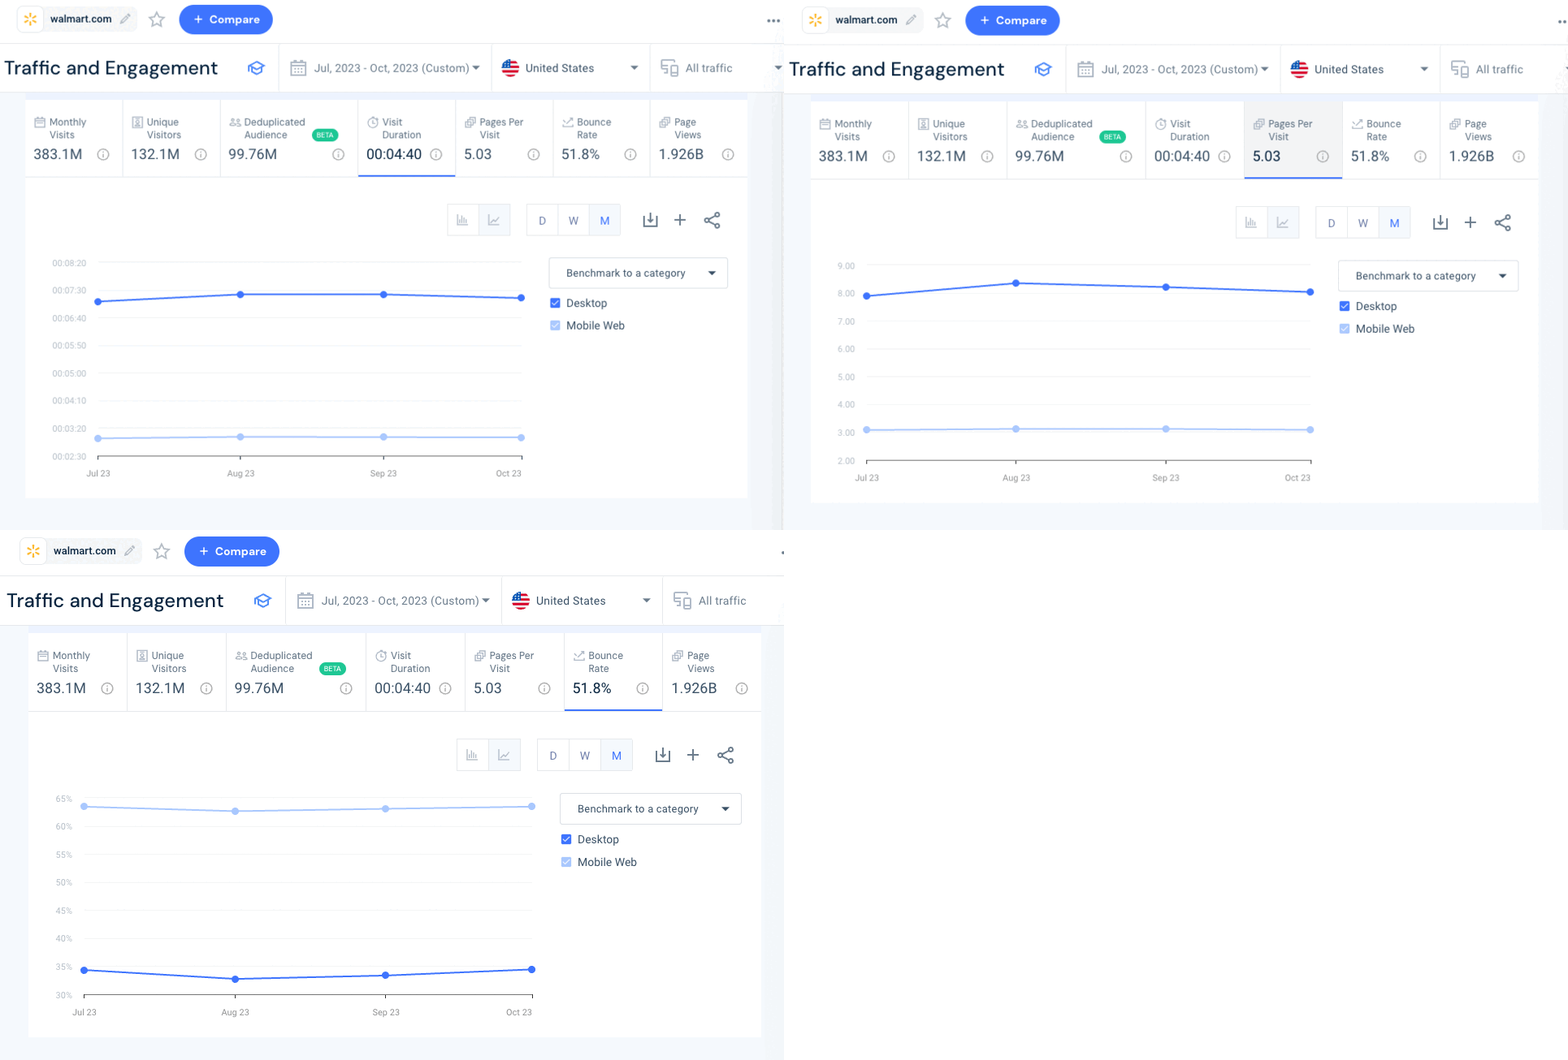
It’s time to dig deeper and zero in on traffic between devices over time.
A decrease in traffic from mobile web amid relatively stable desktop traffic usually points to a performance or optimization issue. Make sure that user experience and familiarity are replicated across all devices – you want your mobile website to look and feel the same as your desktop one and vice versa.
For Walmart, both mobile web and desktop traffic decreased between July and September 2023. This means that device performance is not the cause of the traffic drop. Note that in 2023, walmart.com received, on average, 23% more traffic from mobile web than desktop.
For this example, we focus on walmart.com’s performance in the US. However, you could apply this same methodology and look at the geos your company operates in to see if a drop in web traffic is limited to one country or a more global issue. If you find a significant decrease in traffic in one geographic area, look at cultural issues or regional holidays that could play a factor.
Delve into marketing channel performance to see if you can pinpoint the source causing the decrease in traffic. For walmart.com, all marketing channels except display ads experience a dip throughout July and September 2023. Organic search, the biggest traffic driver, saw an 11% decrease in September.
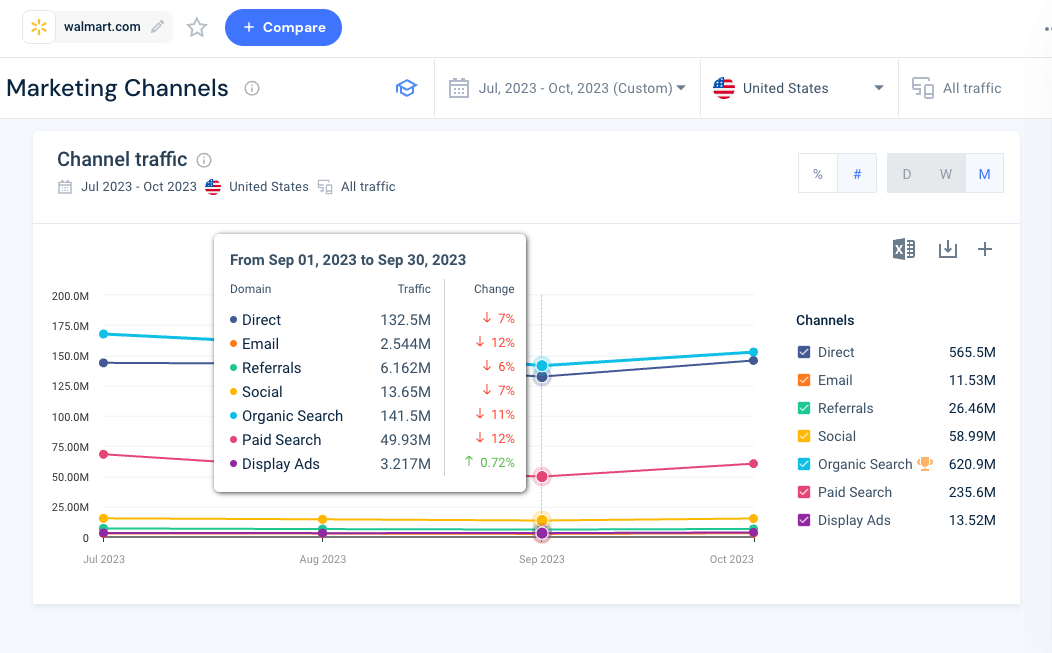
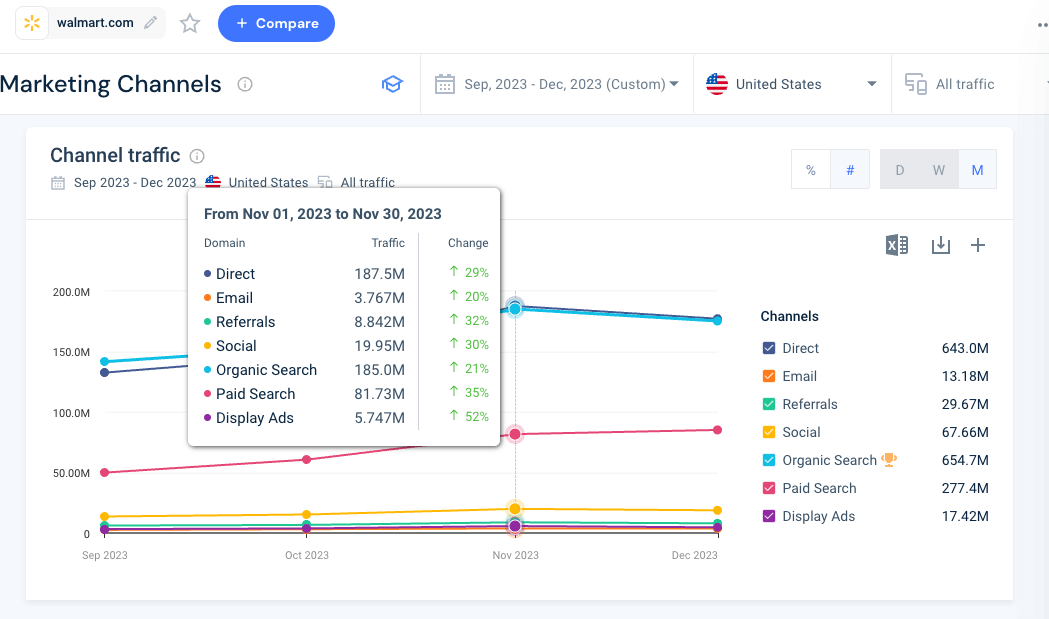
Walmart’s marketing channels experienced growth towards the end of 2023, with a huge spike in November 2023, when the company likely launched marketing campaigns and paid ads targeting consumers during the holiday season.
Since organic search is Walmart’s top-performing traffic source, let’s dig deeper into keyword performance to see how they can be more competitive.
Keywords give insight into what consumers look for when they search online and can help companies drive website traffic through competitive SEO strategies.
For example, between July and September 2023, many visitors to walmart.com searched for home goods and kitchen appliances. Walmart.com lost traffic share to a main competitor (target.com) for many of those keywords. Some examples include: squishmellows (61% vs. 39%), desk (89% vs. 11%), curtains (69% vs. 33%), ottoman (100% vs. 0%), floor lamps (93% vs. 7%), and electric kettle (63% vs 37%.)
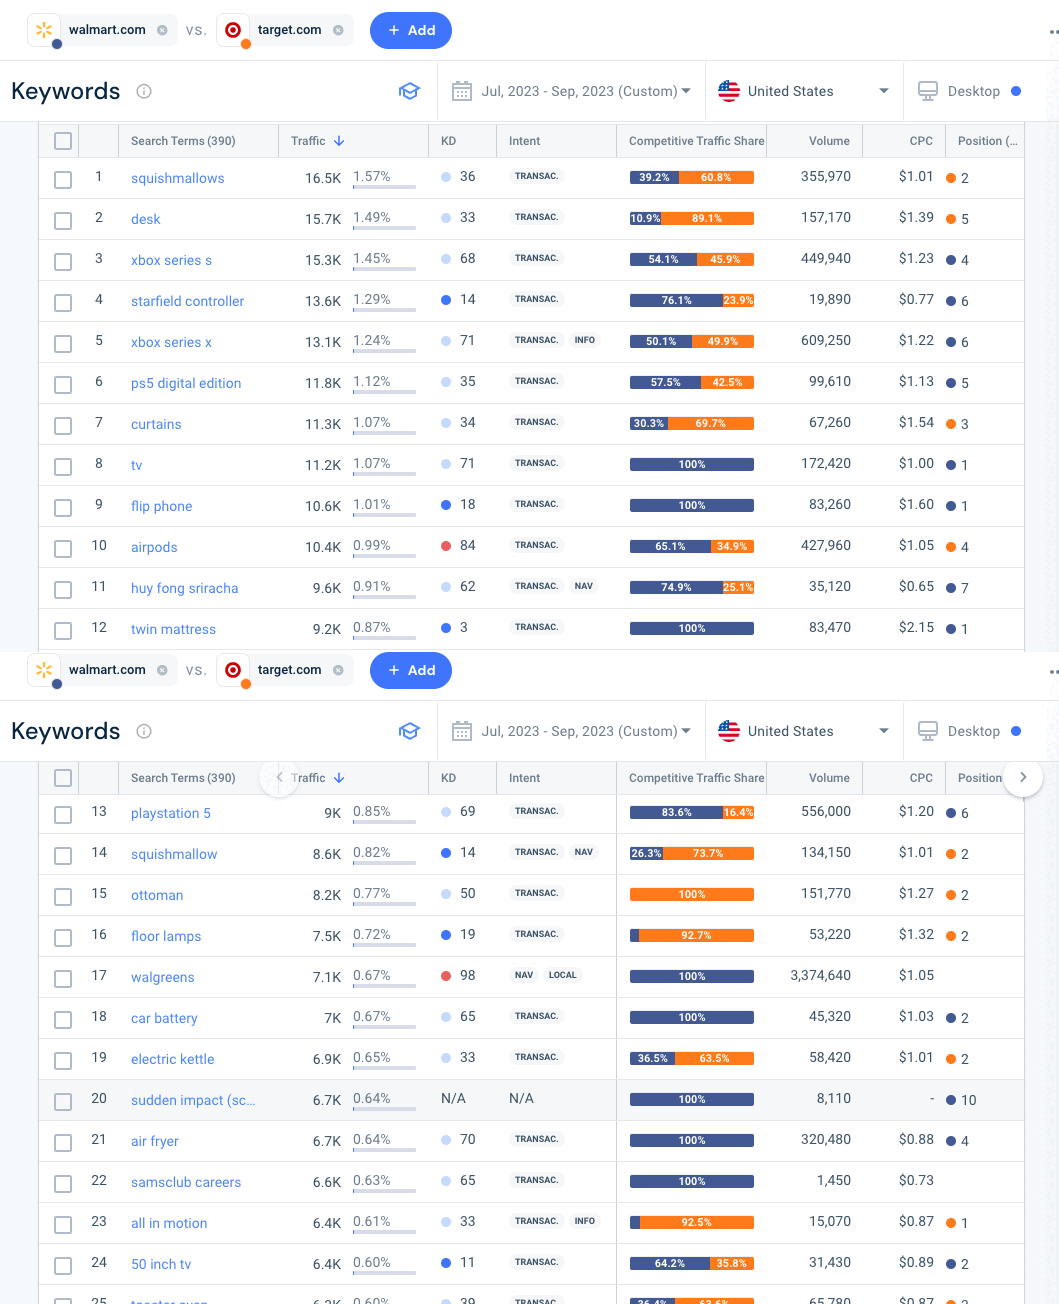
After looking at various web traffic metrics for walmart.com, the most likely reason for the dip in traffic is temporal. It relates to the summer season when consumers aren’t shopping as much as back-to-school or holiday periods.
However, our keyword research tool shows consumers actively search for home goods during this period. To win back some of the traffic lost due to seasonal traffic dips, Walmart should focus its efforts on targeting these keywords organically through SEO and with PPC and display ads.
Competitive benchmarking is an integral part of website traffic analysis. While Google Analytics may give you complete visibility into your website’s performance – your metrics aren’t enough. For example, you may have noticed through web traffic analysis that you’re growing 5% yearly – which is great! But after conducting Competitive Analysis, you find that your competitors are growing at double or triple the pace. You’ve got to understand what’s working for them and their strengths and weaknesses to bridge any gaps in traffic and eventually outperform them. That’s where a traffic gap analysis comes in.
Traffic gap analysis is the process of comparing your website’s traffic to that of your competitors to determine:
Conducting a traffic gap analysis helps you set realistic goals, spot opportunities your competitors might not have considered, better allocate resources, and stay ahead of any digital shifts.
Similarweb makes it easy to check your competitors’ traffic over time and monitor their performance against yours.
To benchmark your website traffic, open Similarweb, go to Website Analysis > enter your URL > add up to four competitor URLs > Website performance. Here you’ll get a breakdown of your website vs. your competitors, including device distribution, user engagement, global rank, industry rank, and more.
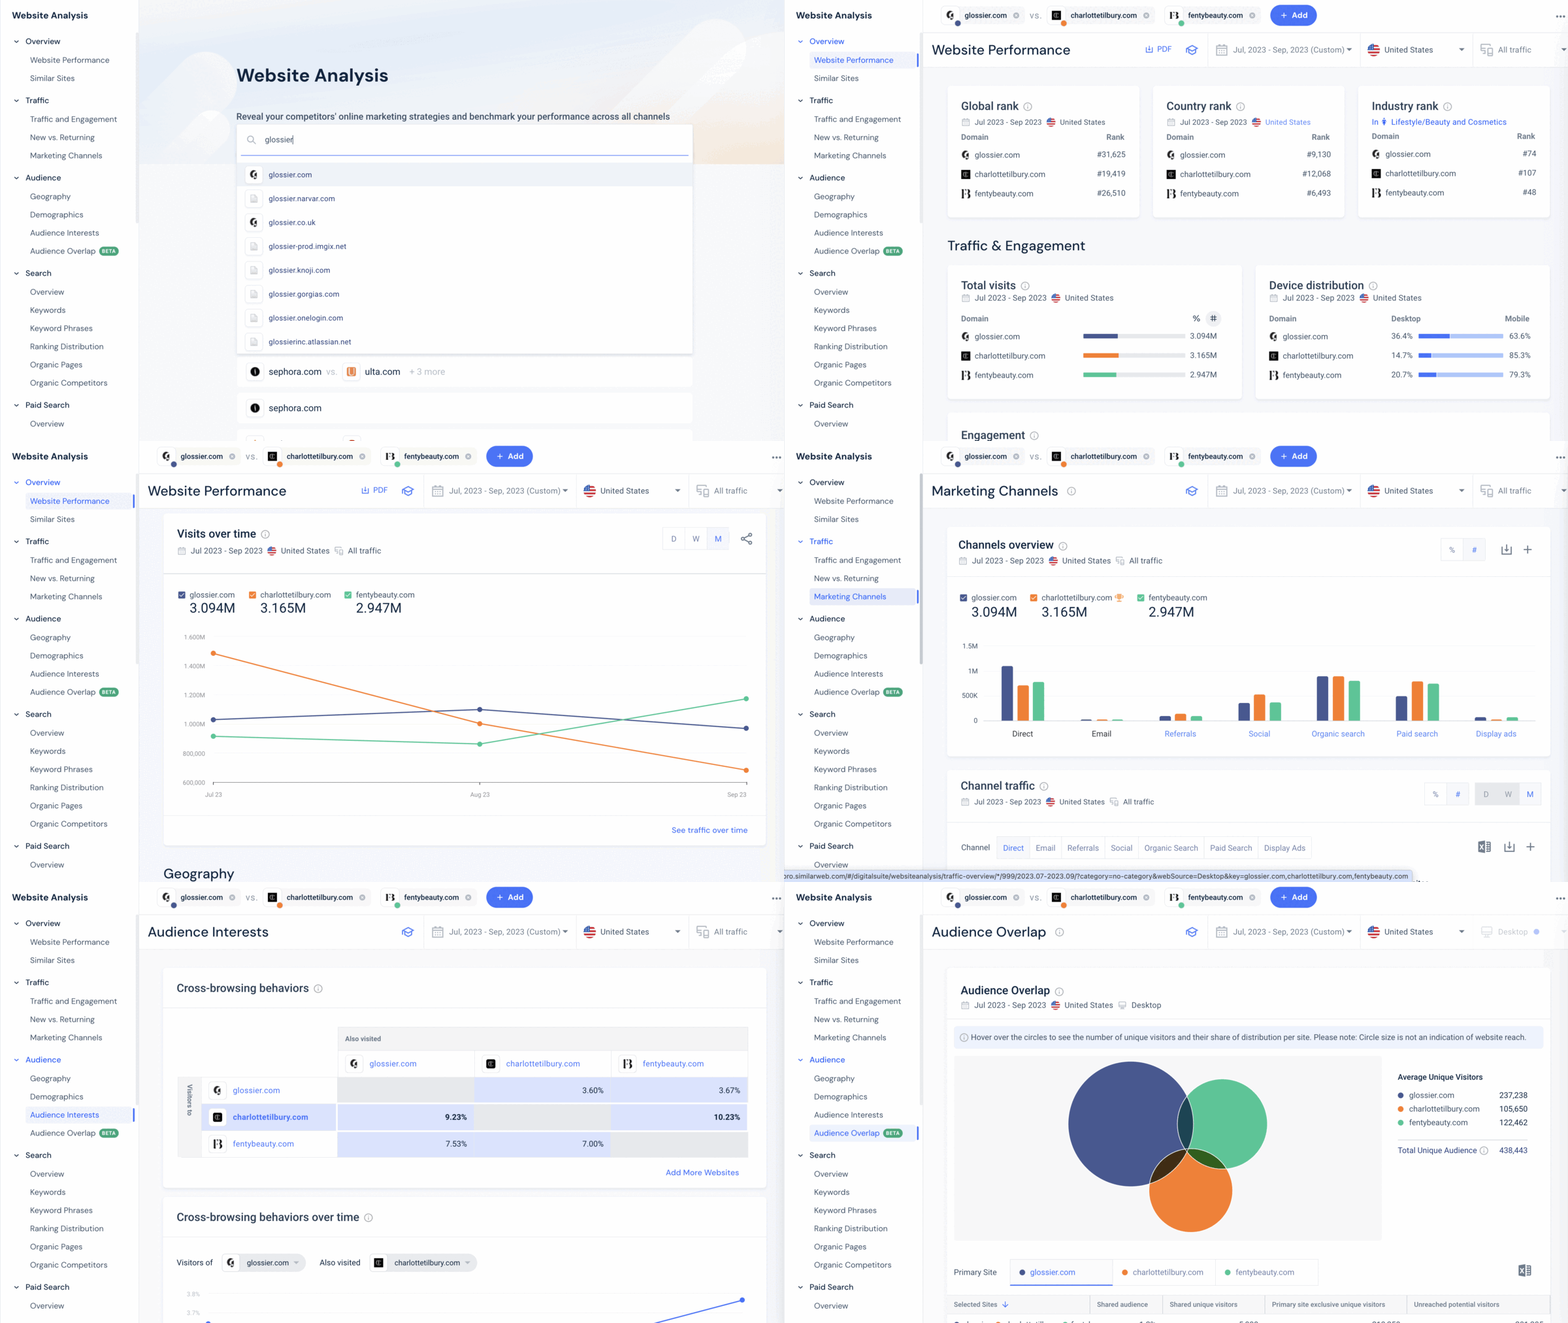
From there, navigate to Marketing Channels to see performance for the competitive set, Demographics to get a breakdown of your audiences by gender and age, Audience Interests to see cross-browsing behaviors, and Audience Overlap to see with which competitor you share the most unique visitors.
Your website reflects the overall performance of your business, including market health, competitive position, and user experience. Checking your website traffic is the key to decoding user behavior, keeping tabs on the competition, assessing market shifts, and evaluating the effectiveness of your strategies.
Similarweb provides the tools to navigate every aspect of your website and track the metrics you need to stay competitive and thrive in the complex digital world.
How can I check website traffic for free?
Head over to the Similarweb homepage to analyze the traffic of any website!
For insights on-the-go, you can install Similarweb’s free traffic analysis extension and get an exclusive view of any website’s performance, including total monthly traffic and engagement over time, directly in your browser tool. In one click, you get insight into any website’s global, country, or category rank, and more.
What is website traffic?
Website traffic is the number of visitors a website receives over a given period and is a crucial metric for assessing the popularity of a website. Some of the most common metrics to measure website traffic include monthly visits, user engagement, marketing channel performance, and new vs. returning audience split.
Why is checking website traffic important?
Checking and analyzing your website traffic provides valuable insight into user behavior. Understanding how and why your audience visits your website will enhance their experience and drive new traffic. It can also contextualize your performance compared to competitors and pinpoint areas to improve to be more effective.
What are the top metrics for measuring website traffic?
Ten of the most common metrics for checking website traffic are:

Director of SEO & AI Search at Similarweb
Limor brings 20 years of expertise in SEO and AI Search. She thrives on solving complex problems, creating scalable strategies, and building amazing dashboards.
The Top 100 Most Visited Websites in the USA (August 2026)

Similarweb Named in Forrester's Answer Engine Optimization Technologies Landscape, Q3 2026

Anthropic IPO: What Claude's Web and App Data Show
The ultimate solution to help you build the best digital strategy
