
What Is Retail Intelligence? How It Works and Why It's Essential to Digital Commerce
by Ida Lorenz12 Min.
Oct 19, 2026

Here’s a scenario that will feel familiar if you run marketing for a company with a long sales cycle.
A buyer lands on your site through different marketing channels. First, organically. Then directly. Then via a paid ad. Then directly again. Over 30 days, they visit eight times, spending 10 to 15 minutes each session, clicking through your product pages. On visit eight, they fill out a quote form.
Your rep tags it in the CRM as “Other.”
That single word undermines all of the touchpoints that led the user to that point.
The ChatGPT conversation that introduced your brand, the Reddit thread that validated it, the well-placed display ad on their favorite news site that reminded them, and the competitor site they visited the same afternoon before coming back to you.
Gone.
You’re essentially left with a data vacuum that threatens the budget for every channel that actually drove the sale.
This is the core attribution problem in modern marketing. And it’s only getting worse. Forrester’s 2024 Buyers’ Journey Survey found that 92% of B2B buyers start the purchasing process with at least one vendor already in mind, meaning the shortlist is formed long before a sales team ever makes contact. And most of that research happens in places where attribution was never designed to measure.
And it doesn’t mean you need a better CRM or complicated tracking software. It means you need a different kind of data entirely: audience interest data. This data shows you the real digital footsteps buyers take across the web. So instead of just viewing the one step where they finally clicked your link, you see the whole customer journey.
Audience interest data shows which other websites your audience visits during the same browsing session as visiting your site, measured as a percentage overlap.
You are seeing the literal digital footprint of your customer: where they went, in what sequence, within the same 24-hour window as visiting you.
That behavioral map tells you three things a CRM never will:
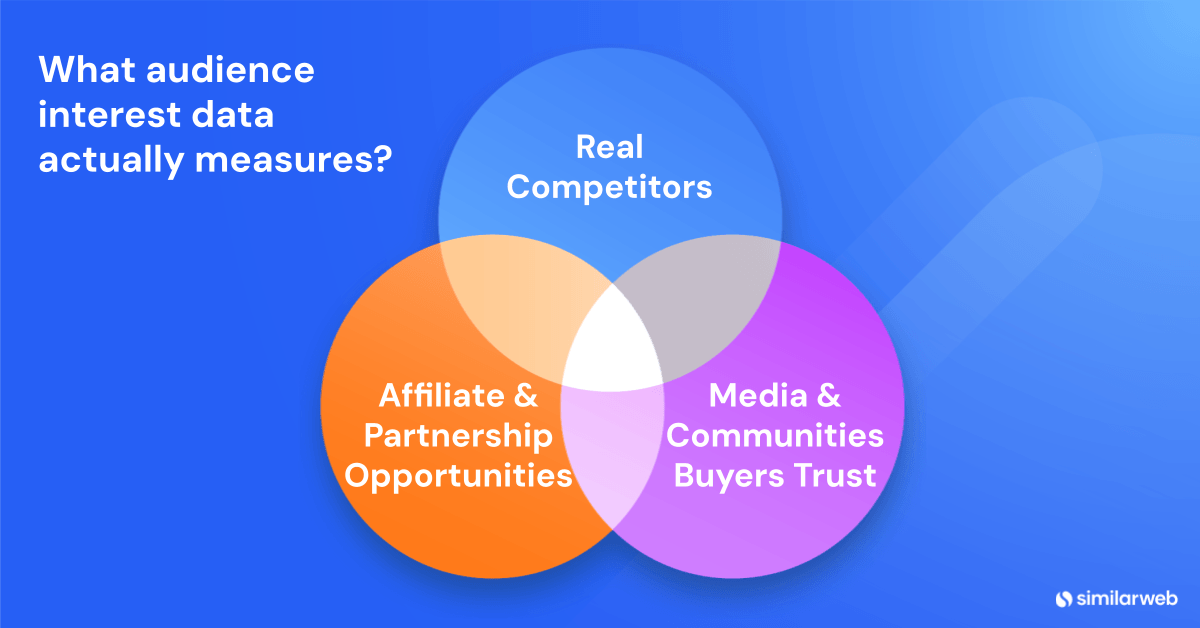
Who your real competitors are: Not the five brands you’ve been watching for years, but the ones your buyers are actually cross-shopping right now, including the ones that just popped up six months ago that you’ve probably never heard of.
What media and communities your buyers trust: Whether they read The Guardian or the Daily Mail, whether they cluster in niche subreddits or LinkedIn communities, and whether they shop at eBay or Anthropologie. The browsing data reveals the entire digital ecosystem shaping their worldview before they ever visit your site.
Where the affiliate and partnership opportunities are hiding: A domain your audience visits at a 6–8% daily overlap is a warm audience waiting for display ads and partnerships. If you already know your audience hangs out there, you know that any budget invested there will be used effectively.
The dark funnel is the portion of the buying journey that occurs before any trackable contact with your brand. It is not, unfortunately, just a LinkedIn buzzword, but rather a real place where attribution goes to die.
McKinsey’s 2024 B2B Pulse Survey found that B2B buyers now use an average of 10 interaction channels across their buying journey, up from just 5 in 2016. That number compounds further when you factor in AI research tools that weren’t meaningfully part of buying behavior in 2016 at all.
Here is what makes the dark funnel particularly dangerous right now: AI is eating the trackable part of it.
When a buyer types “I have a problem with X” into ChatGPT or Claude and gets a recommendation for a product, they may spend 20 minutes inside that AI conversation researching brands, and then open a new browser tab and type your URL directly. In your analytics, that session shows up as direct traffic. The AI’s influence gets zero credit.
Similarweb data shows that the B2B dark funnel is increasingly influenced by AI. ChatGPT is now a top-10 referral source for major B2B research destinations, sending 3.37% of Forrester’s traffic, 2.97% of Gartner’s, and 1.49% of G2’s traffic. These are the analysts and review platforms your buyers consult during vendor evaluation, and AI is sending buyers there before you ever see them.
But AI is only the newest layer of an older problem. Long before ChatGPT, buyers were making decisions in places that never generated a click. A product recommendation dropped in a Slack community. A Reddit thread where someone asked which vendor to avoid, and your brand came up favorably three comments down. A podcast episode where a host mentioned you in passing. An influencer on Instagram says they used you at their last company, and it was worth it. None of these produces a session. None of them appear in your attribution model. All of them move buyers.
What makes this so costly is the gap between where influence actually happens and where marketing teams are allowed to invest. When a buyer converts, and the CRM logs it as “direct” or “organic search,” the implicit conclusion is that the channel earning the credit is the channel worth funding. Everything that happened before gets quietly defunded because it cannot be proven.
This is why audience interest data matters so much right now. It doesn’t rely on a trackable click. It observes where buyers are already spending their time: the publications they read, the communities they trust, the platforms they browse on the same day they visit sites like yours. It cannot tell you what they said in that Slack thread or heard on that podcast. But it tells you where they were, and what they care about, which is worth its weight in gold to any marketer who’s ever stood in a board meeting trying to explain the value of brand awareness.
Most marketing teams monitor a fixed set of competitors they identified years ago. Nobody flags the threat that’s quietly eating into your market share until their name is splashed all over your social media feed and they’re impossible to ignore.
Audience interest data works differently.
It surfaces competitors based on behavioral overlap, not because you nominated them, but because your buyers are visiting them on the same day they visit you.
In Similarweb, enter your domain or your competitor’s, and navigate to Website Analysis → Audience → Audience Interests. The audience interest tool’s report returns a ranked list, sorted by relevance score, showing the percentage of that site’s audience that cross-visits each domain within the same 24-hour window.
The result exposes two categories most marketers (and certainly your Google Analytics dashboard!) miss entirely:
Category drift competitors: Brands operating in an adjacent vertical that are increasingly drawn into your buyers’ consideration window, even if they don’t map neatly to your category in any standard taxonomy.
Stealth competitors: New or fast-growing brands with low name recognition but measurable, growing audience overlap. They are taking a share before anyone on your team knows to look for them.
Most marketers know who their buyers are in the abstract: job title, company size, industry vertical.
But, those basic details are not enough to build a useful buyer persona.
As President and CEO of the Re-Wired Group, Bob Moesta once said, “No one buys The Wall Street Journal because they have an Ivy League education, a golden retriever, and make six figures a year.”
These traits may be correlated, but they’re not causal. They tell you who is sitting at the desk, but they don’t reveal the actual motivations, context, or triggers that drive them to make a purchase.
Audience Interests gets you as close as possible to describing an ICP based on these values and behaviors in a data-driven way.
How? It shows you the broader media and cultural ecosystem that those buyers inhabit, which shapes the language they trust, the framings that resonate, and the publications influencing their thinking before they ever search for your category.
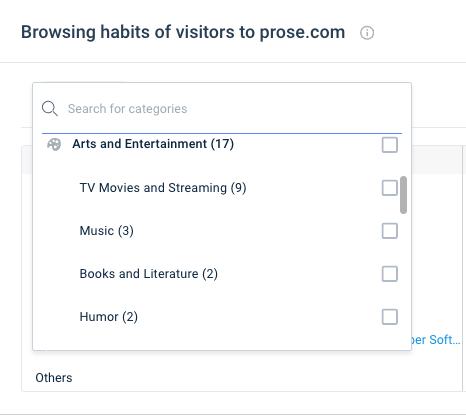
The filters help you break this down even further. So, you can browse all of the news or entertainment sites. Then, you can break it down even further with subcategories. So, Arts and Entertainment breaks down into TV, Movies and Streaming, Music, Books and Literature, and Humor. That way, you can see what content within that vertical your audience visits most heavily, complete with exact overlap percentages.
Most affiliate and partnership programs start with a guess: “Our buyers probably read [publication X]. Let’s reach out.”
The typical result is media spend on audiences that feel adjacent but convert like cold traffic because the overlap was assumed rather than measured.
Audience interest data makes this precise.
You can identify the exact non-competitor domains where 5–8% of your audience spends time daily. That is a population actively engaged in your broader ecosystem, and chances are, they have problems you can solve. They just haven’t met you yet.
The targeting logic is straightforward: a domain with consistent daily overlap with your buyers is a placement you can make with confidence. The affiliate manager doesn’t need to hypothesize. The data identifies the channel.
Prose is a DTC personalized hair care brand. Running Similarweb’s Audience Interests report on prose.com for February 2026, United States, reveals findings that internal analytics tools would never produce, with direct implications for competitive strategy, media planning, and affiliate outreach.
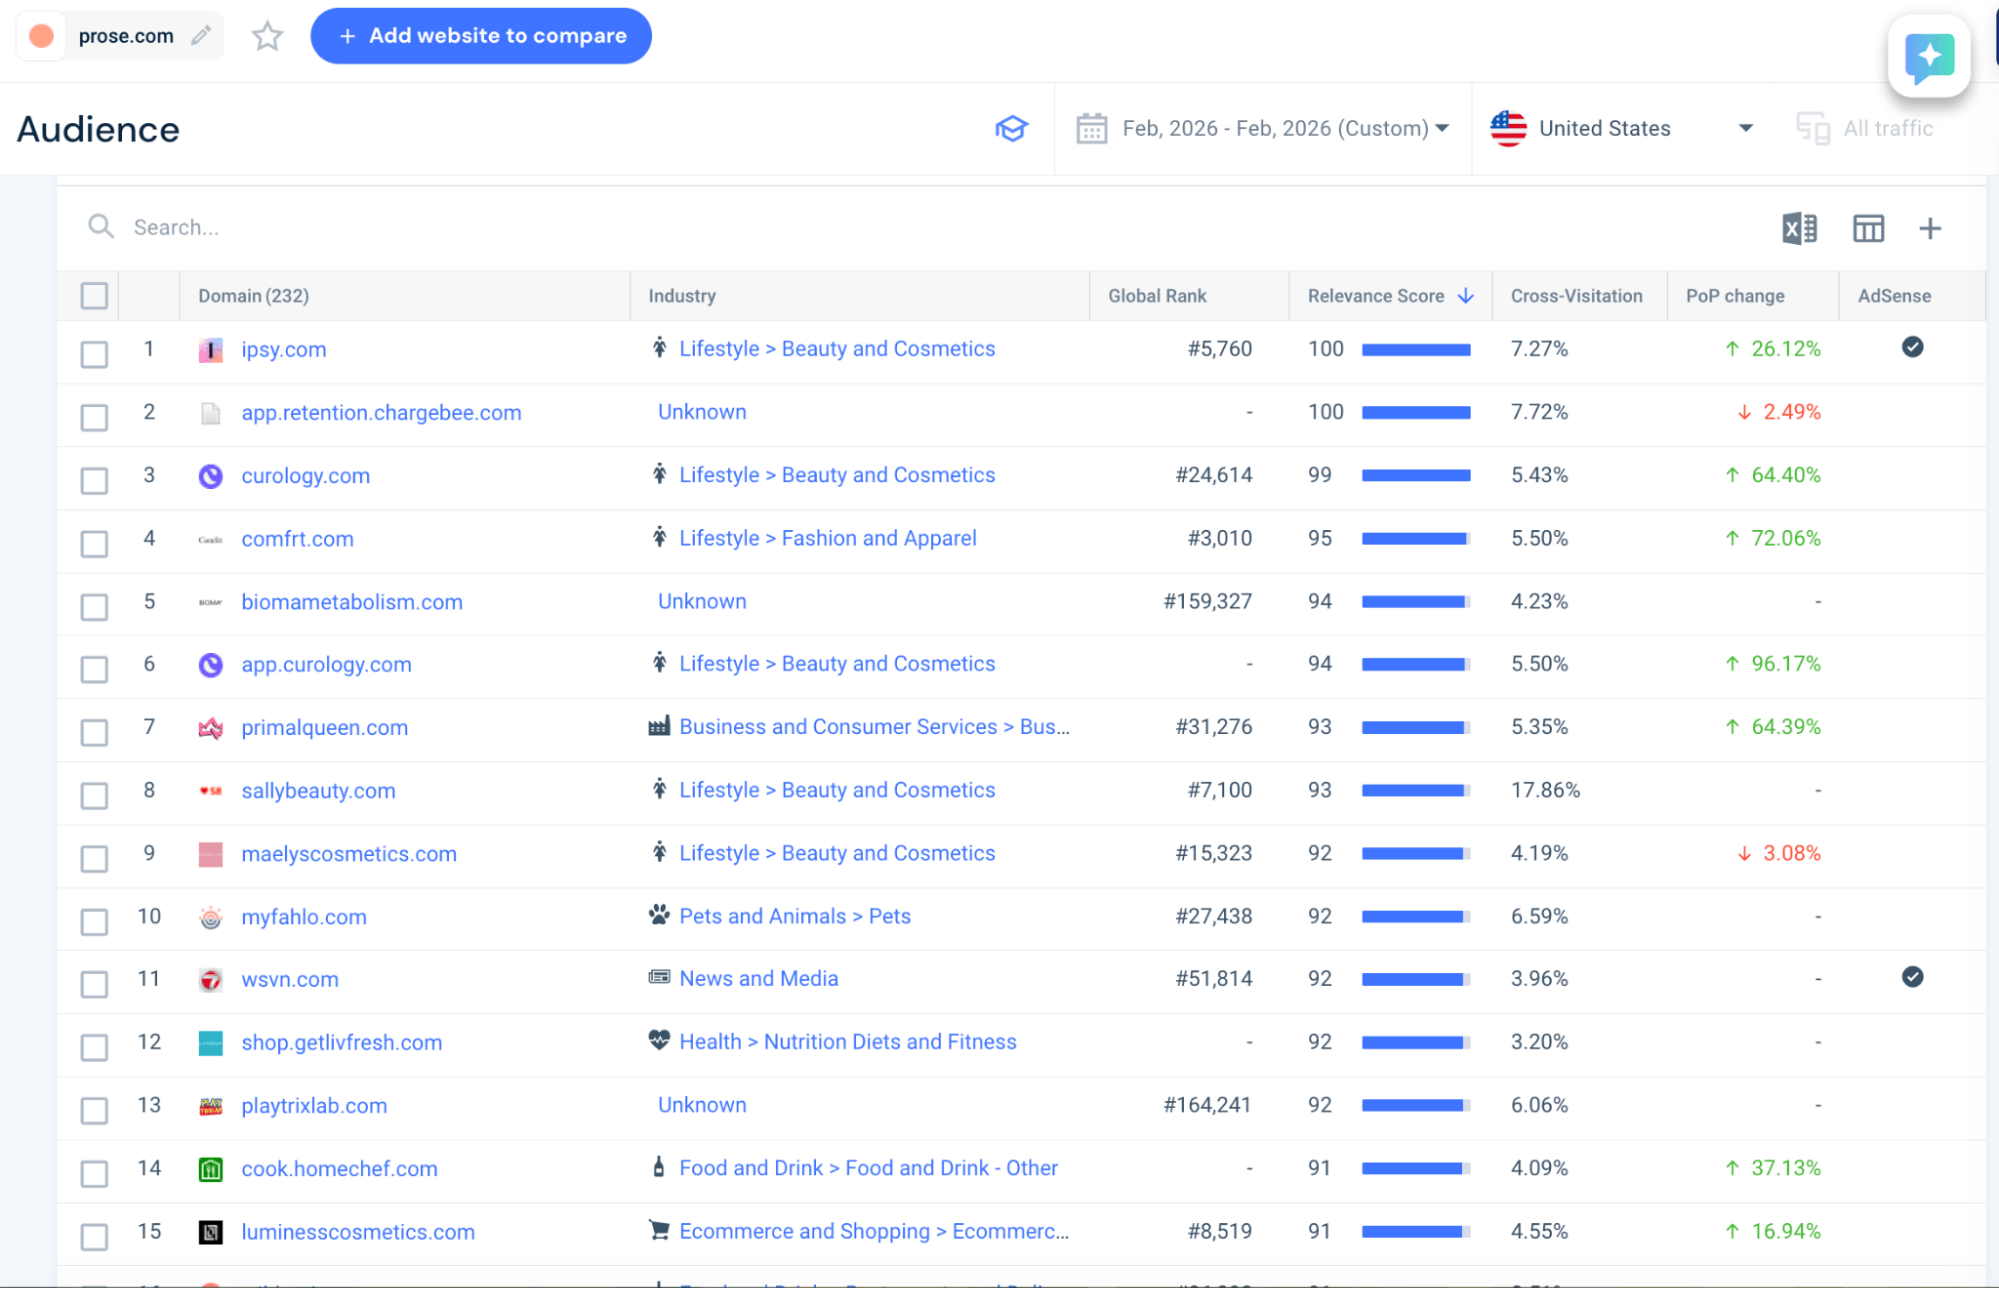
The top direct-category competitors by cross-visitation overlap confirm the obvious: sallybeauty.com leads all beauty-specific domains at 17.86% overlap, followed by sephora.com at 6.91% and ulta.com at 6.24%. ipsy.com sits at 7.27% with +26.1% period-over-period growth.
These are the brands Prose’s marketing team almost certainly already monitors. The more important signals are elsewhere in the list.
Rank 4 in the relevance-sorted list is comfrt.com, a lifestyle and apparel brand with a 5.50% audience overlap that has grown +72.1% in a single period.
Comfrt does not sell hair care. It will never appear in a competitive audit of the beauty category. But here is why it matters: audience overlap is a measure of shared attention, and attention is finite. When a brand starts appearing in your buyers’ browsing sessions at an accelerating rate, it is competing for the same mental bandwidth your brand needs to convert them. Comfrt is not trying to sell Prose’s customers shampoo. It is selling them something they want to buy in the same sitting, and every minute they spend there is a minute they are not spending with Prose. At 72% growth, it is doing this more and more. A brand does not need to be a direct competitor to dilute your share of a buyer’s consideration. It just needs to be present, and increasingly, Comfrt is.
curology.com, a prescription skincare brand, sits at rank 3 with a 5.43% overlap and +64.4% growth.
The strategic threat here is subtler but more direct. Curology is not selling shampoo, but it is selling the same underlying thing Prose sells: the idea that your beauty routine should be personalized to you specifically, formulated for your needs, and delivered to your door. Prose has built a business on that proposition for hair. Curology owns it for skin. And at +64% growth in audience overlap, Prose’s buyers are increasingly treating both as part of the same considered purchase, which means Curology is not just an adjacent brand, it is a competing answer to the question “where should I invest in personalized self-care this month?” If a customer’s discretionary beauty budget stretches to one subscription and she is cross-shopping both on the same afternoon, that is a conversion Prose can lose to a brand that has never once sold a hair product.
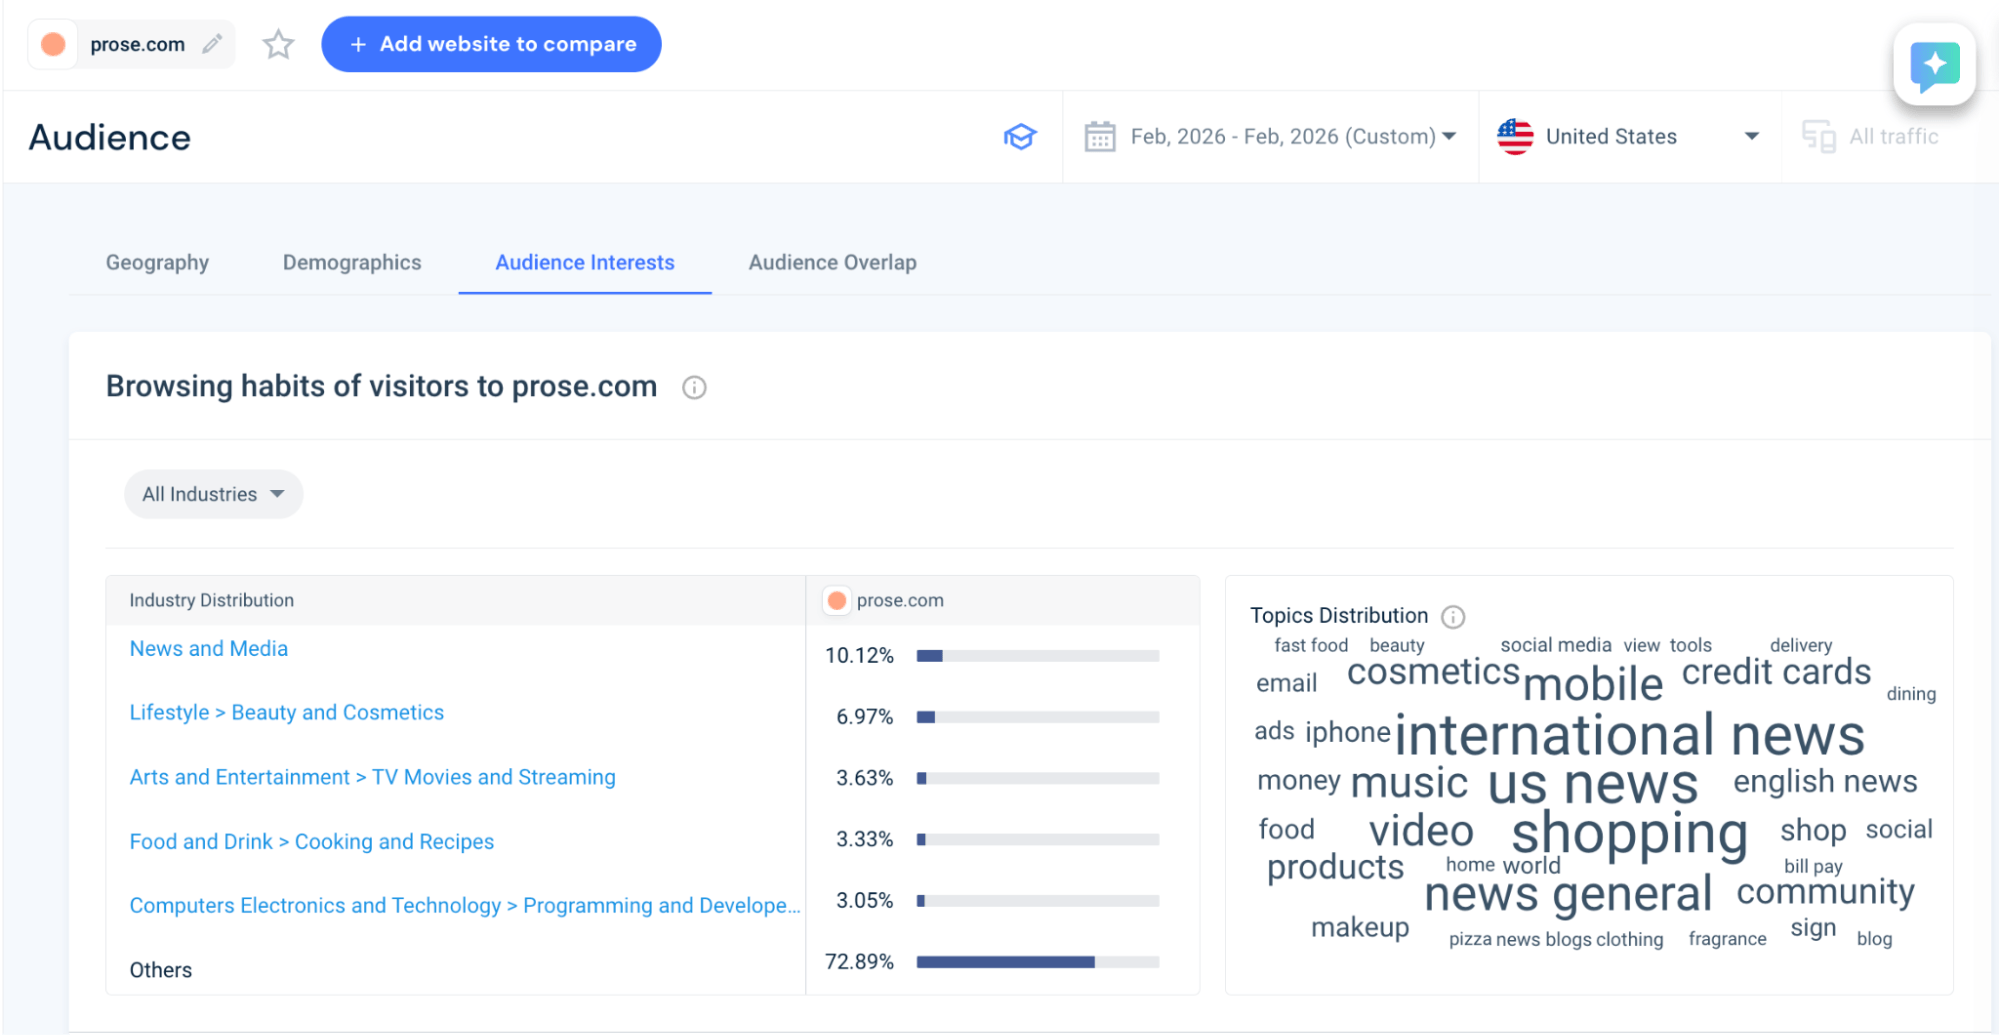
The industry distribution data for Prose’s audience reveals something counterintuitive for a beauty brand:
The largest industry overlap is not beauty content. It is news by a margin of more than 3 percentage points over the brand’s own category.
Drilling into individual news domains confirms the picture. newsweek.com shows a 7.14% overlap with +112.5% growth. dailymail.co.uk shows 7.14% overlap with +133.9% growth. These are among the fastest-growing cross-visitation signals in the entire dataset, and both are news properties, not beauty or lifestyle publications.
The implication for media buying is direct: campaigns placed in news environments reach a warm Prose-adjacent audience at scale. Campaigns built only for beauty content are targeting a narrower slice of the actual buyer ecosystem than the data supports.
Three major AI tools also appear in the cross-visitation list with measurable overlap.
| AI tool | Overlap | PoP change |
|---|---|---|
| chatgpt.com | 13.6% | +19.5% |
| gemini.google.com | 13.1% | -5.7% |
| claude.ai | 8.0% | -34.4% |
More than 1 in 8 of Prose’s audience visits ChatGPT on the same day they visit Prose. That reflects how this audience (and really consumers everywhere) researches, discovers, and validates purchasing decisions.
That means that a brand visibility strategy that doesn’t account for AI citations is missing a channel that over 13% of its audience uses on the same day as visiting the brand’s own site.
Beyond the competitor picture, the dataset surfaces non-competitor domains with high daily overlap, the basis for a data-driven affiliate and partnership outreach list. More than that, they fill in the picture of who this person is.
myfahlo.com (Pets and Animals) appears at a 6.59% overlap, higher than most beauty competitors in the dataset. More of Prose’s audience visits a pet-focused platform on the same day as visiting Prose than visits ulta.com.
Think about what that tells you. This is someone with a dog or a cat whom she treats like family. She is probably spending $80 a month on premium pet food or supplements without blinking, the same way she does on a personalized hair care subscription. She has discretionary income, she spends it on things that feel personal and high-quality, and she does not see the pet aisle and the beauty aisle as separate parts of her identity. They are both expressions of the same values. A co-branded campaign between Prose and a premium pet brand is not a stretch. It is a behaviorally validated audience match.
cook.homechef.com (Food and Drink) shows 4.09% overlap with +37.1% growth, and it rounds out the picture further. She is not cooking from scratch every night. She has a busy enough life that a meal kit makes sense: she wants to eat well, she does not want to think about what to buy at the grocery store, and she is willing to pay for the convenience of it being delivered and portioned out for her.
Put all of this together, and the buyer persona builds itself. In this case, our customer is a time-poor, taste-conscious woman who outsources the logistics of daily life: meal kits, custom beauty subscriptions, and secondhand fashion shopping from her phone. That way, she can spend her actual energy on the things that matter to her. She is not a demographic category. She is a person with a specific life, and the data just described it.
Neither pets nor meal kits would appear on a list of obvious Prose partnership targets. That’s exactly the point. A persona document built from survey data or demographic assumptions would never get here.
Audience interest data does.
Here is what the Prose dataset makes possible that a demographics report never could: a plausible version of this buyer’s day online, and a blueprint for every moment Prose could be part of it.
Since Prose’s audience skews primarily female, this “day-in-the-life” example will describe her. Let’s call her Laura.
Laura wakes up and opens the news. Newsweek or the Daily Mail. A sponsored story about the science of personalized hair care, or a display ad timed to morning browsing, reaches her before she has opened a single beauty app. She is already forming opinions about what deserves her attention today, and Prose is one of them.
Mid-morning, she opens ChatGPT or Gemini. Maybe she asks about ingredients in a shampoo she saw, or whether a subscription hair care service is actually worth it. Prose shows up in the answer, framed as the expert recommendation for the exact question she is asking. No click is recorded. But she just got the endorsement from a source she trusts more than any ad.
At lunch, she checks out a meal kit service, browsing options for the week. Laura is in subscription mode, making decisions about the recurring purchases that make her life run more smoothly. A Prose placement here, or a co-branded offer with the meal kit service, lands on someone who has already decided she is the kind of person who pays for convenience and quality. She does not need convincing. She needs a reason to click.
By the time Laura visits prose.com, she has encountered the brand four times in contexts that felt native to how she actually spends her day. Her session registers as organic search or direct traffic. The attribution model sees the last step. But the last step was easy, because every step before it did the work. Yes, there are first-click and multi-touch attribution models that add more depth, but none of these models is comprehensive enough to capture the entire customer journey as you see it here.
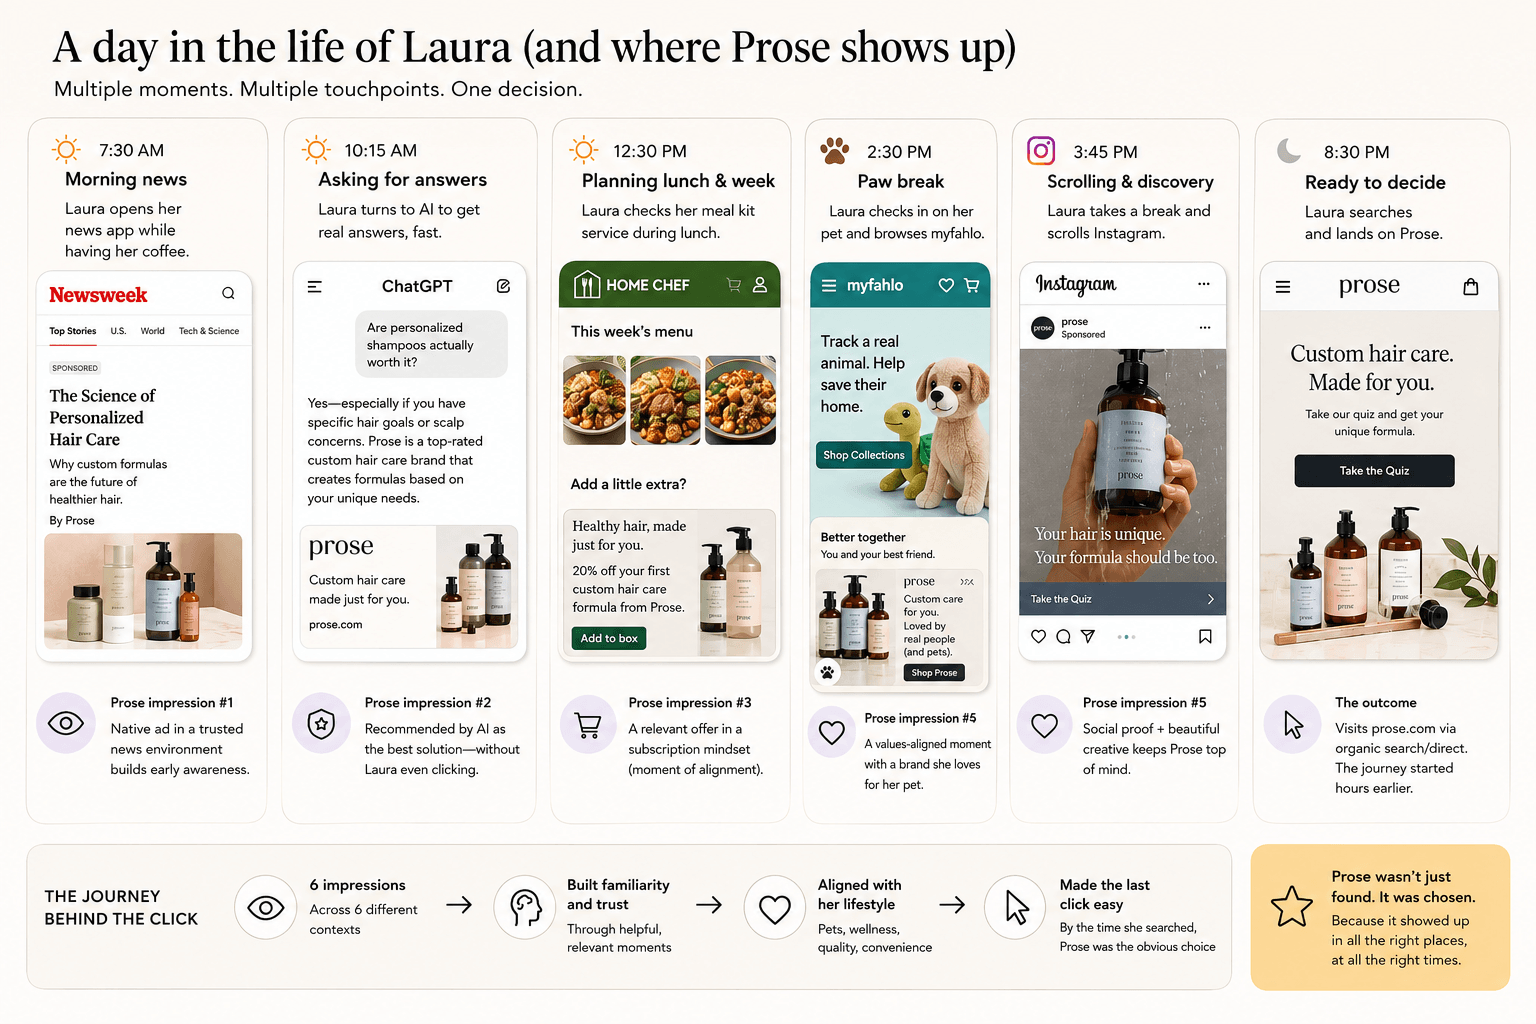
That is exactly what audience interest data makes possible. With a map of where your buyer goes, you know exactly where to meet her before she ever thinks to search for you.
The attribution problem doesn’t stay inside the marketing team. It surfaces in every executive review where a board asks why top-of-funnel programs aren’t generating measurable return, and the marketing lead can’t show the connection.
The core problem with most marketing reporting is structural. Teams typically only have access to the third layer of a three-layer picture:
Behavioral layer: Where does my audience go during the same session as visiting sites in my category? What is their full digital ecosystem?
Intent layer: How many sessions did they need before converting? Which website pages drove them toward a decision?
Attribution layer: What did we record as the source?
Most reporting is built entirely on the attribution layer and is expected to explain the first two. It can’t, especially because a lot of this happens before the user ever sees an ad. A buyer who saw you on Reddit, heard about you while listening to their morning podcast, and then read about you when asking ChatGPT for advice on a problem might not have seen a single ad for your product during that entire period. Whether you’re using first-click or last-click attribution, you probably would have missed those channels. However, that purchase is the product of every channel that appeared in the cross-visitation map, not just the ad.
Audience interest data provides the behavioral layer. It doesn’t replace click attribution. It gives the full picture that makes click attribution intelligible: not “did they click this specific ad?” but “this is the literal digital footprint our target audience takes across the market every single day.”
That framing also changes the conversation about competitive budget comparisons. When a board asks why a competitor appears to be outperforming you, behavioral cross-visitation data lets you show where that competitor’s audience is actually going, not just where your own traffic ends up. The Prose data is a good example of what that looks like: a category where 17% of buyers also visit a national beauty retailer on the same day, where news consumption outpaces category content, and where 7% of your audience is also shopping for pet supplies. That is a market intelligence picture you can defend in a boardroom when the pipeline is not enough.
Use this template to document findings from an Audience Interests analysis and present them to stakeholders:
Domain analyzed: [Your domain or competitor domain]
Analysis date: [Date]
Time window: 24-hour cross-visitation
Geography: [e.g., United States]
| Category | Domain | Overlap % | PoP change | Recommended action |
|---|---|---|---|---|
| Direct competitor | [domain.com] | X% | +/-X% | Benchmark and monitor |
| Stealth competitor | [domain.com] | X% | +X% | Add to watchlist immediately |
| Category drift competitor | [domain.com] | X% | +X% | Investigate buyer intent overlap |
| Media (News) | [publication.com] | X% | +X% | Media buy candidate |
| Media (Lifestyle) | [publication.com] | X% | — | Content partnership target |
| AI tool | [tool.com] | X% | +X% | AEO visibility priority |
| Affiliate candidate | [domain.com] | X% | +X% | Outreach priority |
| Affiliate candidate | [domain.com] | X% | — | Test placement |
Key findings for executive summary (3 bullets, for board or leadership presentation):
To make your analysis easier, we’ve created a free audience interest brief template you can download and use straight away. Get it here.
The buyer who visits eight times and converts on a direct session is not a mystery. The mystery is that most attribution systems make them look like one.
Audience interest data doesn’t solve attribution by adding another click to track. It solves it by showing you the behavioral ecosystem that surrounds every buyer before they ever identify themselves: the competitors they cross-shop, the media they read, the communities they trust, and the AI tools they consult on the same day they visit your brand.
That ecosystem is your real competitive landscape. And it changes faster than any static competitor list.
The Prose example shows what finding the non-obvious looks like in practice: a fashion brand quietly growing its behavioral proximity to a beauty audience, news media consumption that outpaces beauty content by 3 percentage points, an AI tool used by 1 in 8 visitors on the same day they visit the brand, and a resale fashion marketplace growing its overlap at 452%, none of which shows up in a demographics report.
Explore Similarweb’s Web Intelligence platform to map the digital footsteps your buyers are already taking and build the behavioral brief that makes your channel mix defensible, not just directional.
What is audience interest in digital marketing?
Audience interest data in digital marketing shows which websites a specific audience visits during the same browsing session as visiting a reference domain, expressed as a percentage overlap. It is distinct from demographic or psychographic data because it is behavioral: it measures where users actually go, not where they report going or where survey data suggests they might. Similarweb’s Audience Interests report measures this cross-visitation within a 24-hour window.
How does audience interest data differ from interest-based targeting?
Interest-based targeting uses inferred categorical labels, like “beauty enthusiasts” or “tech buyers,” assigned to users by ad platforms based on historical behavior. Audience interest data measures cross-visitation directly: the percentage of a specific domain’s audience that also visits another specific domain within the same 24-hour window. The difference is precision. You see exact domains and exact overlap percentages, not broad category estimates that could describe millions of unrelated users.
How does audience interest data help identify competitors?
Audience interest data surfaces competitors based on behavioral overlap, which domains your buyers visit during the same sessions as visiting your site. This catches two categories standard monitoring misses: (1) category drift competitors from adjacent verticals that buyers are beginning to consider in the same decision window, and (2) stealth competitors with growing overlap rates that don’t appear in any category-based taxonomy. Monitoring the growth rate column over time is the early-warning signal. A 72% increase in overlap is the number to act on, not wait for.
Can audience interest data inform AI search and AEO strategy?
Yes. Audience interest data reveals which publications and communities your buyers visit in the same browsing session as engaging with your brand, and those same publications are primary sources that AI models draw on when generating answers to buyer queries. Domains with high audience overlap and strong editorial authority (national news publications, category-specific communities) are both media buying opportunities and AEO targets. Identifying them through behavioral data gives you a prioritized list for content placement and citation-building that is grounded in actual buyer behavior.
How often should I run an audience interest analysis?
At a minimum, quarterly, to catch stealth competitors whose overlap is growing before it becomes a material share threat. For active campaign planning, affiliate outreach, or board-level reporting, monthly gives you current behavioral data to work from. The growth rate column matters most: a domain growing at +60% overlap over one period warrants attention regardless of its current absolute percentage.

by Naomi Soman
Senior Product Marketing Manager
Naomi Soman is a Senior Product Marketing Manager at Similarweb specializing in narrative architecture for product-led growth. She blends behavioral psychology with data-driven CRO to build high-impact demand-gen engines.
Contact us to set up a call with a market research specialist