B2B and Beyond: 6 Industry Benchmarks to Assess Your Site

Remember the king of bongo? This simple song carries a profound message about business benchmarking.
The song tells the story of a boy who is a celebrity in the jungle where he has no competition. But when he goes to the big city, the crowds don’t go crazy when he’s “banging on his boogie;” they hear those beats all the time. Had the young bongo player benchmarked the performance level of musicians in the city, he could have prevented his own failure. That’s how important benchmarking is.

In the world of B2B and beyond, website benchmarks can save you effort and money because they function as a guidepost. Relevant industry benchmarks help you make sure you’re on the right track. This article takes a close look at the B2B website traffic metrics you need to monitor and why. We’ll also provide the most relevant B2B website benchmarks for you to get started. Some of these benchmarks are useful for business-to-customer sites, so we will cover some of these sites as well.
How to get started with B2B website benchmarking
Business-to-business (also known as B2B) industry benchmarks tell you what’s standard in your niche. Armed with that knowledge, you can realistically assess your website performance and set goals. Industry B2B benchmarks are like red lines on your charts from which you mustn’t deviate too much.
The moment you start studying relevant website performance benchmarks for B2B, you’ll realize the significant variations between industries. We recommend looking at the big picture first and then drilling down into more specific areas.
You may want to compare niche benchmarks in different locations and look at adjacent, related industry sectors to get an accurate picture of the competitive landscape.
Another thing to keep in mind: check b2b website metrics that provide you with actionable insights. Don’t settle for vanity metrics to present to your stakeholders, even though that’s what they may request. Stay a step ahead and work with the metrics that really matter.

How are B2B website benchmarks unique?
We all know B2B and B2C aren’t the same when it comes to marketing. Each has its quirks. But what implications does that have on analytics? How should you look at B2B website metrics?
Let’s recount what B2B companies have in common that makes them different from B2C businesses. Most significantly, the buyer on the other side of the computer screen is equipped with a business mindset. B2B buyer personas focus on the solution you offer and how it fits their business structure and existing technologies. They’re generally looking to make large purchases that often have a broad organizational impact.
Several parties are involved, and the end-user isn’t necessarily the one who makes the final decision. Instead, they rely on the consent of various stakeholders and decision-makers in the company. Naturally, the purchase process takes longer and involves multiple touchpoints.
How content marketing fits into the process
This brings us to content marketing. Most B2B companies engage in this type of inbound marketing. A good Content marketing strategy involves a mix of marketing channels and content types that target different pain points at different funnel stages. A good B2B content marketing strategy allows you to reach various individuals with other priorities in the same company.
While the project manager could be interested in a project management tool to gain efficiency, the IT manager may be concerned about integration and security issues. The purchasing manager, on the other hand, has a budget to keep and several software requests on her table.
Your inbound content marketing needs to address all these concerns to close the deal. A CMI report breaks down the main goals content marketers achieved in 2020. The major objectives: educate your audience, raise brand awareness, engage your audience, and create credibility and trust. Lead generation and lead nurturing were also among the top-ranking achievements.
Using these goals, you can select representative KPIs and start monitoring and benchmarking the relevant website metrics.
Click below to learn how to benchmark against your competitors with Similarweb
Personal info
Which B2B website metrics should you focus on and why?
1. Unique Visitors
Unique visitors show the number of people who visit your site during a set period. Within that defined time, each visitor is counted only once.
The metric is useful in many ways. It helps you:
- Gauge growth in new visitor numbers
- Measure a brand’s reach
- Quantify the impact of a campaign
- Assess the exposure of a piece of content
It also functions as a starting point to dig deeper into user engagement metrics. You want to inspect how visitors behave, how they interact with your site, how many pages they view, and how much time they spend. The unique visitors metric lets you identify the percentage of new visitors compared to the number of returning visitors.
A high number of unique visitors shows that you are attracting a large number of users. This is a good sign for your marketing, but is it good enough to expand your market share? That’s where B2B industry benchmarks can help.
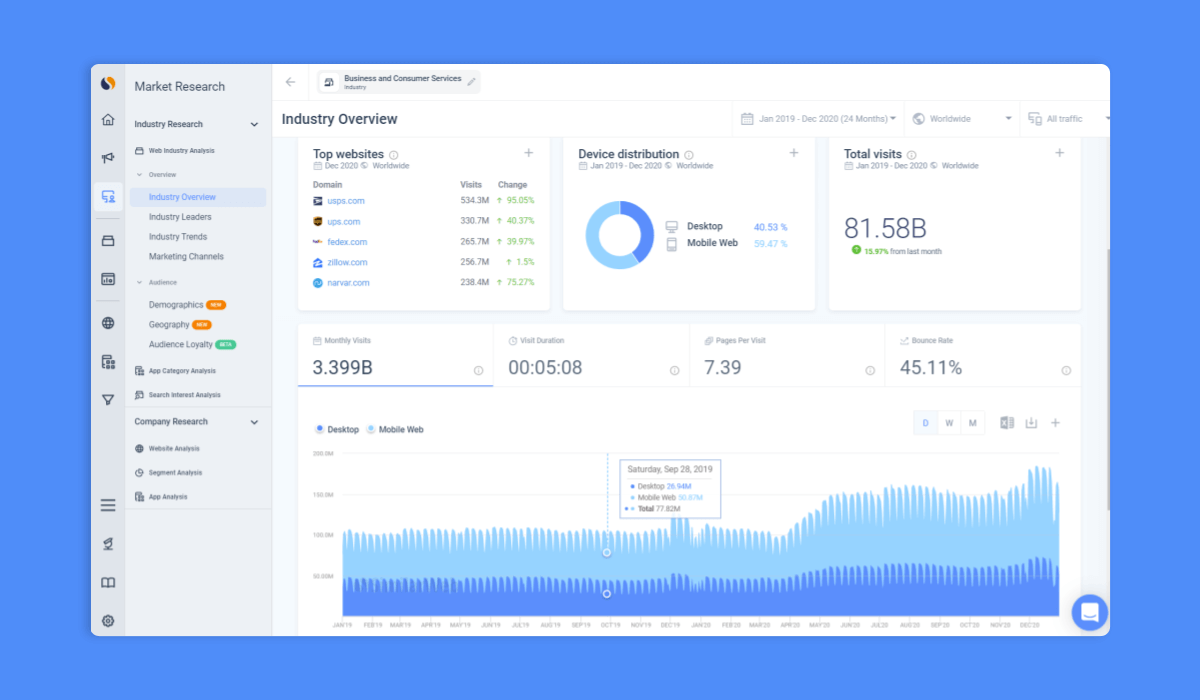
Top 10 worldwide B2B websites (by market share)
A look at the stats quickly helps you understand just how industry-specific the metric is. The ten top positions are occupied by either tracking or real-estate-related sites. Visitor intention and behavior here are different from most other industries. Visitors return frequently to get the latest updates, so it makes sense the average monthly visits are higher.
When we compare sectors, the differences between industries become even more evident.
Below are average unique visitors for Business and Consumer Services sites broken down by sectors across key markets: United States, United Kingdom, Germany, France, and Japan.
2. Pages/Visits
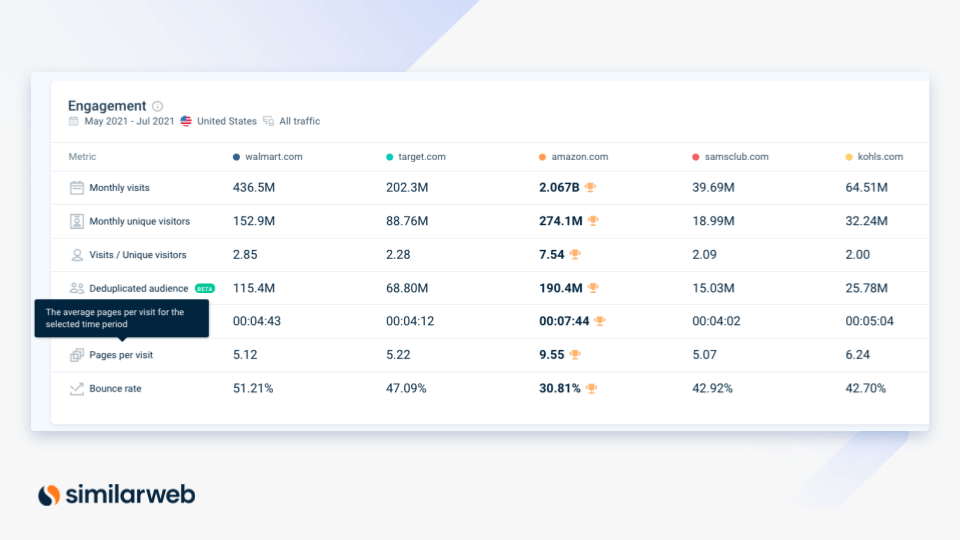
Now you know the number of new visitors, which is a suggestive measure of marketing success. But how interested are they? The average pages per visit (Pages/Visits) metric is a step toward understanding the level of visitor engagement. This metric displays how many pages a visitor views on average in one day.
This metric is critical when assessing your content marketing. You don’t expect your visitors to convert right away. On the contrary, your site is designed for them to spend time, consume content, get educated, and engage. Your goal is for visitors to view at least two pages, but preferably more.

A low number of Pages/Visits can indicate that:
- There is a mismatch between visitor expectations and site content
- You are not attracting the right users
- Navigation to the next step is not clear
- The content is not engaging or compelling
- Your site has technical issues
What is a good Pages/Visits ratio?
An exceptionally high number of pages visited in a short time can also be a warning sign. People are zapping through your site in search of something they can’t find. They could also be confused about how to get where they want to go.
To gauge what’s a good number, you’ll want to benchmark against the average in your industry sector.
3. Average Visit Duration
This popular website metric – also known as average session duration – is another indicator of user engagement rate and content quality. Longer visit duration shows people found your content engaging. Ideally, you want your visitors to move from page to page and remain long enough on each to absorb the content.
A short visit duration usually indicates the content is not compelling or not relevant enough. You could also be dealing with technical issues.
According to Databox, B2B sites can expect an average visit duration of two to three minutes. However, the average in your specific category could be quite different.
Similarweb’s official benchmarks for various B2B industries:
4. Bounce Rate
The bounce rate shows the percentage of visitors to your site who left without interacting. They did not click on any links, watch a movie, or view another page. These visitors came, saw, and left.
This is obviously not what you aim for. Either the visitor expected to find something else, they didn’t understand where they arrived or found what they were looking for right away. In any case, your content didn’t fulfill its purpose of drawing the visitor in and engaging them. A healthy bounce rate says something about the quality of your content.
Overall, average bounce rates for B2B websites are around 45%-55%, but they can also be anywhere between 20%-70%. See where your industry level falls:
5. Marketing Channels
When it comes to marketing channels, you need to go where your prospects hang out. The best way to discover the most effective marketing channels for your business is by finding out what works for the competition.
To target the various stakeholders, B2B companies use a mix of marketing channels to distribute content. How this mix is compiled depends on the industry and the audience. After you’ve identified the popular acquisition channels in your industry, check which channels are driving website traffic to your competitors.
What are some important traffic channels for B2B?
Organic search traffic counts the visitors who discovered your site through a search query. A strong search engine optimization (SEO) strategy drives organic traffic and is the backbone of content marketing. Content that is optimized for search engines can be found easily and will bring in more relevant traffic to your site. Compare your organic traffic share to the industry average.
Direct traffic includes visitors who typed your URL into the search bar, had your page bookmarked, or arrived via an unidentified path. The latter makes it a tricky metric because it’s not clear how people found you. Also, there’s no marketing channel that your marketing team can leverage associated with direct traffic. It’s useful to know how much direct traffic is considered average in your business area.
Referral traffic displays the traffic coming from a link on another site. Referral traffic includes affiliate marketing, native advertising, and other third-party marketing methods. Some industries rely heavily on referral marketing. Benchmarking reveals how impactful referral marketing could be for your business.

Social media traffic is becoming increasingly important for digital marketing and advertising as social media platforms surge in popularity. They provide a considerable amount of traffic to B2B sites. But each target audience has its preferred platform. Additionally, consumers use different social media networks for different purposes. You want to investigate which networks are relevant for your industry type. Then get data on how much website traffic companies typically receive through social media.
Paid search traffic plays a vital role in generating traffic. Industries with high competition often rely on Pay-Per-Click (PPC) campaigns to draw in the right searchers to their site. In such industries, PPC is more effective than SEO, which is tough because high-authority sites are at an advantage.
But paid search isn’t only relevant for highly competitive landscapes. It’s an important channel for companies who are entering the market. Besides, you have a marketing budget to calculate, and paid search is a significant factor. That’s a good reason to get insights on what’s the standard for your business type.
Display ads traffic shows the traffic that arrives when someone clicks on a banner ad you placed on a display ad network. Banner ads placed in strategic locations can bring high-quality traffic to B2B companies. It’s important to inspect the effectiveness of display ads for similar companies and the role they play in their digital marketing strategy.
Email traffic is still one of the most efficient channels for B2B marketers. Email campaigns are mostly used to nurture leads and become increasingly valuable towards the bottom of the eCommerce conversion funnel. Check the average share of email marketing traffic out of the overall traffic, and make sure its optimization and conversation rates are part of your content marketing strategy.
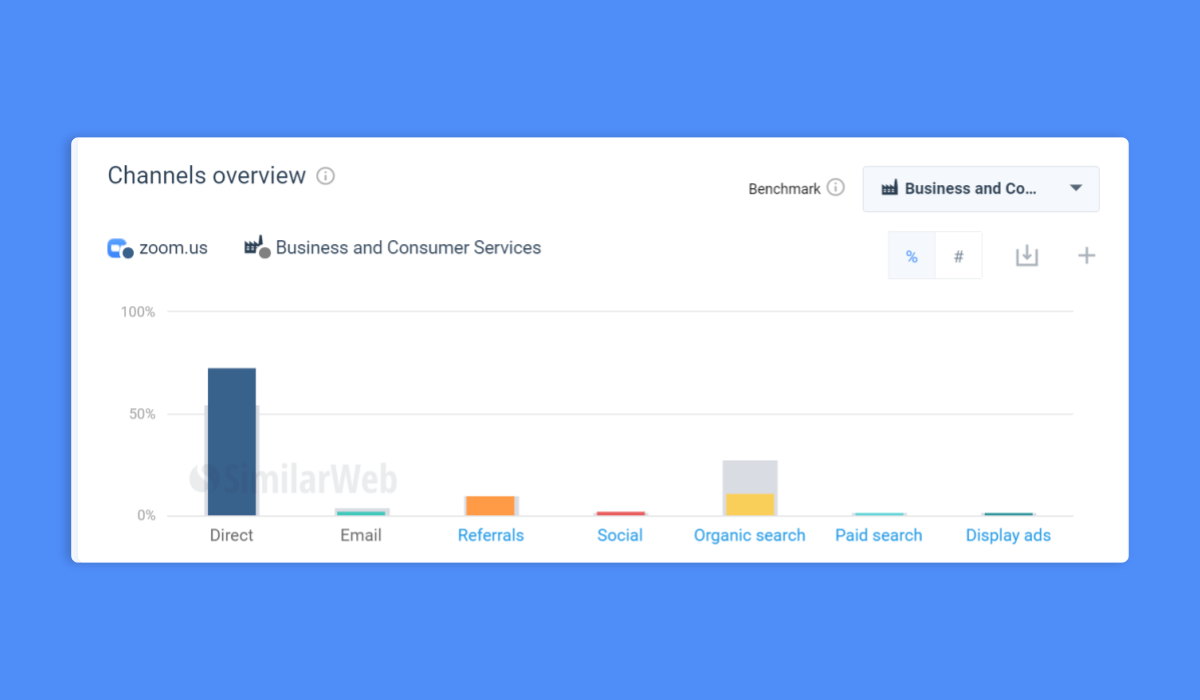
See how much traffic the various channels generate to B2B websites and landing pages in your niche. Also, look at traffic distribution across channels and understand the typical market breakdown in your industry.
6. Desktop vs. Mobile Split
We all know that mobile use is increasing. Does this mean you should focus entirely on making your homepage mobile-friendly and forget about desktop users? Not so fast. Mobile use is only gradually expanding, and chances are desktops aren’t going to disappear any time soon.
Make sure your B2B marketing campaigns perform well on both and keep your finger on the pulse of the market. Some industries see a faster-growing number of mobile users than others, and in some spaces, desktop traffic is still dominating.
Get your B2B industry benchmarks and start fine-tuning your marketing efforts. Below are key benchmarks for device splits: top 25, top 100, and top 1,000 B2B websites, worldwide.
Next Step: Benchmark your success
You felt sorry for the king of bongo without a crown, didn’t you? No one wants to be in his place. Luckily, you’re not in the jungle. You don’t just grab your business-bongo and expect huge success wherever you go. You can prepare for what’s ahead because you can access B2B website benchmarks and related data.
Start with the numbers in this post and use Similarweb’s analytics data to benchmark against the industry and your competitors. Register a free Similarweb account or contact us for a free demo to learn more.
This blog post was written with Ruth M. Trucks.
FAQ
What is B2B business benchmarking?
B2B business benchmarking is the process of telling you what’s standard in your niche.
How should I conduct B2B business benchmarking?
Focus on specific metrics including unique visitors, pages/visits, and bounce rate.
What is the average visit duration?
Also known as session duration, the average visit duration is another important indicator of user engagement rate and content quality.
Benchmark like a boss with fresh competitive data
Contact us to set up a call with a market research specialist


