





The Top 100 Most Visited Websites in the USA (August 2026)
by Shai Belinsky10 Min.
Sep 29, 2026
 Research Intelligence
Website demographics are like the ABC’s of audience analysis. They’re the first step in understanding who’s actually buying your product or why they’re visiting your website. If done right, demographics form the basis of your entire digital research strategy.
No pressure right? Read on and we’ll show you how to create an audience analysis that’s as strong as it is sustainable.
Track and Grow Your Audience
Learn how to use consumer behavior and audience demographics to your advantage

Understanding website demographics such as location, age, and gender of customers is the cornerstone of defining your target audience. Get them wrong and your entire analysis is distorted.
Traditionally, demographics is the study and statistical recording of a population. in a given area. With website demographics, the location is your website and the subject group is your users.
Demographics of physical locations often focus on socioeconomic information, such as education, income level, family size, and more. This data is useful in urban planning, government and company policies, and, of course, in marketing. If you offered home insurance, for instance, you’d be interested in the percentage of homeowners in specific areas. Healthcare providers, on the other hand, might look at birth and death rates.
Standard site demographics also include marketing channels, devices, interests, and purchase behavior. Add whatever is relevant in your industry and for your business goals.
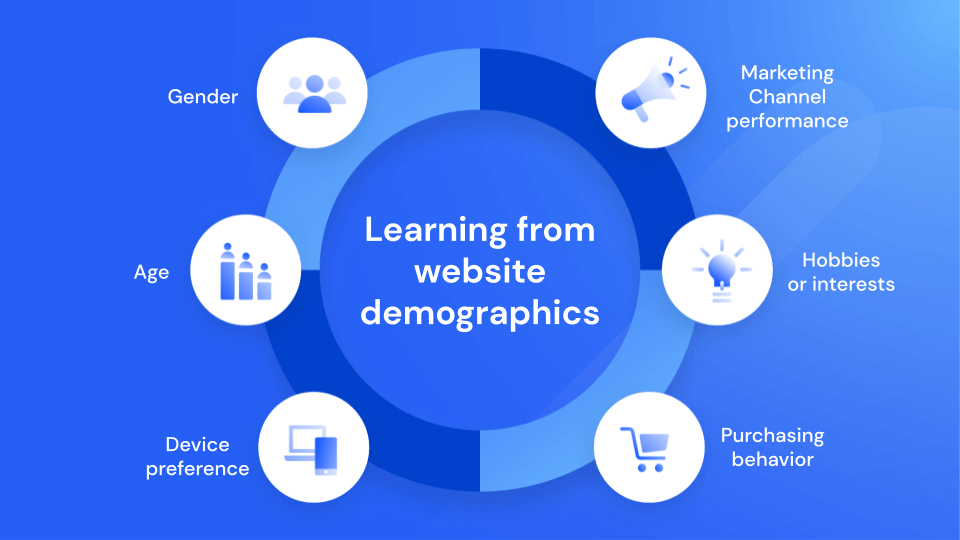
There are a variety of ways you can segment your market and endless ways to group or define your audience. Take a look at some of the most important information to collect when starting your demographic audience analysis:
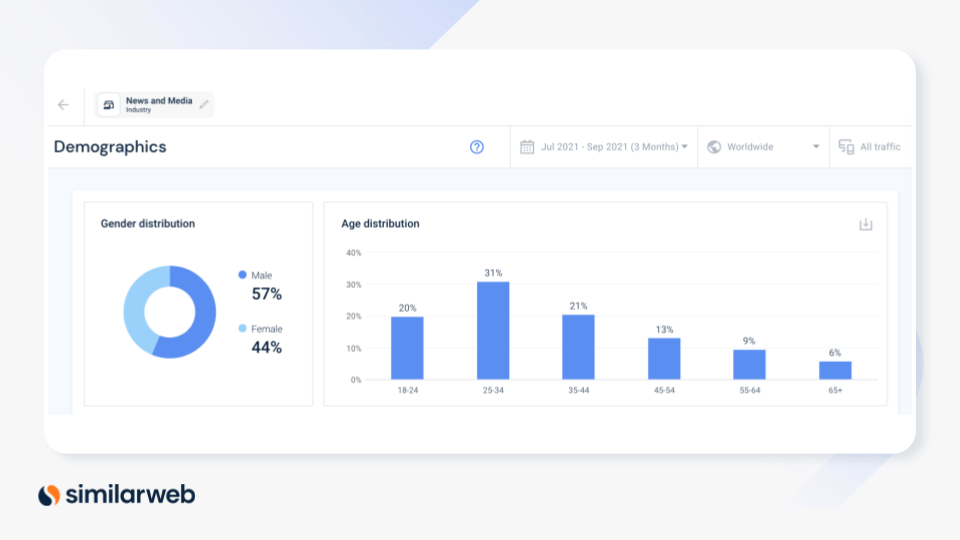
Similarweb Digital Research Intelligence shows that males between the ages of 25-34 are the largest audience for News and Media.
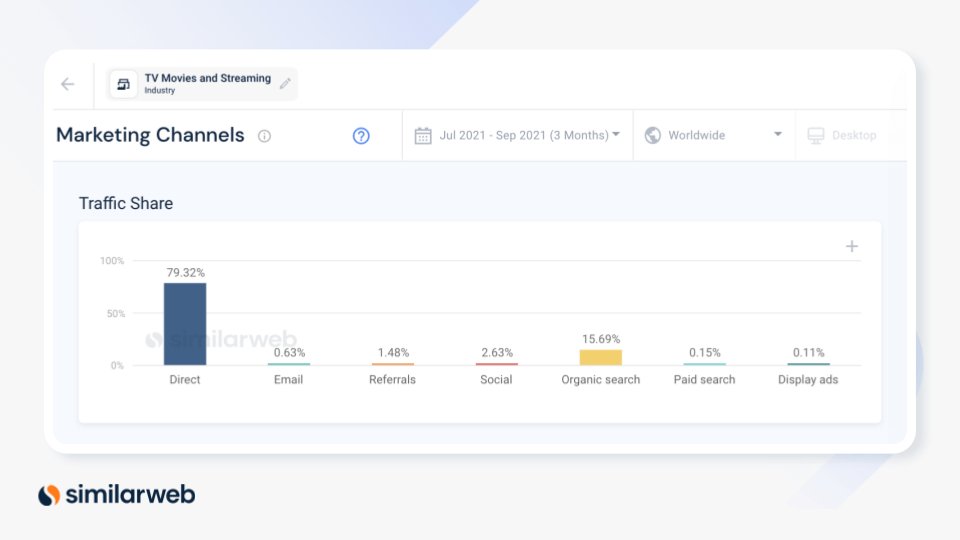
Similarweb Digital Research Intelligence gives you the possibility to compare your website demographics with similar sites and competitors.
Now that we know what they’re good for, let’s see how website demographic tools help you understand the data and ultimately, further illuminate your audience.
Google Analytics provides several standards and customized demographics reports. To receive them, you simply enable advertising, demographics, and interest reports, and define the pages you want Google to track. On social media platforms such as Facebook and Instagram, demographic information is available with business accounts. On LinkedIn, site demographics are available as a free reporting tool. Score!
With Similarweb audience insights tools, you can define and analyze any domain – it doesn’t have to be your own. You’ll get a breakdown of age, gender, and geography for whichever website you’re looking at. You can also analyze by industry or across different time periods to see if there’s been a significant shift in your audience over the years. Double, triple, and quadruple score!
Let’s look at some common statistics and analyze what they tell us.
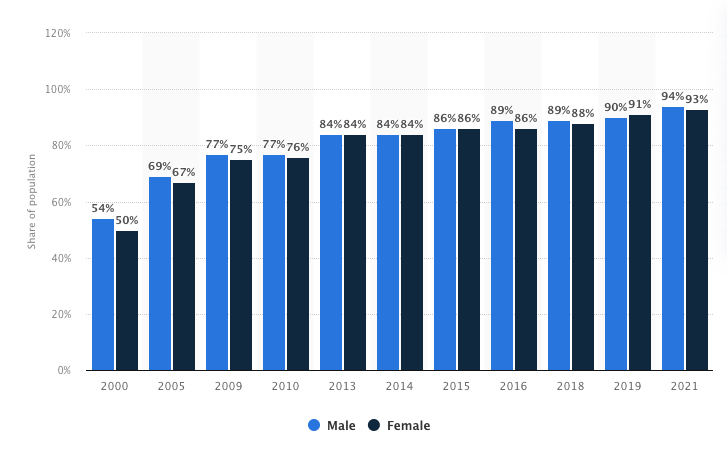
According to research, more men use the internet than women, although the difference isn’t significant.
Statistics from April 2021 show that 94% of adult men and 93% of adult women in the U.S. use the internet. That’s a 4% and 2% rise respectively compared to the previously measured period. 2019 was the only time period that women used the internet more than men.
You can see these stats also reflected in Similarweb’s findings, which depicts gender distribution across all websites worldwide. Of all internet users, 58% are male, and 42% female.
Your turn: how do your stats stack up with the average?
Fun fact: the number of men on the internet may be higher, but it seems women have stronger engagement rates—at least on social media. Hootsuite found that women comment significantly more on Facebook than men. In some age groups, women comment twice as much as men. Interestingly, while men in all age groups share the same level of engagement, women between 45-54 are the most engaged and women between 18-34 are the least. Sounds like a great topic of discussion for your next dinner party, doesn’t it?
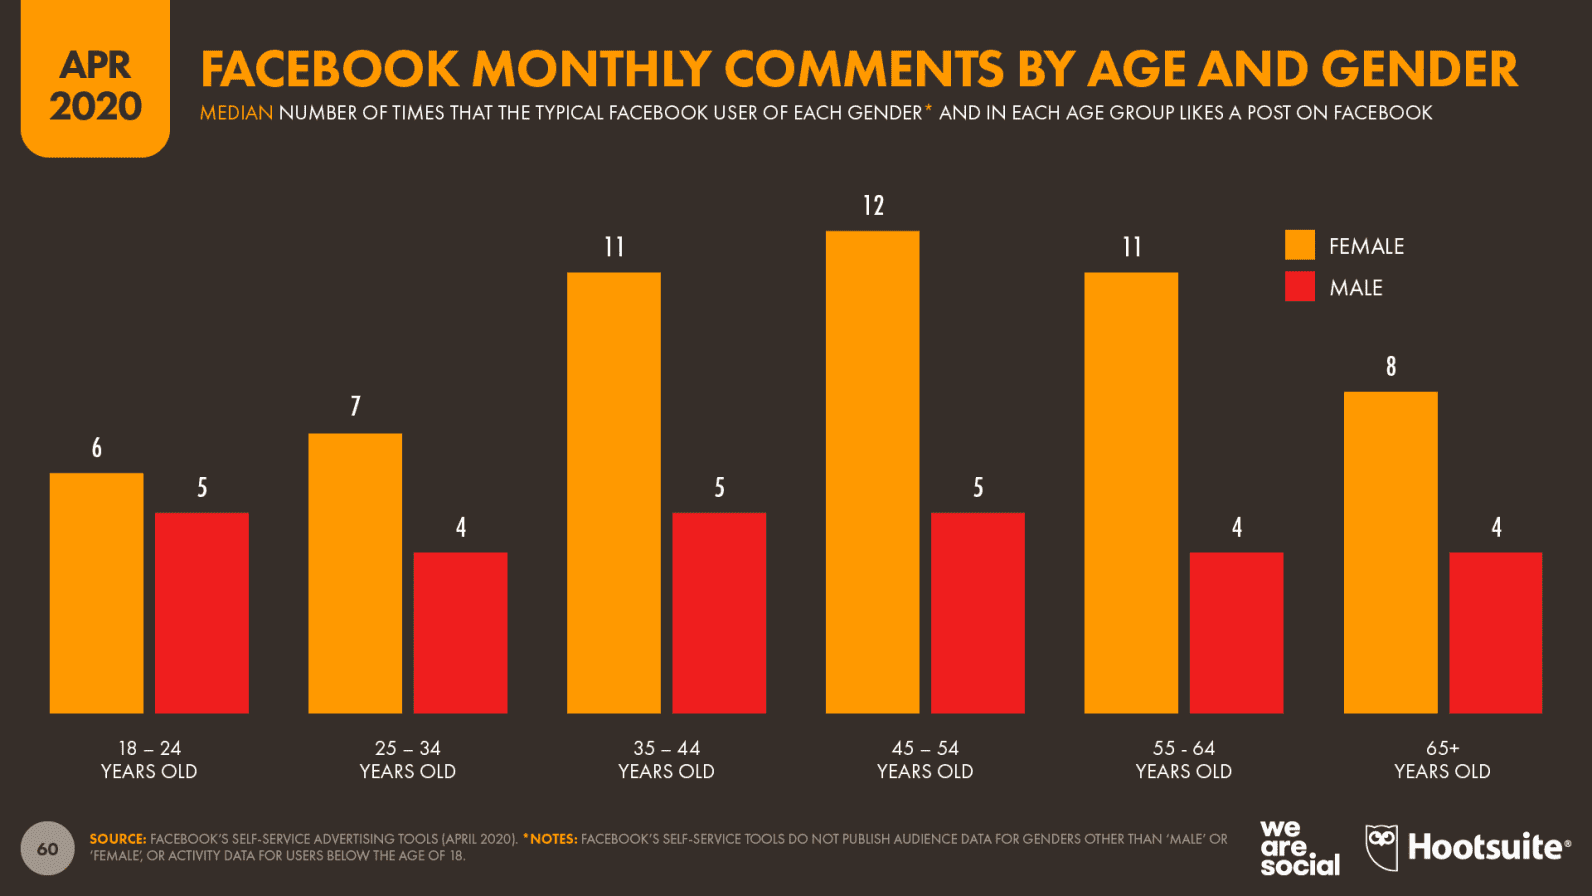
Women are also 40% more likely to create groups on Facebook, and 70% of all fundraisers on the site are started by women.
Let’s look at how gender distribution pans out per industry. Below, you can see the website demographics for several popular markets. Men are more active in all but one: Travel & Tourism.
Keep in mind these are category averages. Not all companies in the category have this distribution and you need to pick your niche and benchmark against that. The best way to do that is by benchmarking against specific competitors with a similar offering and the same target audience.
The type of device your audience uses to access your site determines how they experience it. The table below shows the variance of mobile and desktop users per industry. While mobile usage is generally on the rise, in isolated categories such as Games and Arts & Entertainment, visitors clearly prefer desktop.
We can see just how important mobile has become when we look at device split from last year. We see a 4-5% shift from desktop to mobile use in all categories. Exceptions are Entertainment, where the split remains unchanged, and Gaming, where there’s only a 2% shift towards mobile compared to the same period last year.
You also want to consider the route customers take to reach your site. Understanding how likely you will or won’t get traffic through a specific marketing channel – such as organic search or PPC ads – helps you determine which to double down on.
Globally, age distribution shows that over half of all internet users are between 18-34 years old. From there, the numbers decline with age.
By looking at how age groups are distributed across industries, you can get a sense of what people in different stages of their life are looking for online. 25-34 is the most common age group for four key industries: eCommerce and Shopping (31%), Arts & Entertainment (32%), Business & Consumer Services (29%), and News & Media (31%). This means that you should have content that addresses the needs and preferences of this age group, and even more so on the pages where they’re frequenting most. Knowledge truly is power.
Another age group worth observing is 18-24-year-olds. Here we see the most significant data variances per industry. Try scoping out how popular your niche is with this set first before pitching only sites that would attract them based on your investigation.
After you’ve analyzed the data from your website demographics tools, it’s time to put it to use. Here are three essential steps everyone should take to reach their target audience.
The topics you address, the language you use, and the images you display need to address your primary demographic. Not sure where to start? Have a look at competitors’ websites to see how they’re speaking to their audience – mimicking strategies that are proven to work will help increase traffic to your website.
If millennials make up the bulk of your users, make sure to address their pain points, whether it’s financial worries, social pressures, or the plight against climate change. Research now, resonate later.
You can also choose images and language that resonate with the primary gender of your audience. On average, men are more interested in tech-related content, for example, while women engage more with recreational content. But be careful not to jump to conclusions too quickly because tendencies fluctuate. Check demographic stats in your industry and see what the competition is doing to determine your best approach.

So if you sell a product primarily used by women, but the percentage of male visitors to your website is high, you’ll want to understand why. For example, men may be looking for gift ideas for a loved one. Use Similarweb to find out if this is normal in your market. If not, check the content of sites ranking higher with women and adapt yours accordingly. Otherwise, include content that targets men directly.
Follow events and news relevant to a specific gender or age group to optimize your marketing spend accordingly. For example, using the Similarweb Keyword Generator Tool, you can look for long-tail, high-intent keywords worth bidding on.
Social media is highly age-specific. It’s vital to understand where the different age groups socialize so you can determine which platforms to include in your marketing mix:
Where else does your audience spend time? Determine your website category and find out which type of content your audience consumes when they’re not on your site. For example:
To dig even deeper into the inner workings of your industry, view the demographic makeup of your main competitors’ audiences using Similarweb.
Digital intelligence gives you the power to not only monitor your web demographics but also characterize your audience.
You can take your audience analysis a step further with Similarweb by comparing the industry average and benchmarking against the competition. Discover areas where you’re at an advantage and leverage them, while at the same time optimizing markets where you may be underperforming.
To learn more about the specific website demographics in your industry, set up a live demo with one of Similarweb’s product experts.
What are website demographics and how important are they?
Website demographics is the study and statistical recording of a population, and the cornerstone of defining your target audience.
Who is the target audience of a website?
The target audience is the specific group of consumers most likely to want your product or service. Traditionally, demographics is the study and statistical recording of a population. in a given area. With website demographics, the location is your website and the subject group is your users.

Principal Product Marketing Manager
Daniel brings 10+ years of marketing experience, specializing in both B2B and B2C audiences. He thrives at managing delivery of projects, consistently developing concepts that drive impact.
The Top 100 Most Visited Websites in the USA (August 2026)

Similarweb Named in Forrester's Answer Engine Optimization Technologies Landscape, Q3 2026

Anthropic IPO: What Claude's Web and App Data Show
Contact us to set up a call with a market research specialist
