This white paper was written in 2018. Now you can access the full report here for free.
Looking for the latest data? Try Similarweb now.
Introduction
Digital market intelligence is changing the way businesses grow market share by driving new and creative approaches to strategy, marketing, and sales – redefining the way market research is approached and executed.
It can also provide invaluable support for investors seeking to identify potential investment targets and evaluate IPO candidates.
Similarweb’s digital market intelligence suite provides vital tools for investors to:
- Monitor Your Portfolio
- Analyze Any Market
- Discover Potential Investments
- Conduct Due Diligence
Here we look at three real-world examples where these tools could have offered actionable insights for investors to alleviate their pain points.
What we’ll cover
1. Monitor your portfolio: Walmart’s early signals
2. Analyze any market: Amazon buys Whole Foods
3. Conduct due diligence: Blue Apron’s IPO

Monitor your portfolio
Walmart’s daily signals
In today’s digital world, companies should be aware that digital market intelligence is making their performance increasingly transparent to investors.
Every day there is a huge volume of data generated by consumers searching, browsing, and making purchases online. Every day, every minute, every second, vast amounts of information are created about how many customers are visiting a website, what they are looking for, and ultimately what they are buying. So why is it that in a world in which data is gathered continuously, investors are making decisions based on annual, quarterly, or ad hoc reports or interim presentations, made public by self-interested companies?
Digital market intelligence can empower investors with these kinds of insights. Information that companies try hard to keep out of public markets, is now readily available. Furthermore, getting access to this kind of data is now financially viable and it doesn’t have to come in the format of one-off market research reports.
Walmart.com spotting the upside
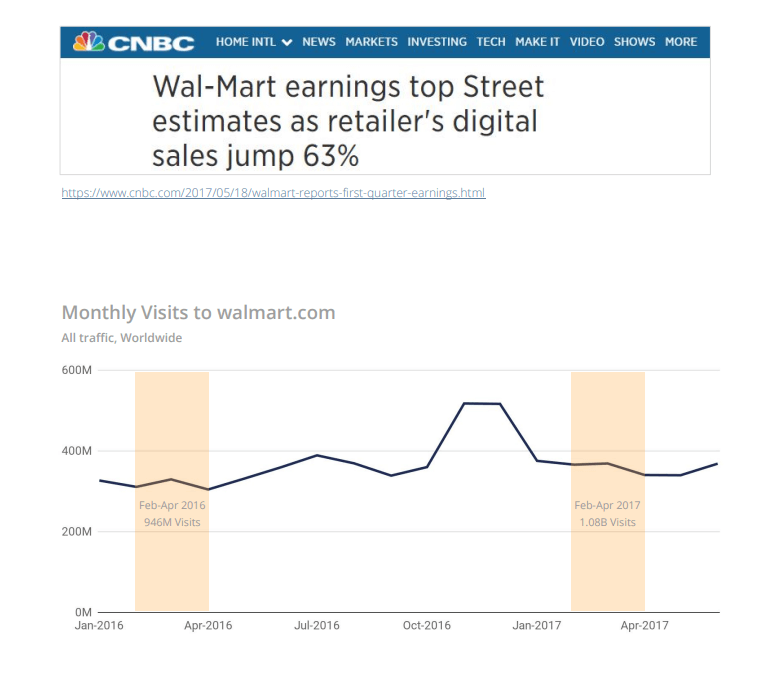
On May 17, 2017, Walmart released its FY2018 Q1 earnings (Feb-Apr 2017). It was announced that e-commerce sales had increased by 63% and overall US sales were up 2.9%. Note, however, that May 17 comes 17 days after the close of the quarter, and 106 operational days since its start. This is a long time for markets to go without the oversight of business performance.
The chart to the right shows monthly visits for walmart.com, with a 14% growth in traffic in FebApr 2017 compared to the same period in 2016. As far back as March 2017, Similarweb data would have revealed the potential strength of this financial quarter, further confirmed in April, providing insights to investors into how Walmart’s online strategy was paying off, long before the quarterly earnings report delivered similar news in mid-May.
So, what’s next?
Investors now have access to vast quantities of data that never was previously available to them. They are able to identify trends and sales performance before they are officially reported. Furthermore, this type of analysis is no longer limited to just quantitative analysts. So, what does this mean going forward?
As companies become increasingly digital, then why should the way that they are analyzed not become increasingly digital? Today, constant streams of data are available allowing investors to discover insights like never before and to anticipate news before it is officially reported to the market. The investment industry is ripe for digital disruption.
Takeaways
1. Companies with any digital footprint, need to start being mindful that financial markets have increased visibility over their performance
2. Investors see the value of spotting digital trends as they happen and incorporate this into their existing financial analysis
3. The publication of official statistics can be increasingly preempted by tracking digital trends
Click below to learn how to create a winning marketing strategy
Analyze any market
Amazon buys Whole Foods
Amazon has once again disrupted a market, taking on grocery shopping in the US. But how did they identify the digital strengths of the different players in this space and start to understand the industry?
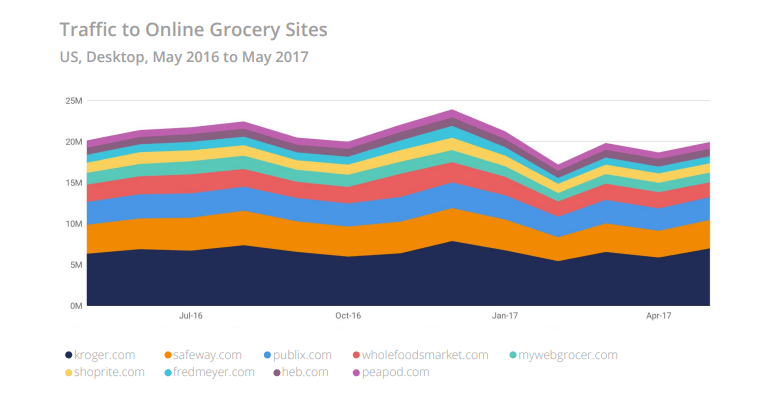
In the $675B US grocery industry, online shopping is still not widespread accounting for less than 3% of all grocery sales. Similarweb’s data shows a parallel trend. In the past year, desktop traffic to the top 10 grocery sites increased by only 2%.
Where specific players have seen traffic increases, they have been at the expense of traffic to competitors rather than an expansion of the entire market. Engagement stats also indicate a stagnant market with very slight improvements: bounce rates improved by 4%, pages per visit by 4%, and visit duration remained even.
Key Players
To understand how Whole Foods became a target for Amazon, it’s worth looking at its digital performance in the context of its online grocery competitors.
Kroger.com
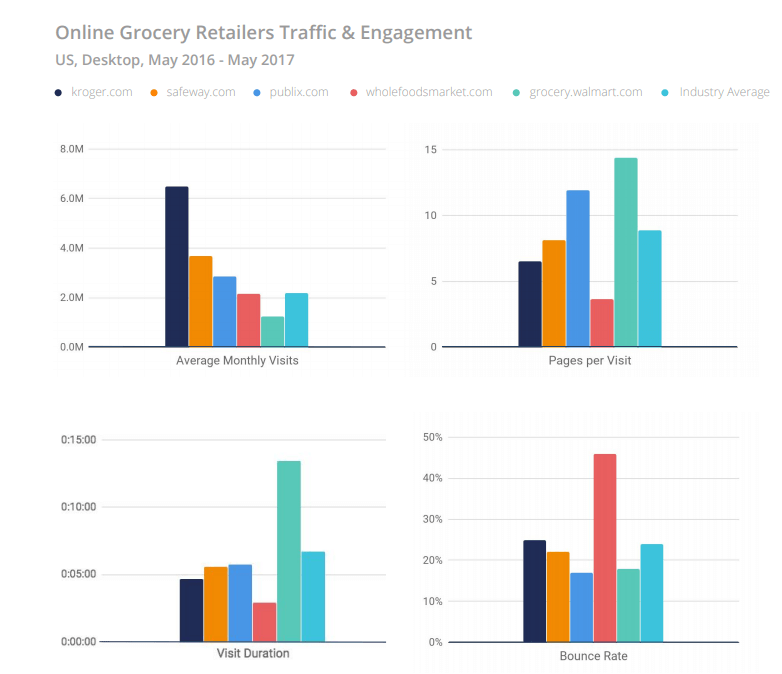
While kroger.com gets the largest volume of traffic, the site struggles to maintain an engaged audience.
While bounce rates are comparable to the rest of the industry, the number of pages per visit to kroger.com is 26% below the industry average. Furthermore, the average visit duration is two minutes shorter than the competition. These factors indicate a weakening in consumer engagement, which may have contributed to their recent drop in stock price.
Grocery.walmart.com
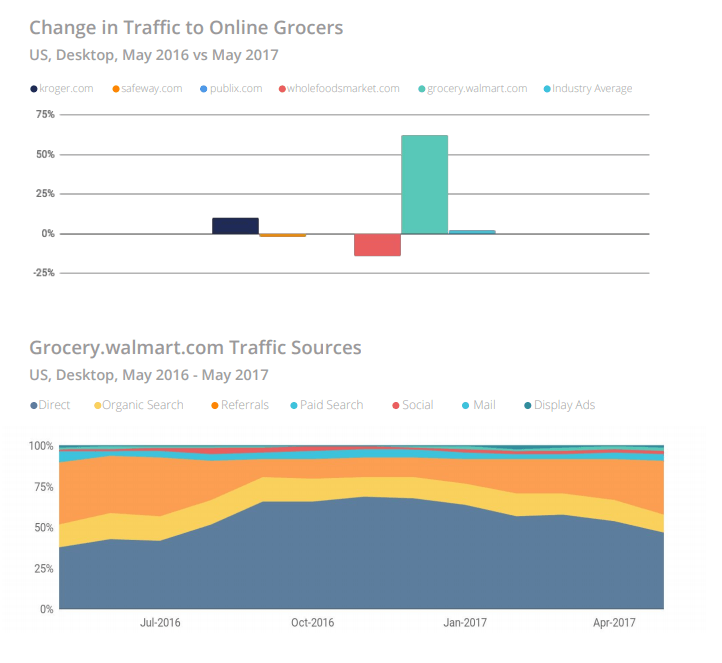
Over the past year, the subdomain grocery.walmart.com has outperformed the competition by growing its traffic. Where industry traffic grew only marginally, the site’s traffic increased by 62%, pushing itself from the #7 spot in May 2016 to the #5 spot, within a hair of wholefoodsmarket.com. The most significant change in traffic started in July 2016, with continued improvements since.
The site, groceries.walmart.com is also winning in engagement, outperforming the remaining players – with a 25% lower bounce rate than the industry benchmark, 5.5 more pages per visit, and 2.3x more time spent on the site than its nearest competitor in the top 10.
Traffic sources help to illustrate which strategies have been successful in improving performance. Starting in July 2016, and continuing through the Fall, we see a significant increase in direct traffic, indicating that Walmart may have been using its substantial offline presence to direct customers to its online grocery site.
Wholefoods.com
Maintaining its place as the fourth most visited grocery shopping site, wholefoodsmarket.com’s traffic has dipped by 16% over the past year. Additionally, wholefoodsmarket.com has the highest bounce rate in the industry at 46% – nearly twice the average of the top ten grocery sites. It also has the lowest number of pageviews per visit – less than half that of the top 10 average, with audiences spending the least time on the site – 3.8 minutes less than the top 10 average.
While 60% of the site’s traffic comes from organic search (the highest in the top ten), this is fueled by branded keywords, most of which are related to store locations and career opportunities. Only one of the top ten keywords sending traffic to wholefoodsmarket.com is related to grocery deliveries.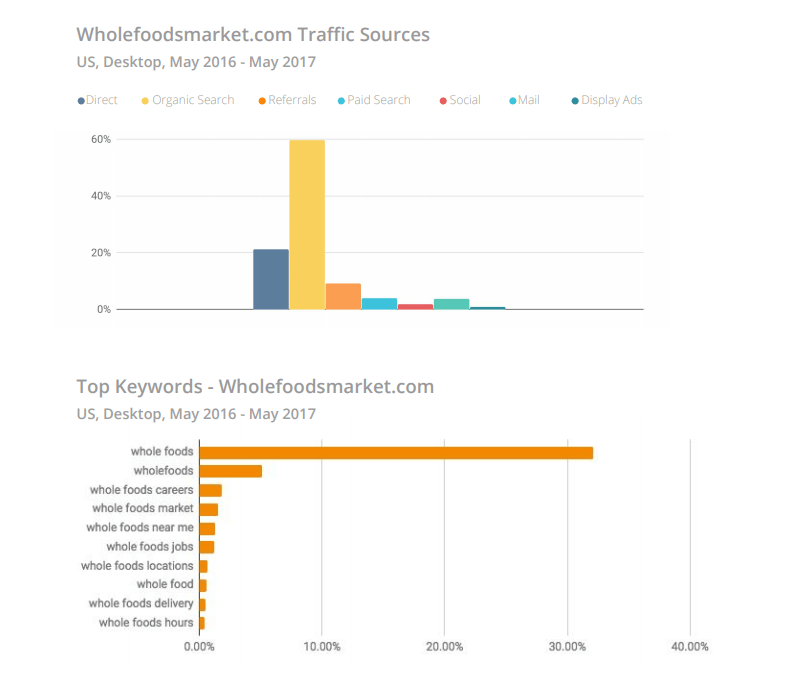
Takeaways
So why did Amazon choose this brand with which to move in the online grocery market? It would appear that this decision was led not just by the brand’s digital presence, but rather by the brand’s DNA.
Whole Foods Market offers Amazon something new – the perception of a quality brand, and a unique offline shopping experience. Coupled with Amazon’s distribution network and the promise of a good deal, this could be the disruptive force that will jolt this slow industry into action, while promising Walmart formidable competition on price, quality, and distribution.
The combination of Amazon’s digital dominance and distribution, with Whole Foods Market’s reputation for quality, commitment to the environment, and all-around hipster appeal should be potent enough to concern all online grocery retailers.
As Whole Foods shareholders approved the takeover in late August 2017, shares in other online retailers tumbled as Amazon revealed its plans for “lower prices, special savings, and in-store benefits”.
Conduct due diligence
Blue Apron’s IPO
Blue Apron’s IPO filing sparked interest in the already popular meal delivery or meal kit industry. Similarweb took a look at recent trends related to the pioneer meal kit provider, as well as its most prominent competitors in the projected $4 billion industry.
Seasonality
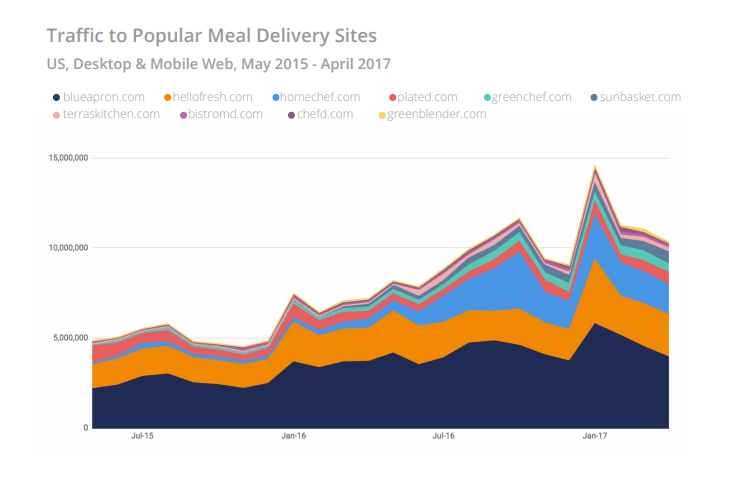
The announcement about Blue Apron’s IPO indicated that the meal kit industry was experiencing significant growth, with traffic increasing by 116% over the past two years, up from 4.9M visitors in May 2015 to 10.6M in April 2017. All brands saw a significant increase in traffic during January 2017, showing a seasonal upwards trend during the first quarter of the year.
Engagement
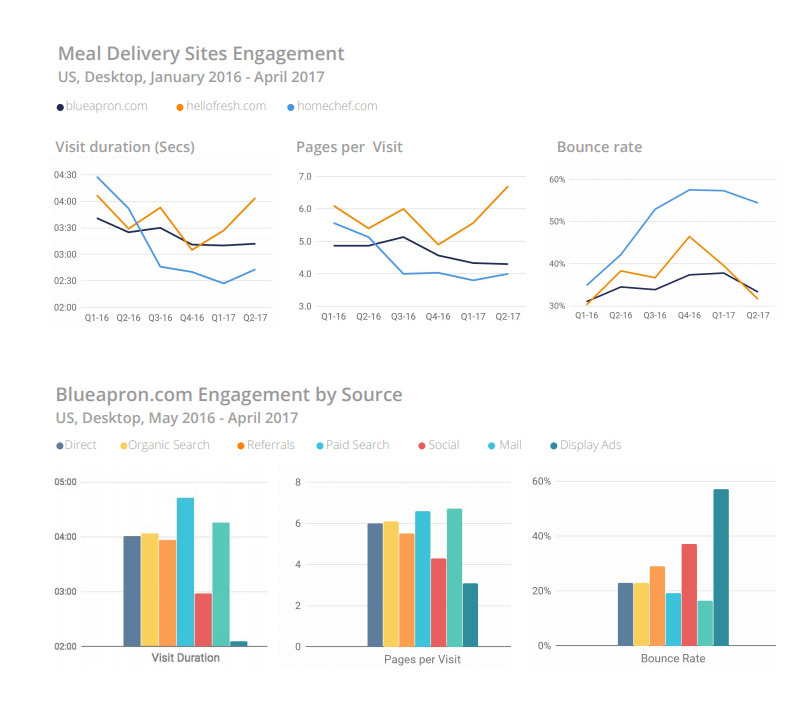
While traffic to blueapron.com was high and rising, its engagement stats told a different story. Comparing data from February-April 2017 to the same period in 2016, showed a 12% drop in average visit duration, a 13% drop in pages per visit, and a 13% increase in the bounce rate.
This data echoed the company’s own pre-IPO statement that it was having an issue with customer retention and suggested that it could learn from its main competitor how to maintain actively engaged visitors. Hellofresh.com was maintaining visit duration and bounce rate while increasing pages per visit by 7% over the same time.
Using Similarweb, we found that over the past year, visitors arriving at blueapron.com through paid search and email were significantly more engaged than traffic from other sources.
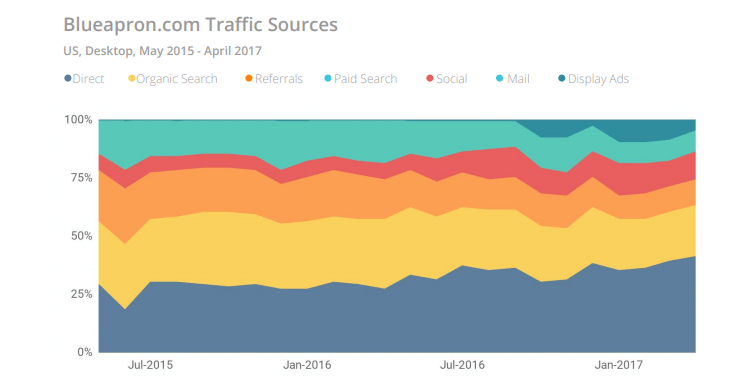
Sources
It was clear that the company was investing in paid search traffic, which increased by 3.7 percentage points over the year. However, email traffic decreased by 9 percentage points over the same time.
Continued investment in PPC traffic may be a way of bringing the site new, engaged visitors while keeping them active through effective email campaigns.
Competitors
As the market expanded, blueapron.com started to lose market share, dropping to 38% in October 2016. This decrease can be attributed to an influx of competing companies gaining traffic in this new market.
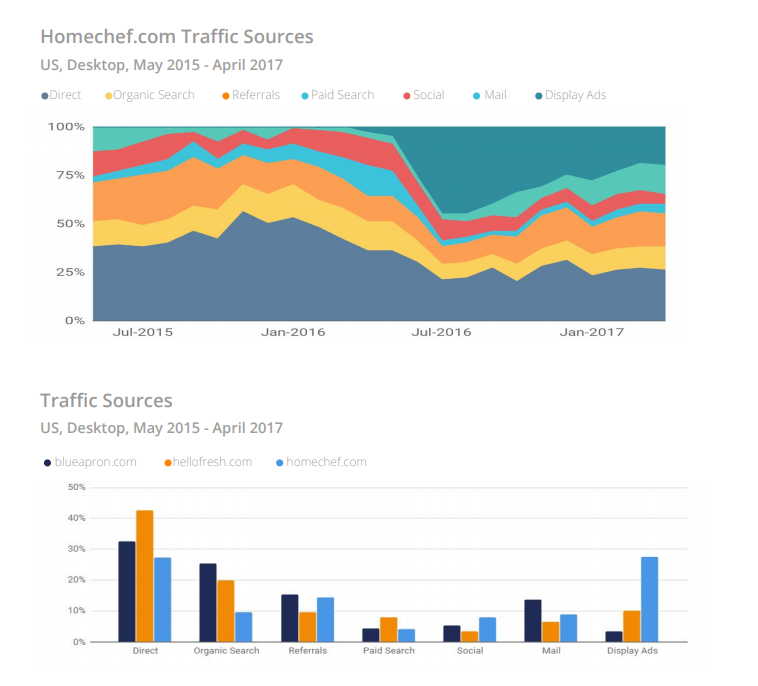
Homechef.com
Third place in terms of visitors is homechef.com, which has increased traffic to its site by 1550% over the past two years. The brand has used display advertising to generate traffic, peaking in July 2016 at 45% of the site’s traffic.
Hellofresh.com
In addition to its improved engagement stats, hellofresh.com has seen a relatively stable flow of traffic over the past two years, with an average market share of 24%. It is also leading in direct traffic share as 43% of its visitors arrive directly at the site, indicating high brand awareness. The site’s strategy appears to be supplementing organic traffic, with paid search and display ads, which provide for more engaged audiences, and higher visibility.
What happened next?
In the last week before the IPO, Blue Apron’s share price was revised downwards from a proposed $15-17 a share to a launch price of $10. This may have been driven in part by news that Amazon was potentially planning to enter the food kit space. But there was also an increasing sense that trial subscribers were not converting and that investment in paid traffic could not counter subscriber churn.
Two months after the IPO, there were lingering concerns about Blue Apron’s marketing strategy and how it could counter problems with subscriber retention.
Takeaways
1. Pre-IPO, blueapron.com was clearly the US market leader in the meal kit sector in terms of both traffic and user engagement.
2. Their remarkable growth in traffic over the past two years was seriously underpinned by investment in paid search and display ads.
3. So far, efforts to grow traffic through paid media have not significantly counteracted existing issues with user retention.
Contact us to arrange a live demo with a Similarweb Consultant.