

SankeyMaster: Sankey Diagram 앱 분석 (10월 6일)

SankeyMaster: Sankey Diagram
- 辉章 何
- Apple App Store
- 유료
- 그래픽 및 디자인
Why Choose SankeyMaster?
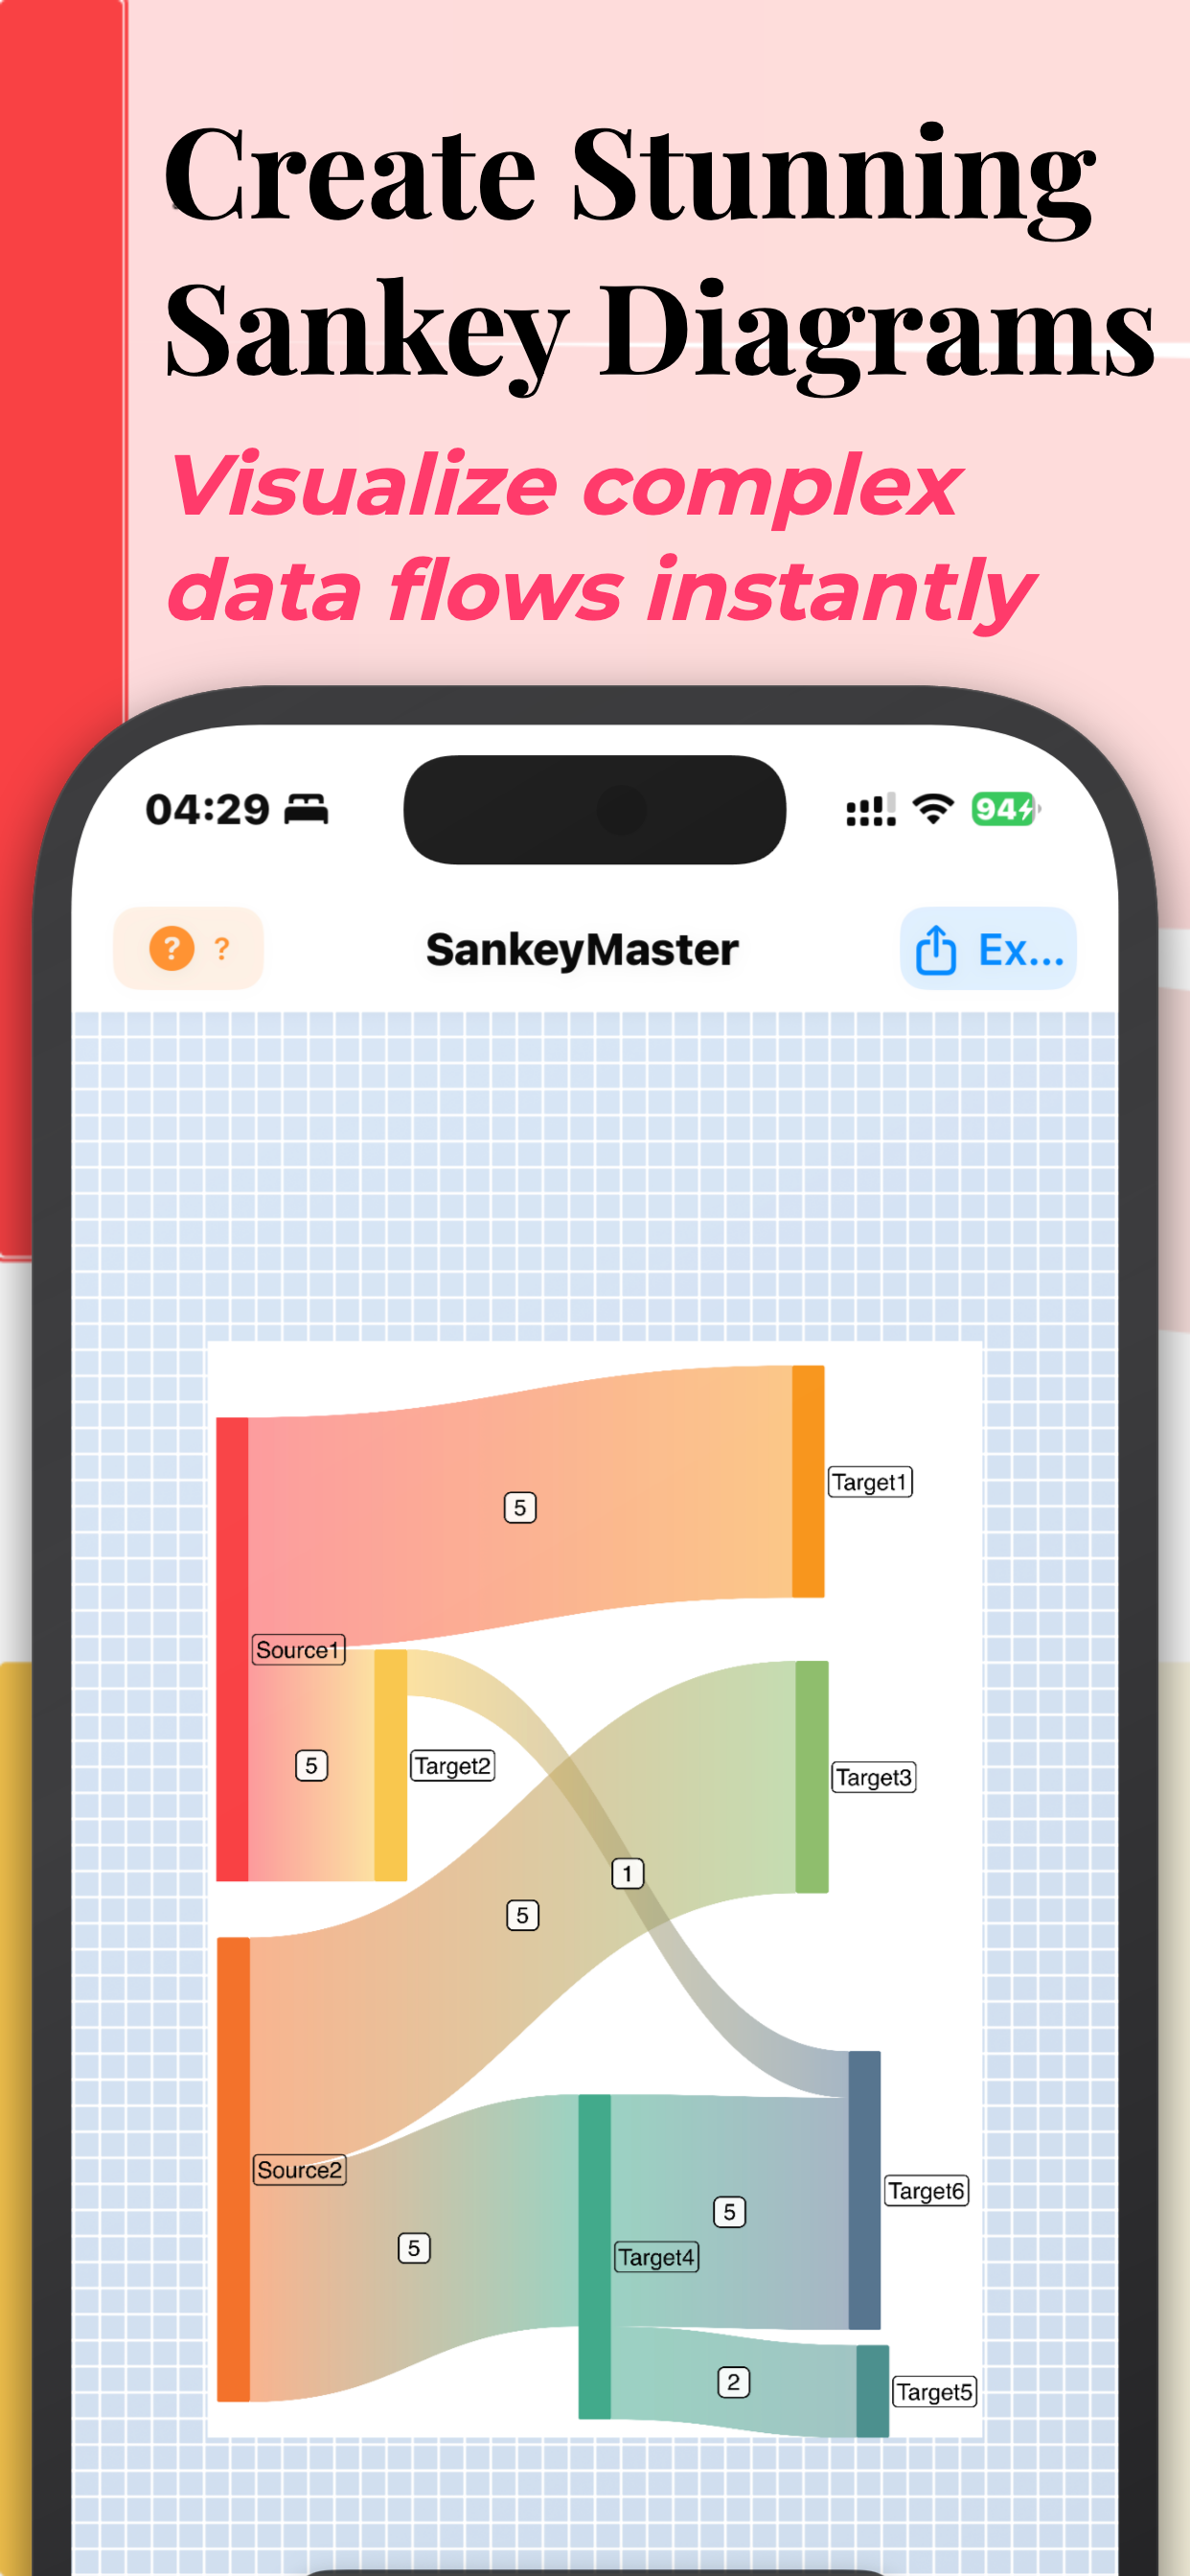
• Easy Data Entry: Seamlessly input data to create personalized Sankey charts.
• Data File Import: Effortlessly import Sankey chart data via CSV files.
• Drag and Drop Node Adjustment: Adjust the position of each node with simple drag-and-drop functionality.
• Minimalist Design: Use our user-friendly interface to create detailed data relationships with ease.
• Rich Color Representation: Each node is visually distinct with different color representations.
• High-Quality Export: Share and integrate your work effortlessly with high-resolution Sankey charts.
• Cross-Platform Highlights: Tailored for iOS, macOS, and visionOS to ensure a seamless user experience.
Where to Use SankeyMaster?
• Business Analysis: Visualize financial flows, market trends, and operational efficiencies.
• Academic Research: Illustrate complex research data and findings with clarity.
• Marketing: Track customer journeys and measure the effectiveness of marketing campaigns.
• Environmental Studies: Analyze energy flows, resource management, and sustainability metrics.
• Project Management: Map out project workflows, resource allocation, and track progress.
• Supply Chain Management: Trace product flow from production to delivery and analyze supply chain efficiency.
• Public Policy: Visualize government budget allocations and analyze the impact of social programs and policies.
• Healthcare: Study disease transmission paths and analyze the distribution and usage of medical resources.
• Education and Training: Display educational resource distribution and learning paths clearly, and analyze training outcomes and learning progress.
• Manufacturing: Analyze production processes and material flows, optimizing resource allocation and process efficiency.
• Transportation and Logistics: Track traffic flows and transport routes, and analyze logistics distribution and traffic congestion.
• Energy Management: Visualize energy consumption and production, and optimize energy distribution and utilization efficiency.
• Human Resources: Map out employee workflows, track recruitment processes, and analyze workforce distribution.
• Sales and Revenue Analysis: Understand the flow of sales channels and revenue streams to identify key performance indicators and areas for improvement.
• Customer Service: Visualize support ticket flows, track resolution times, and analyze service efficiency.
• Telecommunications: Analyze network traffic, data flow, and bandwidth usage for optimization.
• Software Development: Map out development workflows, track issue resolution, and visualize project milestones.
• Legal and Compliance: Track document flows, case progress, and compliance activities to ensure legal processes are streamlined.
• Event Planning: Visualize the flow of tasks, resource allocation, and attendee movement to streamline event management.
• Media and Content Creation: Track content creation workflows, from idea generation to publication, and analyze audience engagement.
• Retail Management: Analyze product flow, inventory levels, and sales patterns to optimize retail operations.
• Insurance: Visualize claims processes, policyholder data flows, and risk assessment to improve service delivery and risk management.
• Real Estate: Track property transactions, visualize the flow of leads to sales, and analyze market trends.
• Hospitality Management: Map out guest journeys, analyze service delivery, and optimize resource allocation.
• Nonprofit Organizations: Visualize donation flows, fund allocation, and program impact to improve transparency and donor engagement.
• Agriculture: Track crop production flows, analyze resource usage, and optimize supply chain management for better yield and efficiency.
Whether you’re a seasoned data analyst, a curious student, or anyone looking to revolutionize data communication, SankeyMaster is your first choice for mastering the art of Sankey charting.
Download now and turn your data into compelling visual narratives!
스토어 순위
스토어 순위는 Google과 Apple이 설정한 여러 매개변수를 기반으로 합니다.
모든 카테고리 ·
미국--
그래픽 및 디자인 ·
미국--


 SankeyMaster: Sankey Diagram VS.
 10월 6, 2026