Charts & Stock Market Analysis analisi dell'app per 2 dicembre
Charts & Stock Market Analysis
- Statmetrics
- Google Play Store
- Gratis
- Finanza
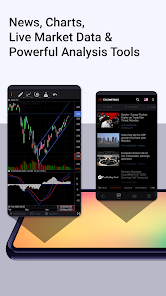
Statmetrics is a comprehensive solution for stock market analysis, portfolio tracking and analytics, investment management and research. Stay on top of the markets and access global market news, economic and real-time financial data from global stock exchanges. Forecast market trends and cycles with advanced charting and technical analysis. Construct, backtest and manage multiple portfolios and streamline your risk management with the integrated portfolio analytics solution. Analyze the fundamental and quantitative characteristics of portfolio or potential investments and gain insight into the risk-return profile of your investments. Track overall performance of your portfolio across all accounts in one place and evaluate your investment strategy. Enhance your investment research, explore investment opportunities and identify hidden risks that affect your investments with a comprehensive suite of analytical tools and financial models.
GLOBAL MARKETS & FINANCIAL NEWS
- Live quotes and charts for major financial instruments (indices, stocks, bonds, mutual funds, ETFs, commodities, currencies, crypto, interest rates, futures and options), traded on global exchanges.
- Market screener for searching equities, funds and ETFs by user-defined search parameters.
- Personalized watchlists and notepad for storing trading ideas.
- Calendar for economic events and company earnings reports.
- Financial news coverage for multiple regions and languages
- Integrated RSS-Reader and news feed subscription by the user.
- Search for news headlines and Google Trends statistics by specific keywords.
CHARTING & TECHNICAL ANALYSIS
- Interactive high-performance charting and broad range of drawing tools.
- Large set of commonly used technical indicators.
- Custom Templates for intraday and historical charts.
PORTFOLIO MANAGEMENT
- Real-time tracking of multiple investment portfolios
- Transaction management of securities and other assets, withdrawals and deposits, dividends, income and expenses, corporate actions
- Cash flow management for monitoring cash inflows/outflows and analyzing income generation
- Multi-account management for asset, security and cash accounts with multi-currency support
- Historical portfolio performance analysis with Compound Annual Growth Rate (CAGR), Money-Weighted Return (MWR) or Internal Rate of Return (IRR).
PORTFOLIO ANALYTICS & INVESTMENT RESEARCH
- Portfolio performance tracking and analysis of investment strategies based on trading history
- Construction, backtesting and management of multi-currency and long-short portfolios.
- Fundamental and quantitative performance and risk analysis of portfolio and its components.
- Measuring performance vs. benchmark and calculation of investment risk indicators (return, volatility, Sharpe ratio, maximum drawdown, value-at-risk, expected shortfall, alpha, beta, information ratio, etc.).
- Analysis of stress events, drawdowns and measuring of historical and modified value-at-risk.
- Evaluation of asset allocation, sector allocation, correlations and portfolio risk decomposition.
- Visualization of security market line, security characteristic line, efficient frontier and rolling investment risk indicators.
- Predefined mean-variance portfolio optimization strategies (minimum variance, maximum diversification, maximum decorrelation, equal risk contribution, etc.).
- Fundamental analysis of income statement, balance sheet, cash-flow statement, institutional holders, mutual fund holders, company profiles and visualization of key financial ratios.
- Evaluation of fundamental factors such as per share data, valuation ratios, profitability, growth, leverage, liquidity, dividend growth and dividend history.
- Calculation of group descriptive statistics for single assets, portfolio or a watchlist.
- Statistical visualization and hypothesis testing (unit root test, Granger causality test, etc.).
- Correlation, cointegration, regression and principal component analysis.
Ranking di utilizzo di Charts & Stock Market Analysis
Il ranking di utilizzo si basa sull'algoritmo di Similarweb che calcola le installazioni correnti e gli utenti attivi su un periodo di 28 giorni.
Tutte le categorie in
Stati Uniti--
Finanza in
Stati Uniti#5,029
Interessi degli utenti e categorie principali
Le categorie principali e le app utilizzate dagli utenti di Charts & Stock Market Analysis
Categorie principali
Affinità
Le migliori app all'interno della categoria
Altri applicazioni
13%
11%
10%
10%
Principali concorrenti e app alternative
App con un'alta probabilità di essere utilizzate dagli stessi utenti, provenienti dallo stesso store.
MarketWatch
Goldman Sachs Wellness
Stock Screener Pro
Stoxy PRO - Stock Market Live
2icembre d, 2025