Best Selling Science & Math Products & Brands on amazon.ca
See the full list of Market Leaders In Amazon Science & Math in amazon.ca for December 1, and read the full analysis below
Last updated : December 1, 2025
Top Brands on the Science & Math category
See which brands are leading the Science & Math category on amazon.ca. Analyze data on top brands, including their revenue, product views, and conversion rates, offering a clear picture of brand competitiveness within the category.
| Brand | Revenue share | Change | Product views | Change | CVR | Change | ASP | Change | |||||||||||||||||||||||||||||||||||||||||||||||||||||||||||||||||||||||||||||||||||||||||||
|---|---|---|---|---|---|---|---|---|---|---|---|---|---|---|---|---|---|---|---|---|---|---|---|---|---|---|---|---|---|---|---|---|---|---|---|---|---|---|---|---|---|---|---|---|---|---|---|---|---|---|---|---|---|---|---|---|---|---|---|---|---|---|---|---|---|---|---|---|---|---|---|---|---|---|---|---|---|---|---|---|---|---|---|---|---|---|---|---|---|---|---|---|---|---|---|---|---|---|---|
| Wyman Publishing | 1.15% | 0.54pp | 16.6K | 281.99% | 6.65% | 12.79% | CDN$16.97 | 2.63% | |||||||||||||||||||||||||||||||||||||||||||||||||||||||||||||||||||||||||||||||||||||||||||
| Peter Attia MD | 0.55% | 2.88pp | 4.2K | 279.64% | 2.64% | 12.60% | CDN$16.97 | 1.79% | |||||||||||||||||||||||||||||||||||||||||||||||||||||||||||||||||||||||||||||||||||||||||||
| Casey Means MD | 0.21% | 5.07pp | 6.8K | 278.66% | 5.36% | 0.58% | CDN$0.35 | 2.54% | |||||||||||||||||||||||||||||||||||||||||||||||||||||||||||||||||||||||||||||||||||||||||||
| Yuval Noah Harari | 0.76% | 9.46pp | 10.9K | 249.00% | 5.98% | 11.32% | CDN$15.40 | 1.85% | |||||||||||||||||||||||||||||||||||||||||||||||||||||||||||||||||||||||||||||||||||||||||||
| Wyman Publishing | 1.15% | 0.54pp | 16.6K | 281.99% | 6.65% | 12.79% | CDN$16.97 | 2.63% | |||||||||||||||||||||||||||||||||||||||||||||||||||||||||||||||||||||||||||||||||||||||||||
Who’s winning your category? See top brands by revenue, views, and conversion rate. | |||||||||||||||||||||||||||||||||||||||||||||||||||||||||||||||||||||||||||||||||||||||||||||||||||
Channels Breakdown & Performance
Understand where the top brands in the Science & Math category get their traffic. This section breaks down the leading traffic sources, revealing which channels drive the most visibility and sales for top-performing brands.
See how top brands drive traffic and sales on Amazon.
See full channel breakdownTop selling sub-categories in the Science & Math category
Explore the breakdown of sub-categories within the Science & Math category. This section provides insights into the performance of different sub-categories, helping to identify which segments are growing, which are most competitive, and where consumer interest is shifting.
Top Products on the Science & Math Category
Discover the most-viewed products in the Science & Math category. This section highlights the top-performing products based on product views, revenue, and units sold, giving a snapshot of what’s driving consumer interest and purchases.
| Product | Category | Brand | Product Views | Change | Revenue | Change | Units Sold | Change | |||||||||||||||||||||||||||||||||||||||||||||||||||||||||||||||||||||||||||||||||||||||||||
|---|---|---|---|---|---|---|---|---|---|---|---|---|---|---|---|---|---|---|---|---|---|---|---|---|---|---|---|---|---|---|---|---|---|---|---|---|---|---|---|---|---|---|---|---|---|---|---|---|---|---|---|---|---|---|---|---|---|---|---|---|---|---|---|---|---|---|---|---|---|---|---|---|---|---|---|---|---|---|---|---|---|---|---|---|---|---|---|---|---|---|---|---|---|---|---|---|---|---|---|
 | ...> Preventive Medicine | Mary Ann | 19.5K | = | 9.83% | 8.47% | < 50 | 4.28% | |||||||||||||||||||||||||||||||||||||||||||||||||||||||||||||||||||||||||||||||||||||||||||
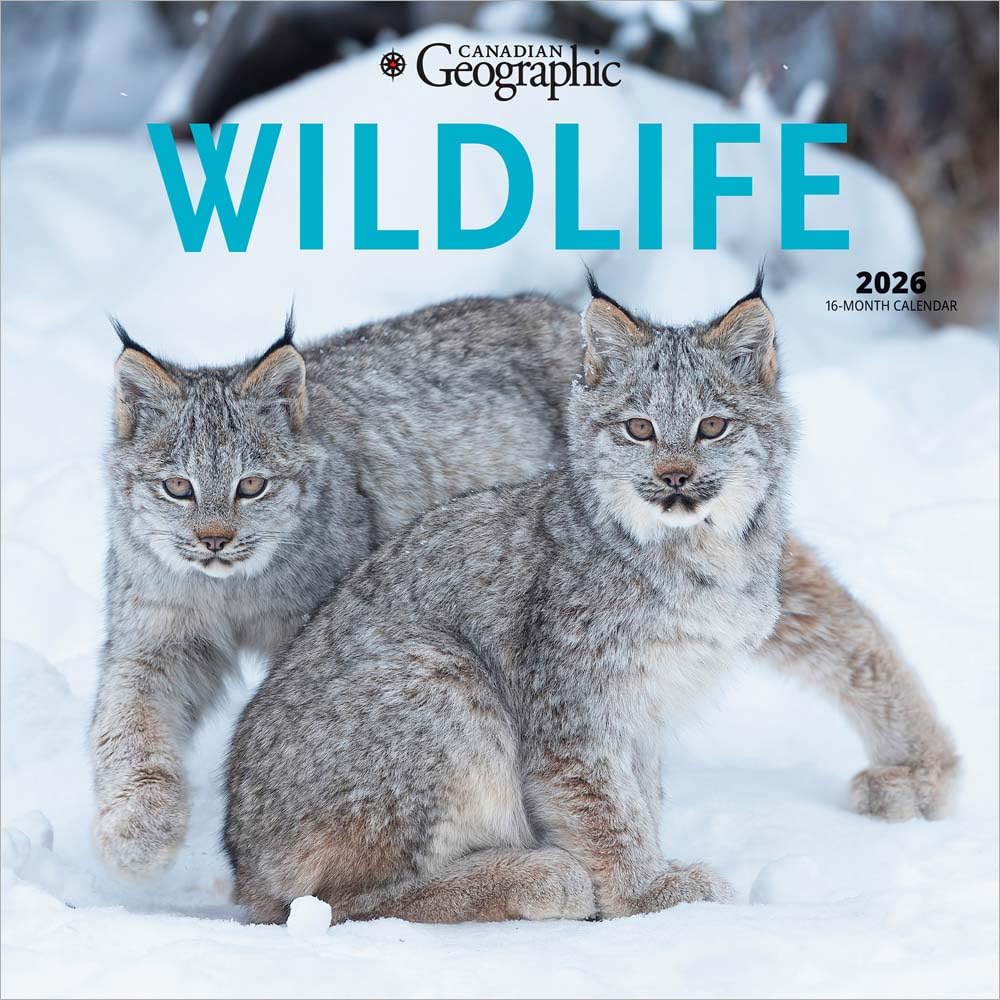 | ...> Wildlife | Wyman Publishing | 13.5K | = | 19.50% | 7.60% | 70 | 1.08% | |||||||||||||||||||||||||||||||||||||||||||||||||||||||||||||||||||||||||||||||||||||||||||
 | ...> History & Philosophy | Danna Clayton | 6.8K | = | 4.39% | 5.80% | 88 | 7.02% | |||||||||||||||||||||||||||||||||||||||||||||||||||||||||||||||||||||||||||||||||||||||||||
 | ...> Medicine | Peter Attia MD | 5.5K | 49.49% | 4.56% | 17.64% | 100 | 2.01% | |||||||||||||||||||||||||||||||||||||||||||||||||||||||||||||||||||||||||||||||||||||||||||
 | ...> Animals | Nancy Rose | 4.9K | = | 3.81% | 9.44% | 99 | 6.37% | |||||||||||||||||||||||||||||||||||||||||||||||||||||||||||||||||||||||||||||||||||||||||||
| ...> Preventive Medicine | Mary Ann | 19.5K | = | 9.83% | 8.47% | < 50 | 4.28% | |||||||||||||||||||||||||||||||||||||||||||||||||||||||||||||||||||||||||||||||||||||||||||
| ...> Wildlife | Wyman Publishing | 13.5K | = | 19.50% | 7.60% | 70 | 1.08% | |||||||||||||||||||||||||||||||||||||||||||||||||||||||||||||||||||||||||||||||||||||||||||
| ...> History & Philosophy | Danna Clayton | 6.8K | = | 4.39% | 5.80% | 88 | 7.02% | |||||||||||||||||||||||||||||||||||||||||||||||||||||||||||||||||||||||||||||||||||||||||||
| ...> Medicine | Peter Attia MD | 5.5K | 49.49% | 4.56% | 17.64% | 100 | 2.01% | |||||||||||||||||||||||||||||||||||||||||||||||||||||||||||||||||||||||||||||||||||||||||||
| ...> Animals | Nancy Rose | 4.9K | = | 3.81% | 9.44% | 99 | 6.37% | |||||||||||||||||||||||||||||||||||||||||||||||||||||||||||||||||||||||||||||||||||||||||||
What’s selling—and why Explore the top-performing products on Amazon based on product views, sales, and revenue.Spot trends, category winners, and emerging bestsellers at a glance. | |||||||||||||||||||||||||||||||||||||||||||||||||||||||||||||||||||||||||||||||||||||||||||||||||||