Best Selling Sports & Outdoors Products & Brands on amazon.co.uk
See the full list of Market Leaders In Amazon Sports & Outdoors in amazon.co.uk for November 1, and read the full analysis below
Last updated : November 1, 2025
Top Brands on the Sports & Outdoors category
See which brands are leading the Sports & Outdoors category on amazon.co.uk. Analyze data on top brands, including their revenue, product views, and conversion rates, offering a clear picture of brand competitiveness within the category.
| Brand | Revenue share | Change | Product views | Change | CVR | Change | ASP | Change | |||||||||||||||||||||||||||||||||||||||||||||||||||||||||||||||||||||||||||||||||||||||||||
|---|---|---|---|---|---|---|---|---|---|---|---|---|---|---|---|---|---|---|---|---|---|---|---|---|---|---|---|---|---|---|---|---|---|---|---|---|---|---|---|---|---|---|---|---|---|---|---|---|---|---|---|---|---|---|---|---|---|---|---|---|---|---|---|---|---|---|---|---|---|---|---|---|---|---|---|---|---|---|---|---|---|---|---|---|---|---|---|---|---|---|---|---|---|---|---|---|---|---|---|
| MERACH | 1.24% | 1.09pp | 724.5K | 1622.60% | 3.45% | 19.69% | £150.44 | 21.08% | |||||||||||||||||||||||||||||||||||||||||||||||||||||||||||||||||||||||||||||||||||||||||||
| TARGET | 1.05% | 1.05pp | 720.9K | 378.09% | 2.12% | 6.09% | £149.94 | 3.69% | |||||||||||||||||||||||||||||||||||||||||||||||||||||||||||||||||||||||||||||||||||||||||||
| Strongway | 0.93% | 0.85pp | 631.6K | 535.95% | 3.42% | 13.98% | £12.41 | 1.32% | |||||||||||||||||||||||||||||||||||||||||||||||||||||||||||||||||||||||||||||||||||||||||||
| nexace | 0.71% | 0.69pp | 10.1K | 1283.17% | 3.40% | 1.86% | £121.59 | 11.08% | |||||||||||||||||||||||||||||||||||||||||||||||||||||||||||||||||||||||||||||||||||||||||||
| PUSUN | 0.62% | 0.62pp | 368.5K | 873.13% | 0.22% | 7.43% | £111.15 | 14.57% | |||||||||||||||||||||||||||||||||||||||||||||||||||||||||||||||||||||||||||||||||||||||||||
Who’s winning your category? See top brands by revenue, views, and conversion rate. | |||||||||||||||||||||||||||||||||||||||||||||||||||||||||||||||||||||||||||||||||||||||||||||||||||
Channels Breakdown & Performance
Understand where the top brands in the Sports & Outdoors category get their traffic. This section breaks down the leading traffic sources, revealing which channels drive the most visibility and sales for top-performing brands.
See how top brands drive traffic and sales on Amazon.
See full channel breakdownTop selling sub-categories in the Sports & Outdoors category
Explore the breakdown of sub-categories within the Sports & Outdoors category. This section provides insights into the performance of different sub-categories, helping to identify which segments are growing, which are most competitive, and where consumer interest is shifting.
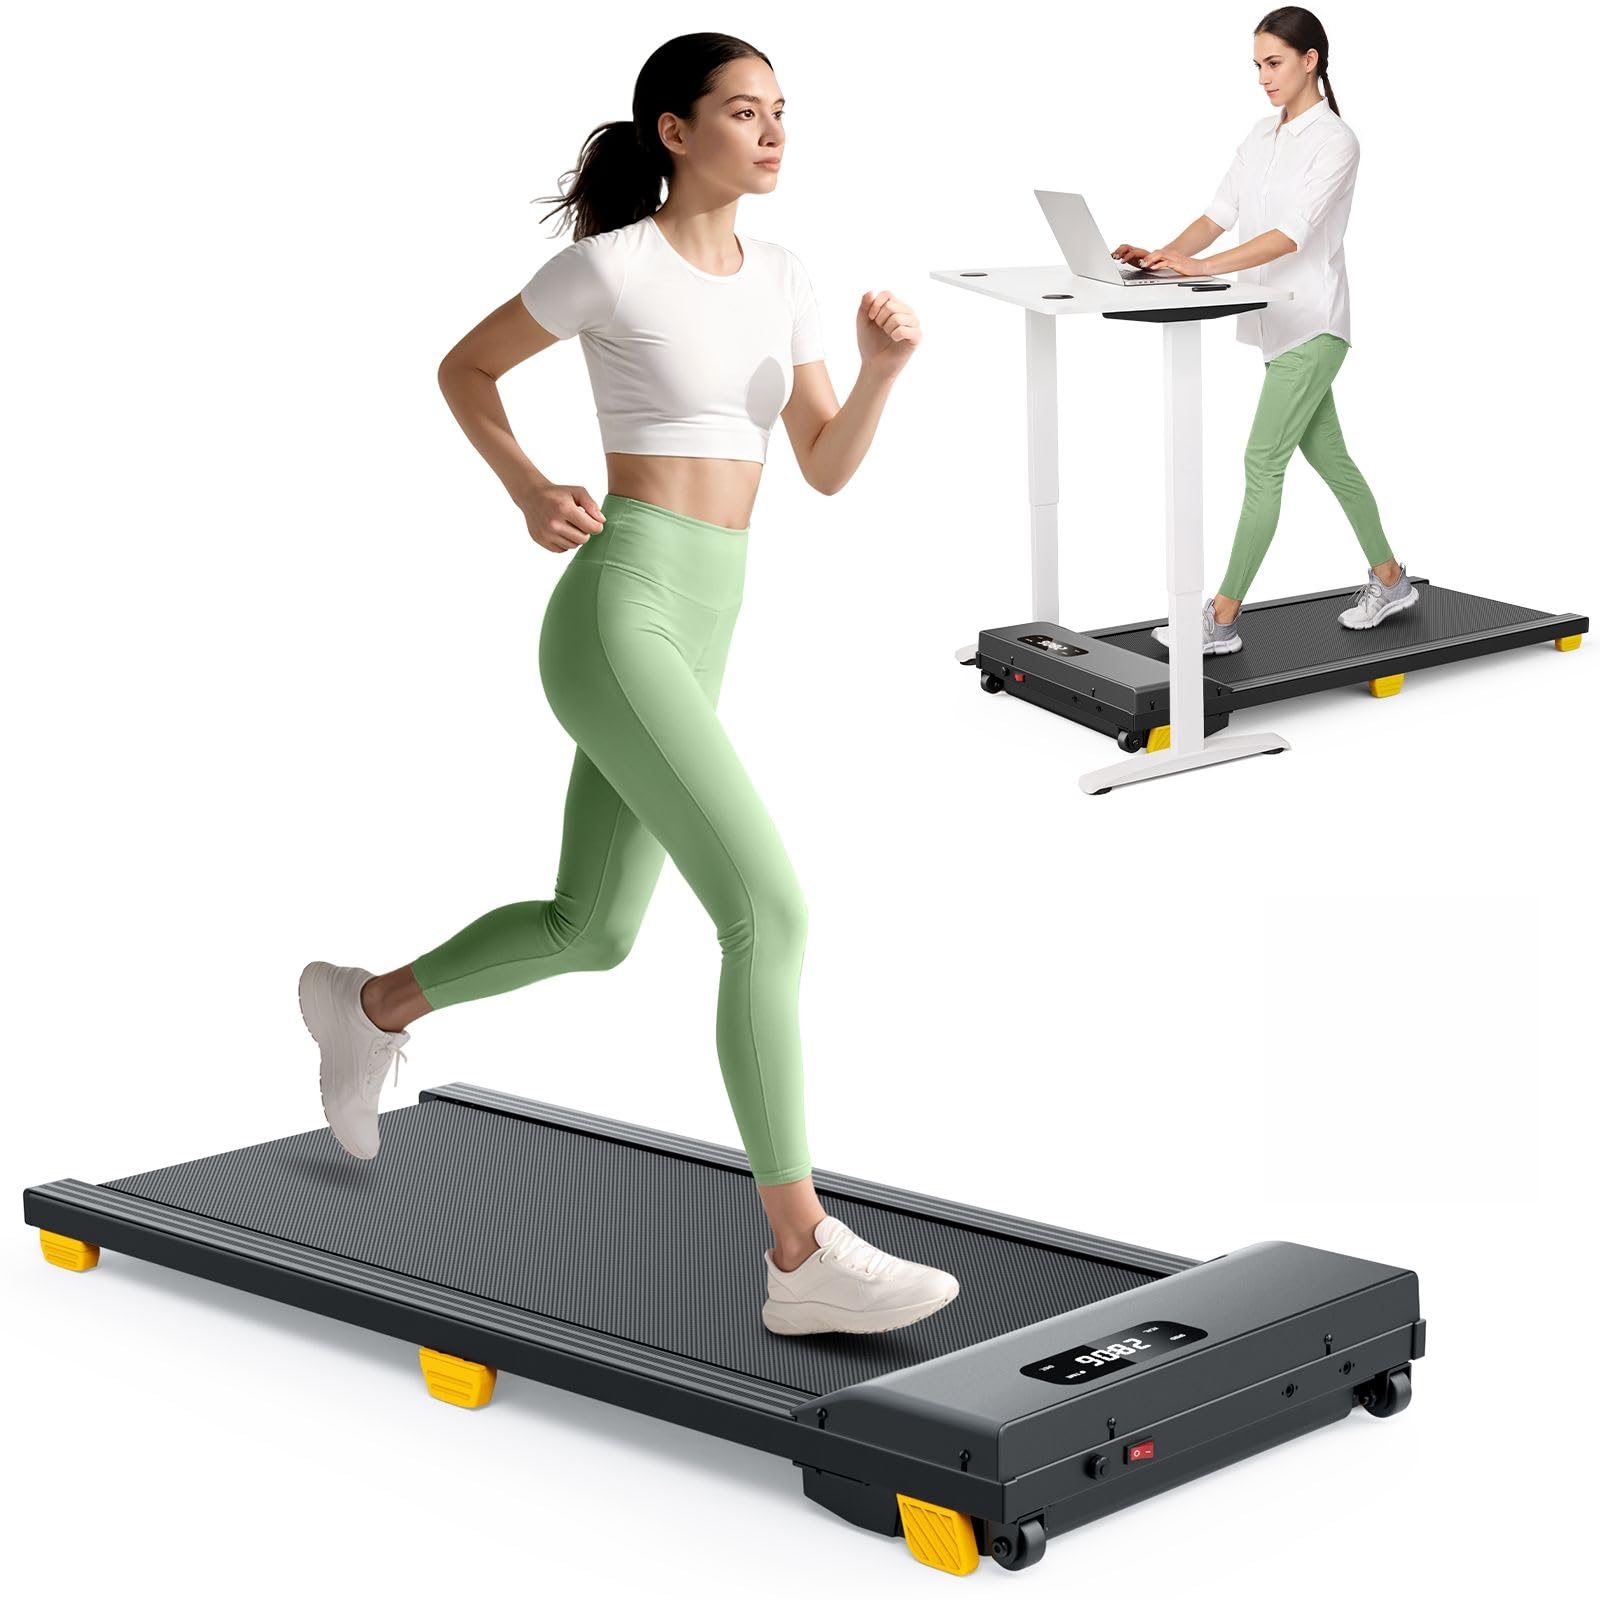
Top Products on the Sports & Outdoors Category
Discover the most-viewed products in the Sports & Outdoors category. This section highlights the top-performing products based on product views, revenue, and units sold, giving a snapshot of what’s driving consumer interest and purchases.
| Product | Category | Brand | Product Views | Change | Revenue | Change | Units Sold | Change | |||||||||||||||||||||||||||||||||||||||||||||||||||||||||||||||||||||||||||||||||||||||||||
|---|---|---|---|---|---|---|---|---|---|---|---|---|---|---|---|---|---|---|---|---|---|---|---|---|---|---|---|---|---|---|---|---|---|---|---|---|---|---|---|---|---|---|---|---|---|---|---|---|---|---|---|---|---|---|---|---|---|---|---|---|---|---|---|---|---|---|---|---|---|---|---|---|---|---|---|---|---|---|---|---|---|---|---|---|---|---|---|---|---|---|---|---|---|---|---|---|---|---|---|
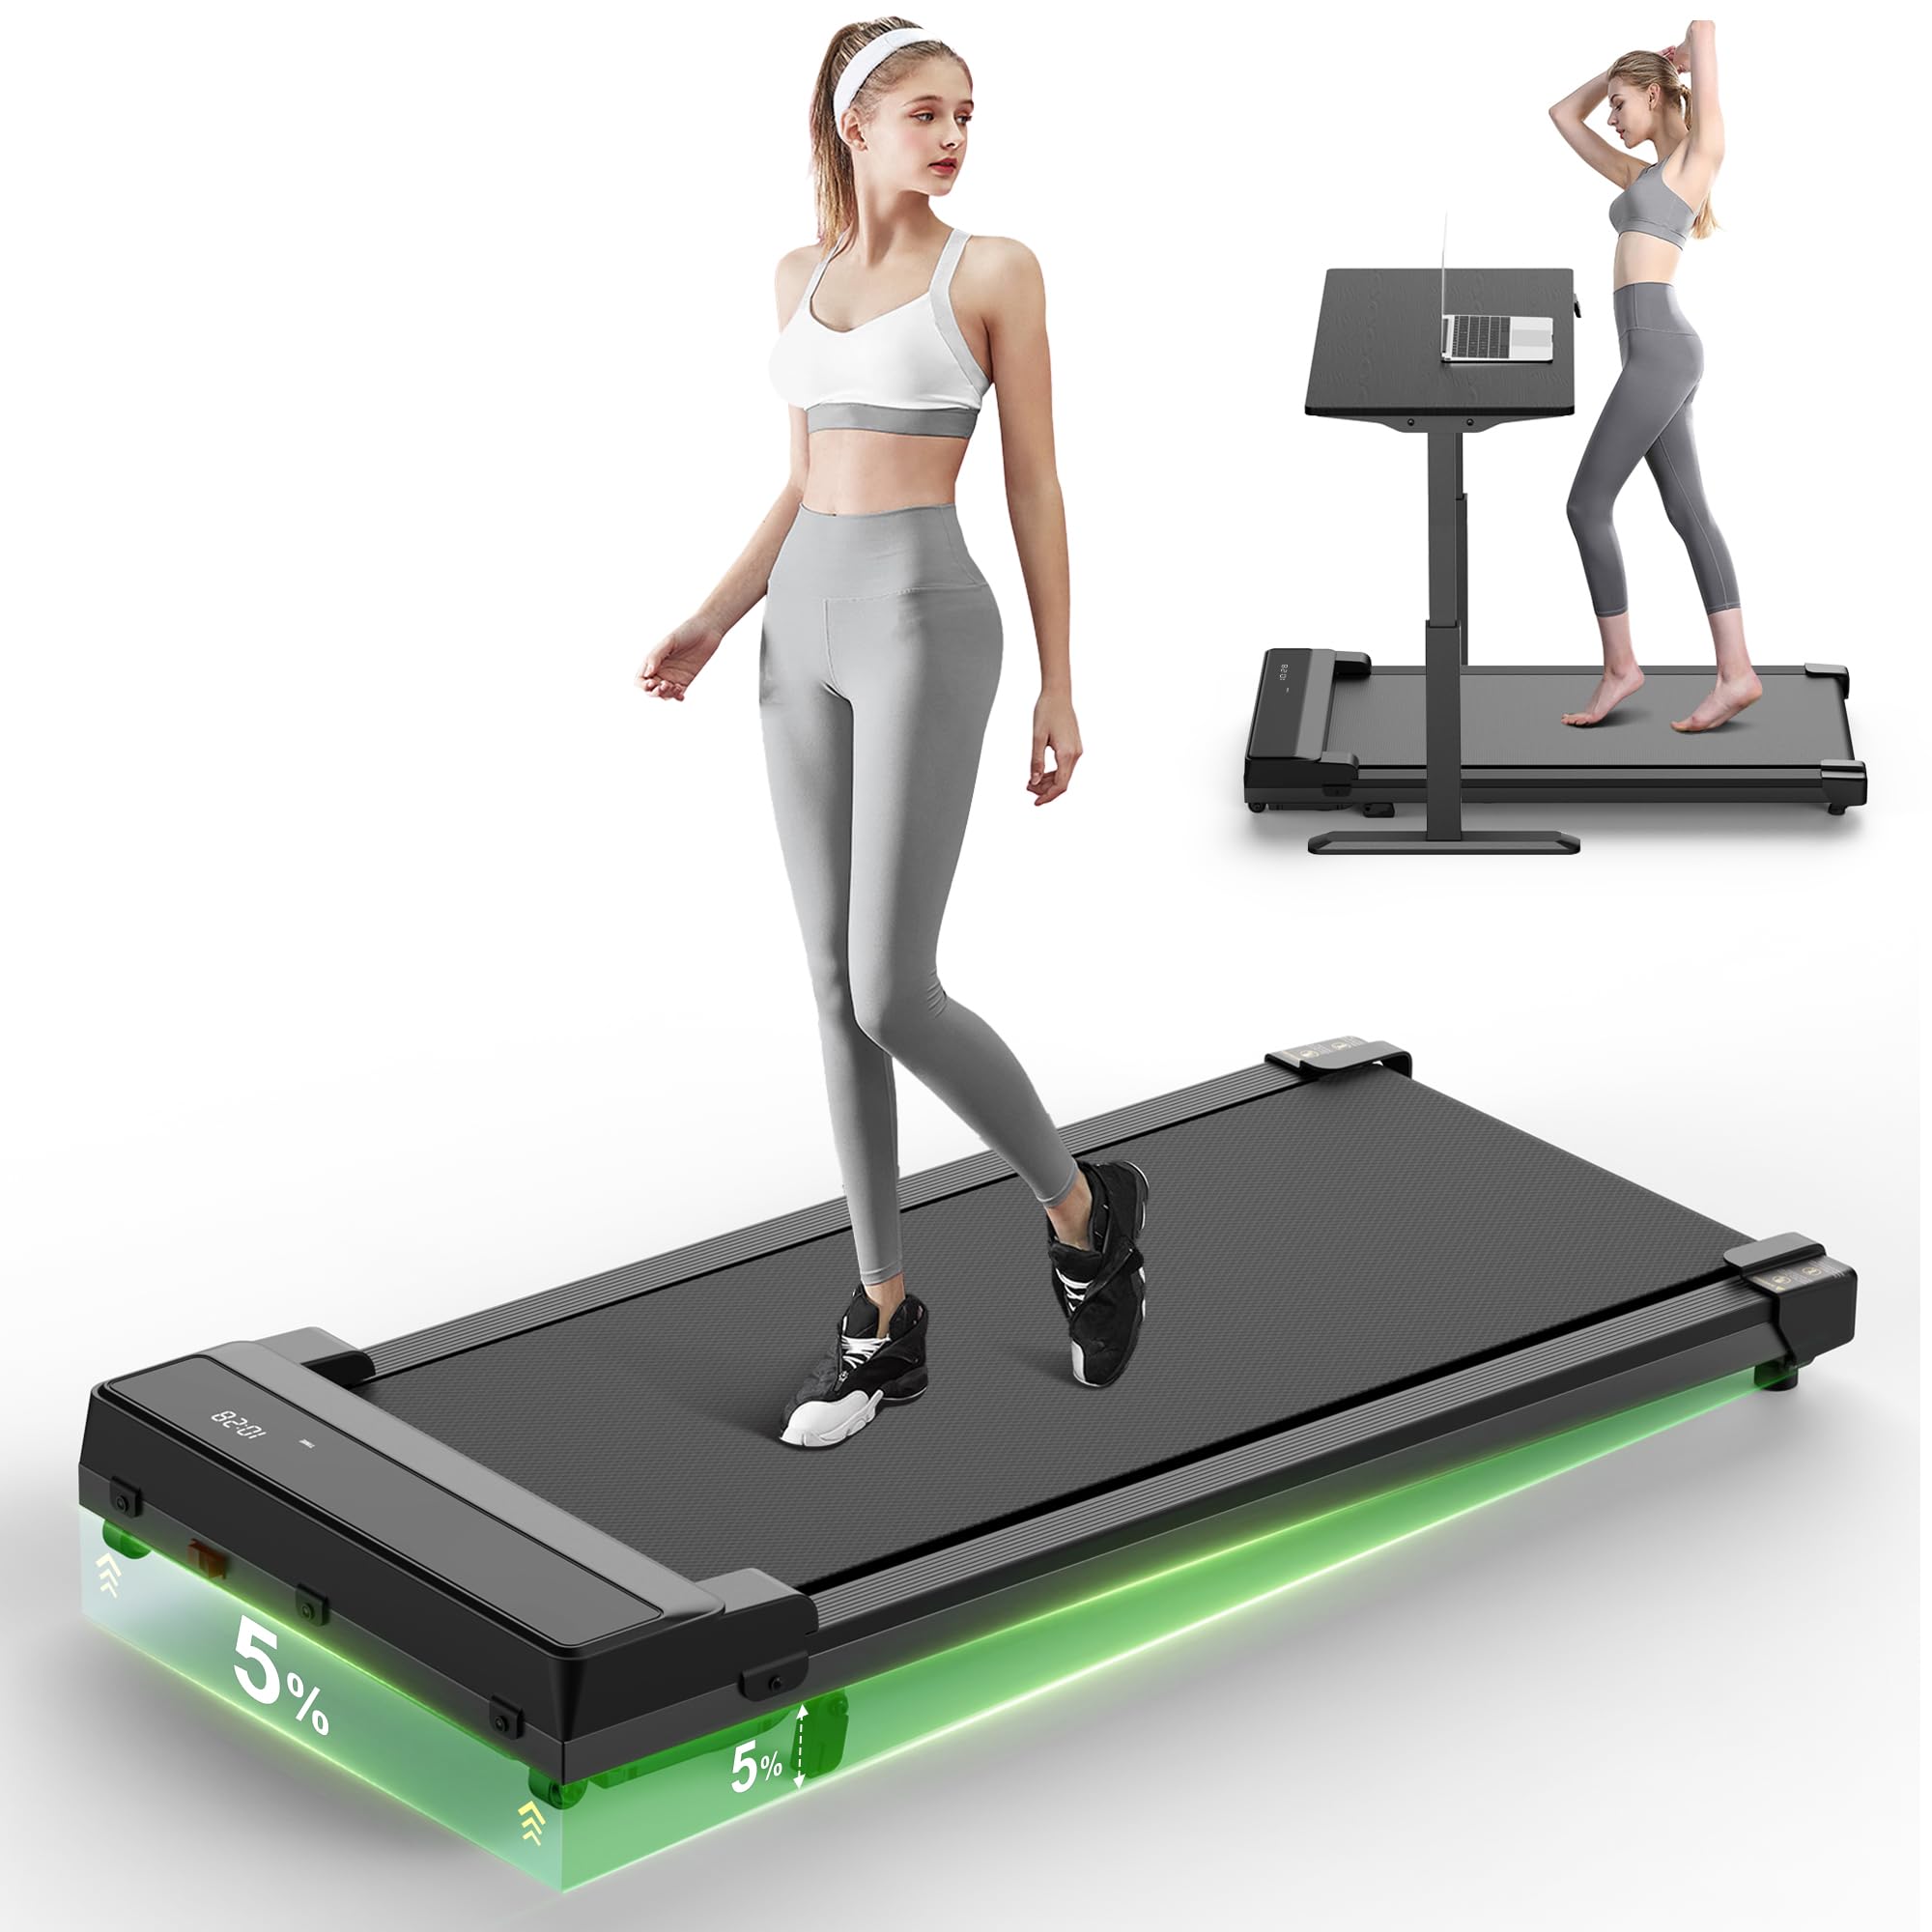 | ...> Treadmills | Cazvian | 220.5K | = | 9.94% | 7.24% | < 50 | 17.34% | |||||||||||||||||||||||||||||||||||||||||||||||||||||||||||||||||||||||||||||||||||||||||||
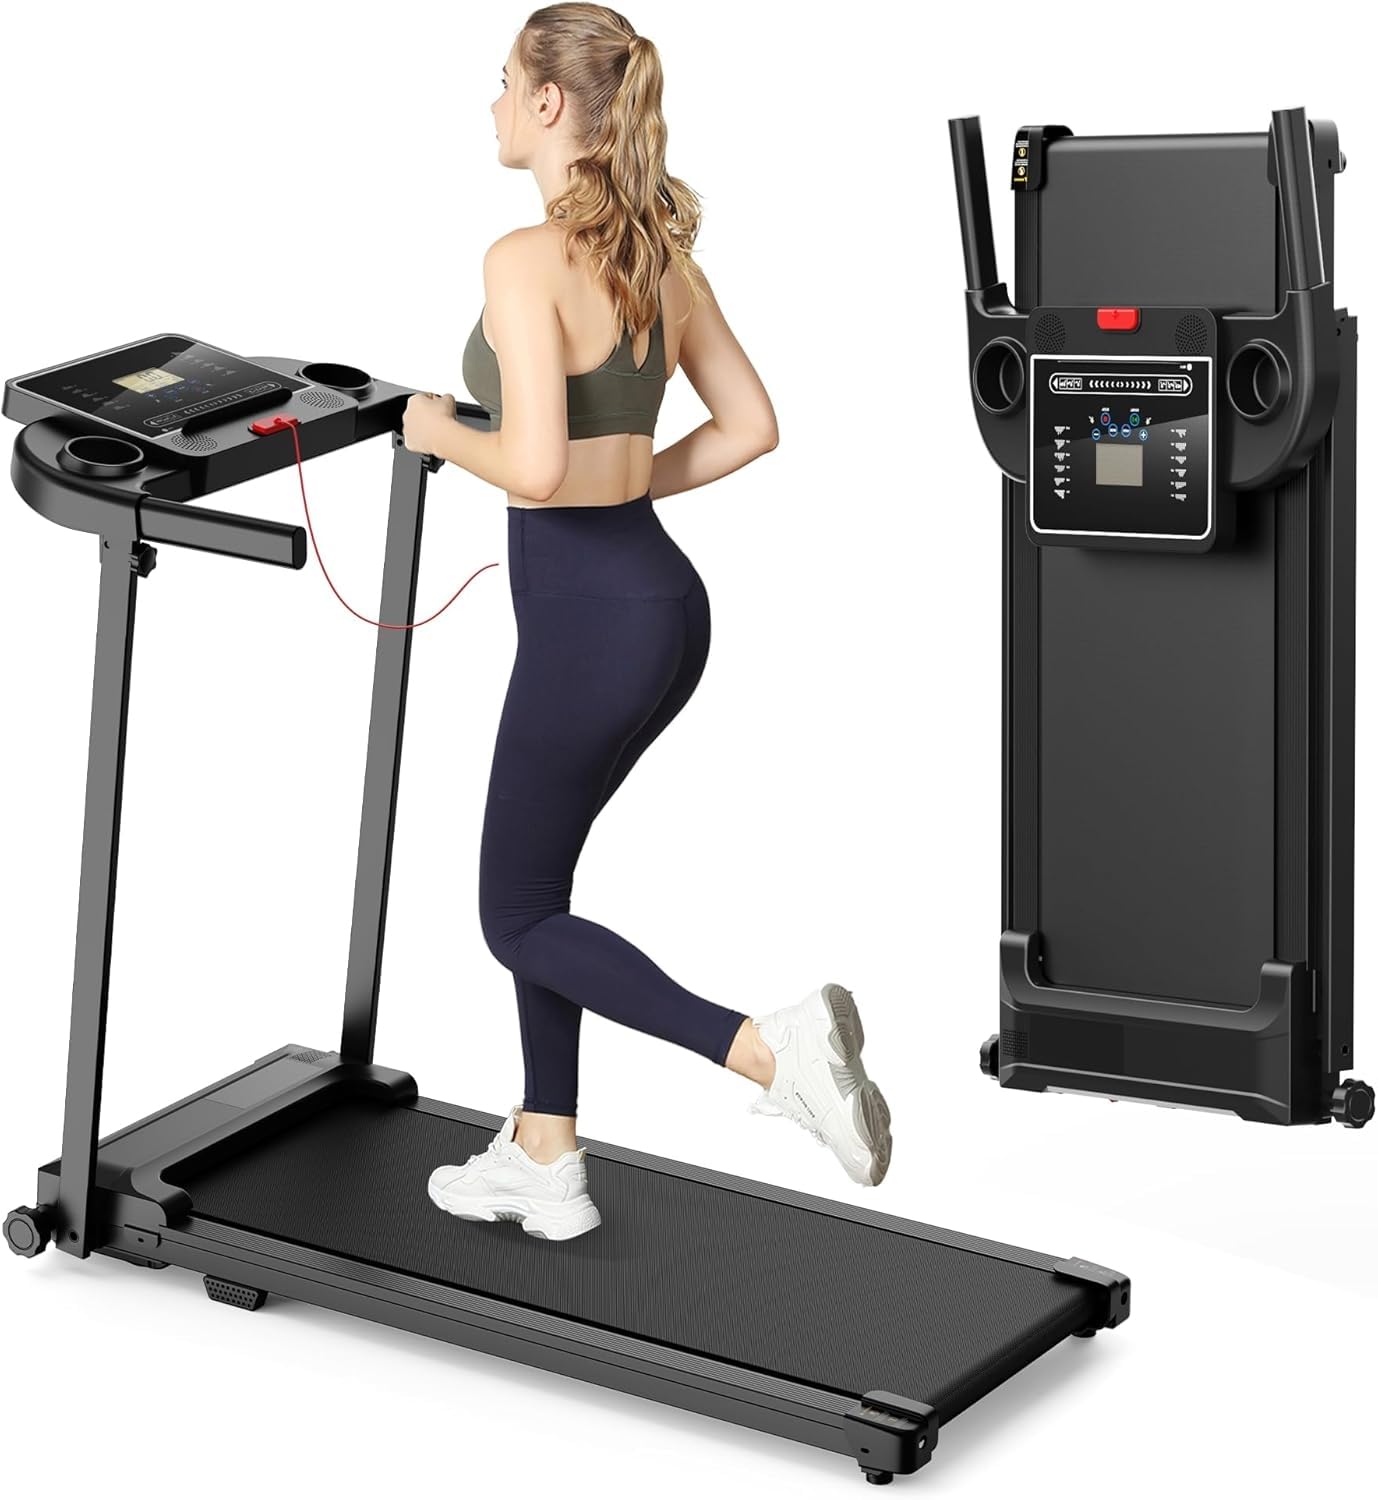 | ...> Treadmills | Kerolina | 219.2K | = | 4.45% | 19.90% | 100 | 9.13% | |||||||||||||||||||||||||||||||||||||||||||||||||||||||||||||||||||||||||||||||||||||||||||
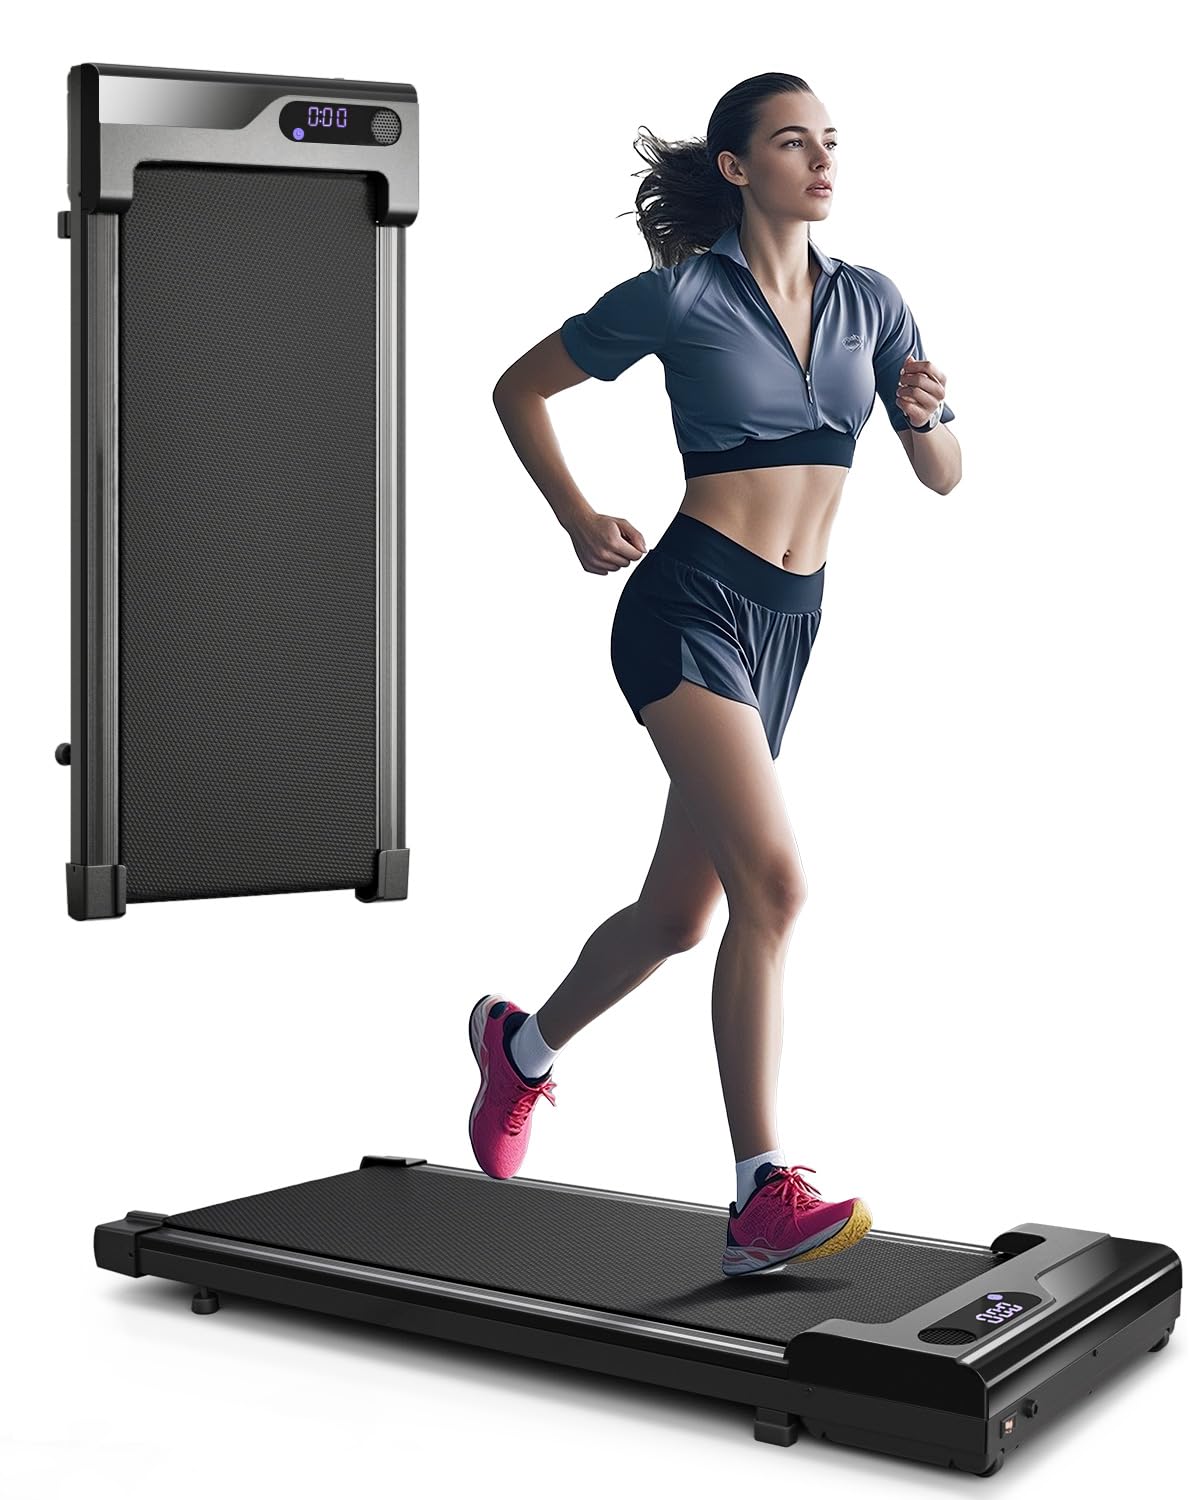 | ...> Treadmills | Zeporix | 189.9K | = | 4.71% | 8.51% | 100 | 0.58% | |||||||||||||||||||||||||||||||||||||||||||||||||||||||||||||||||||||||||||||||||||||||||||
 | ...> Treadmills | FOUSAE | 164.9K | = | 12.02% | 10.93% | < 50 | 0.78% | |||||||||||||||||||||||||||||||||||||||||||||||||||||||||||||||||||||||||||||||||||||||||||
 | ...> Treadmills | UREVO | 156.1K | = | 17.37% | 9.96% | < 50 | 16.57% | |||||||||||||||||||||||||||||||||||||||||||||||||||||||||||||||||||||||||||||||||||||||||||
| ...> Treadmills | Cazvian | 220.5K | = | 9.94% | 7.24% | < 50 | 17.34% | |||||||||||||||||||||||||||||||||||||||||||||||||||||||||||||||||||||||||||||||||||||||||||
| ...> Treadmills | Kerolina | 219.2K | = | 4.45% | 19.90% | 100 | 9.13% | |||||||||||||||||||||||||||||||||||||||||||||||||||||||||||||||||||||||||||||||||||||||||||
| ...> Treadmills | Zeporix | 189.9K | = | 4.71% | 8.51% | 100 | 0.58% | |||||||||||||||||||||||||||||||||||||||||||||||||||||||||||||||||||||||||||||||||||||||||||
| ...> Treadmills | FOUSAE | 164.9K | = | 12.02% | 10.93% | < 50 | 0.78% | |||||||||||||||||||||||||||||||||||||||||||||||||||||||||||||||||||||||||||||||||||||||||||
| ...> Treadmills | UREVO | 156.1K | = | 17.37% | 9.96% | < 50 | 16.57% | |||||||||||||||||||||||||||||||||||||||||||||||||||||||||||||||||||||||||||||||||||||||||||
What’s selling—and why Explore the top-performing products on Amazon based on product views, sales, and revenue.Spot trends, category winners, and emerging bestsellers at a glance. | |||||||||||||||||||||||||||||||||||||||||||||||||||||||||||||||||||||||||||||||||||||||||||||||||||