1月18日 的 Ham Solar | HAP Chart 應用程式分析
Ham Solar | HAP Chart
- Muhammad Zakwan
- Google Play 商店
- 免費版
- 工具
[INTRO]
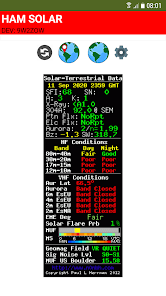
Ham Solar is using code from Paul, N0NBH website. Its requires internet connection.
[HAP CHART]
Hourly Area Prediction (HAP) chart feature is also provided by this app. Its specifies the Maximum Usable Frequency (MUF) for HF communications between the base specified and any location on the map. The colors represent the MUF for communications between that location on the map and the base selected.
Thus, if communications are required to or from Minneapolis, a HAP chart for Minneapolis should be used. The other end of the circuit is then found on the HAP chart and the color at that location gives the MUF for that circuit.
HAP charts are charts based on current ionospheric conditions observed with ionosondes in the region of interest. This chart is only valid for the current hour due to the highly variable nature of the ionosphere.
It is also helpful to view HAP chart propagation from the perspective of distant locations. In this manner you can determine if they are able to reach the Midwest with a usable MUF.
If you love this app, please kindly to rate it and give donation to Paul. Just inform me via email if you find any problems.This app is fully designed by using MIT App Inventor 2.
Regards, 9W2ZOW.
Ham Solar | HAP Chart 使用排名
基於 Similarweb 的算法,根據過去 28 天的安裝數和活躍用戶數進行計算。
所有類別 在
美國--
工具 在
美國#3,411
1月 18, 2026