

You’ve hit your search limit
Start your free trial to keep exploring full traffic and performance insights.
Get StartedNapkin: Stock Analysis app analytics for October 25

Napkin: Stock Analysis
- Shaun Tan
- Apple App Store
- Paid
- Finance
Napkin is where you think through what a company is worth.
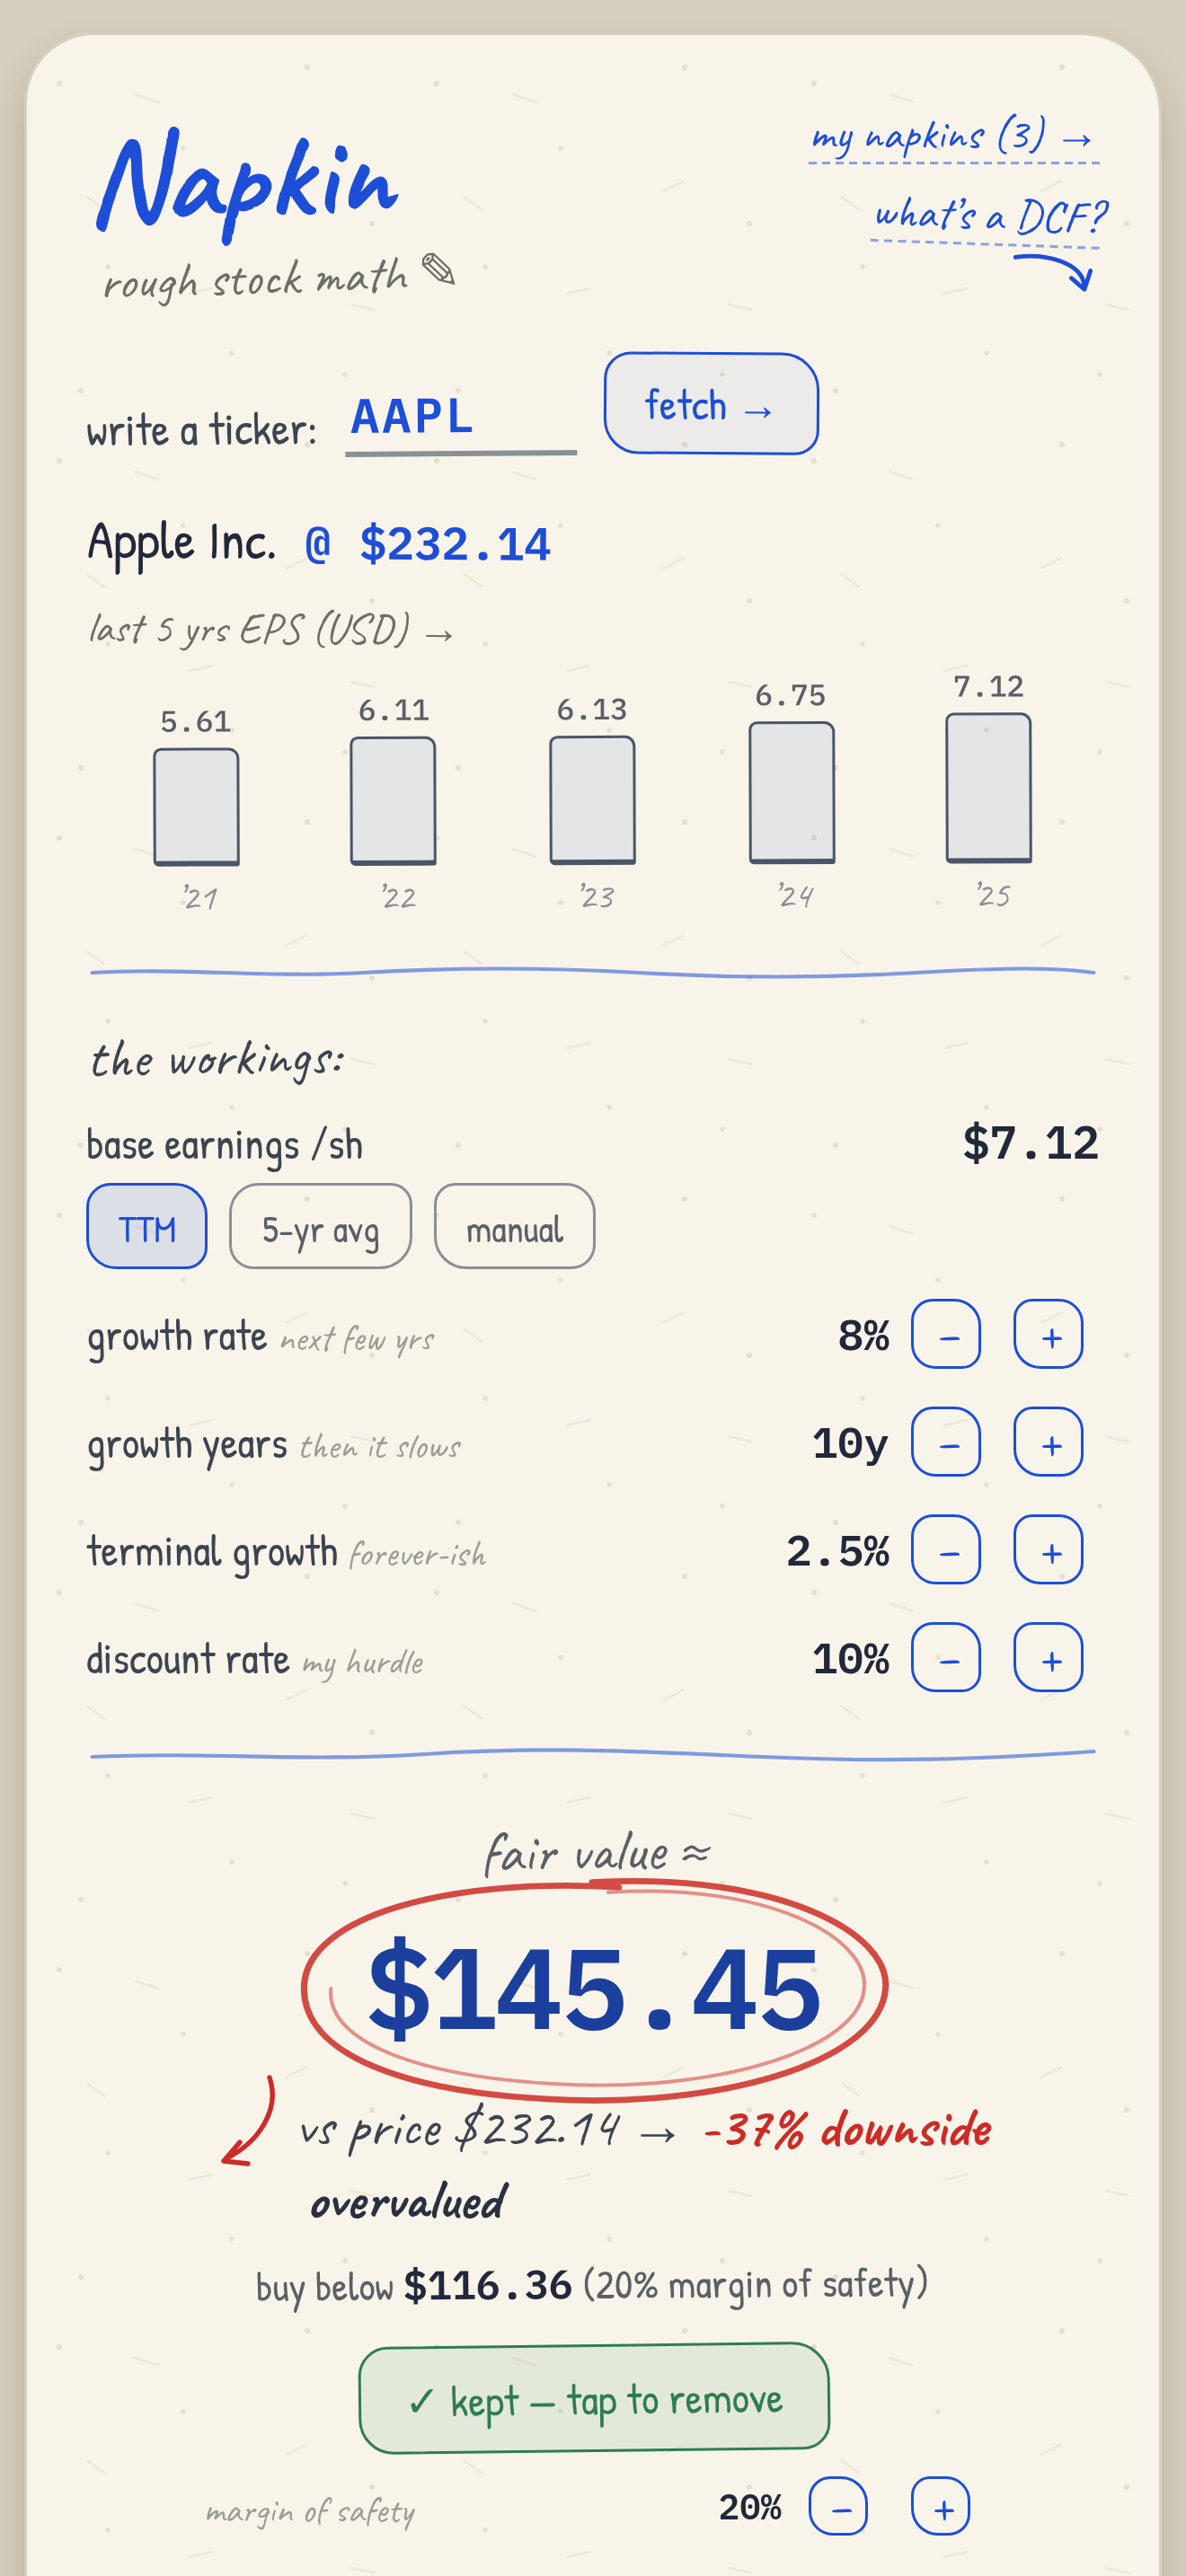
Pick a stock. Napkin pulls its price and five years of earnings, then hands you the assumptions — how fast it grows, for how long, what happens after that, and the return you demand. Change any of them and watch the valuation move.
The point was never one number. It is seeing how much has to go right.
ANALYSE ANY STOCK
Look up a company and Napkin shows you its earnings history as a chart, its current price, and what those earnings are worth today under your own assumptions. Start from the last twelve months, a five-year average, or a figure you enter yourself.
SEE HOW THE VALUATION REACTS
The grid is the heart of it. Twenty-five valuations at once, across five growth rates and five discount rates — and you choose every one of them. Want to see 14%, 20% and 40% growth against 10%, 15% and 20% discount rates? Type them in. Nothing is fixed, nothing is evenly spaced.
Cells are coloured against today's price, so one glance tells you whether a stock only works if everything goes right, or whether it holds up even when you are wrong.
ASK WHAT THE MARKET IS ALREADY ASSUMING
Run it backwards. Instead of guessing growth, Napkin solves for the growth rate that would justify today's price. When the market needs 14% a year for a decade, that is a claim you can accept or reject on its own terms.
BUILD A SHORTLIST
Keep any analysis and it joins your stack — price, fair value and upside for every company you are watching, side by side. Prices refresh when you open it. Your assumptions do not, so a change is always the market moving rather than the maths shifting under you. Tap any one to reopen it and keep working.
LEARN THE METHOD AS YOU GO
Flip the napkin over for a plain-English explanation of what a discounted cash flow actually is. Terminal growth, discount rates, margin of safety, and how to read the grid — written the way you would explain it to a friend, not the way a textbook would.
HONEST ABOUT WHAT IT IS
Napkin is deliberately rough. It uses earnings as a stand-in for free cash flow, which is a fair shortcut for steady businesses and a poor one for banks and heavy-capex companies. It will not tell you what a company is worth. It shows you what your assumptions imply — and where they stop holding up.
Not investment advice. No accounts, no analytics, no tracking. Everything you enter stays on your device.
Store Rank
The Store Rank is based on multiple parameters set by Google and Apple.
All Categories in
United States--
Finance in
United States--
Napkin: Stock AnalysisOctober 25, 2026