






The Top 100 Most Visited Websites in the USA (August 2026)
by Shai Belinsky10 Min.
Sep 29, 2026
 Ecommerce Intelligence
Your product could be the best in its category. But if a shopper searching “protein bar with no added sugar” can’t find it in the top results on Amazon, Walmart, or Target, that quality never gets to prove itself. The digital shelf spans every product listing, search ranking, rating, and piece of brand content across every retailer and marketplace, and it’s where the purchase decision now lives.
U.S. ecommerce accounted for 16.9% of total retail sales in Q1 2026 and grew 9.8% year-over-year, more than double the rate of total retail sales growth, nearly double the rate of total retail sales growth (U.S. Census Bureau, May 2026). That gap widens every quarter, and the brands winning now are pulling further ahead each time it does.
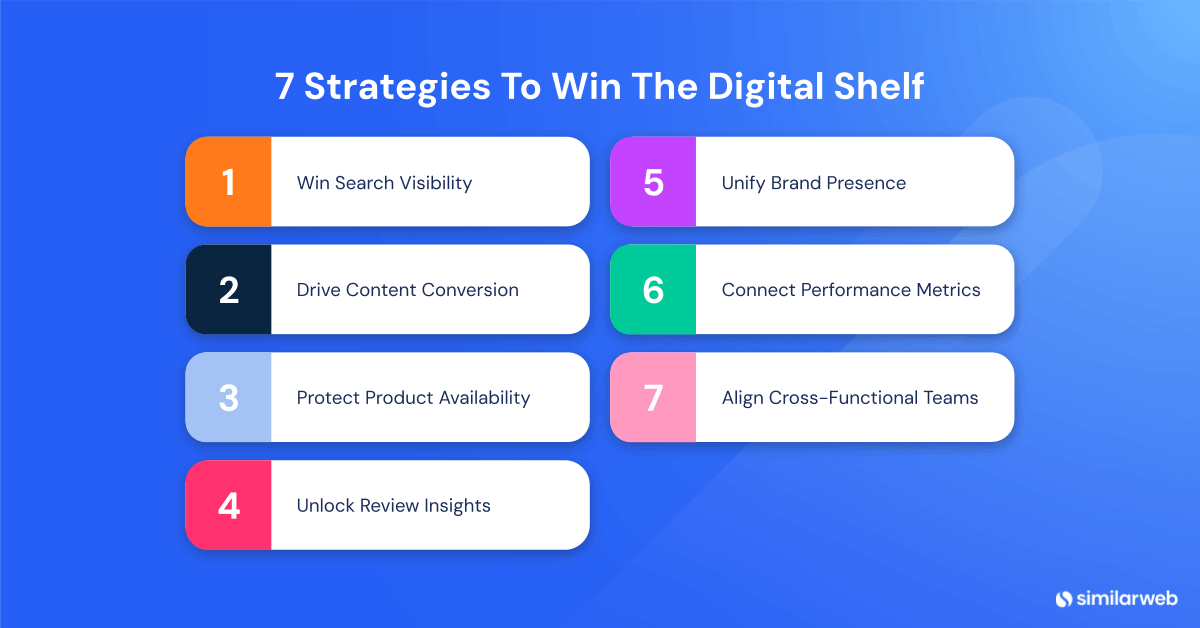
The brands consistently winning the digital shelf share seven execution habits. We’ve organized them into the SEARCH framework:
Plus the cross-functional glue that makes the other six work: team alignment.
Page one still matters, but it’s no longer the whole game. Salsify’s 2025 Consumer Research found that only 18% of shoppers stick to page-one-or-bust thinking; 41% will scroll to page three, and 26% will go as far as page five to find the right product. Visibility at the top of search still drives the fastest conversions, but brands that assume shoppers won’t scroll are increasingly wrong.
Retailer search algorithms combine keyword relevance, content completeness, availability, conversion rate, and review velocity. Amazon SEO, in particular, has become its own discipline, since Amazon’s algorithm (commonly called A9/A10) weighs these signals differently than Walmart’s or Target’s.
These factors feed each other: strong content converts better, which boosts rank further. On retail platforms, shoppers use short, literal queries (“women’s shoes under $150 for running”), so keyword research means mining autocomplete, competitor titles, and review language, not just traditional SEO tools. An Amazon-specific keyword tool can surface these patterns faster than generic SEO tools built for Google search.
The AI discovery layer raises the stakes further. Amazon reported that over 300 million customers used Rufus during 2025, with monthly active users growing 149% year-over-year, and that shoppers using Rufus are approximately 60% more likely to complete a purchase. In May 2026, Amazon retired the Rufus brand and folded the same assistant into Alexa for Shopping, a unified experience that now lives directly in Amazon’s main search bar across the app, website, and Echo devices.
On average, a third of the content on retail product pages is uninterpretable by large language models, limiting visibility in AI-generated recommendations. Optimizing for search now means writing content that both ranking algorithms and AI readers can parse.
Similarweb AI traffic tracker can show you AI-referred traffic to product pages, a signal most brands are currently attributing to “direct” when it’s actually coming from conversational shopping surfaces.
In this example, we see that Nike leads with an average of 339.7K monthly visits from AI platforms, while the category-wide spike in May 2026 signals accelerating adoption of conversational shopping.
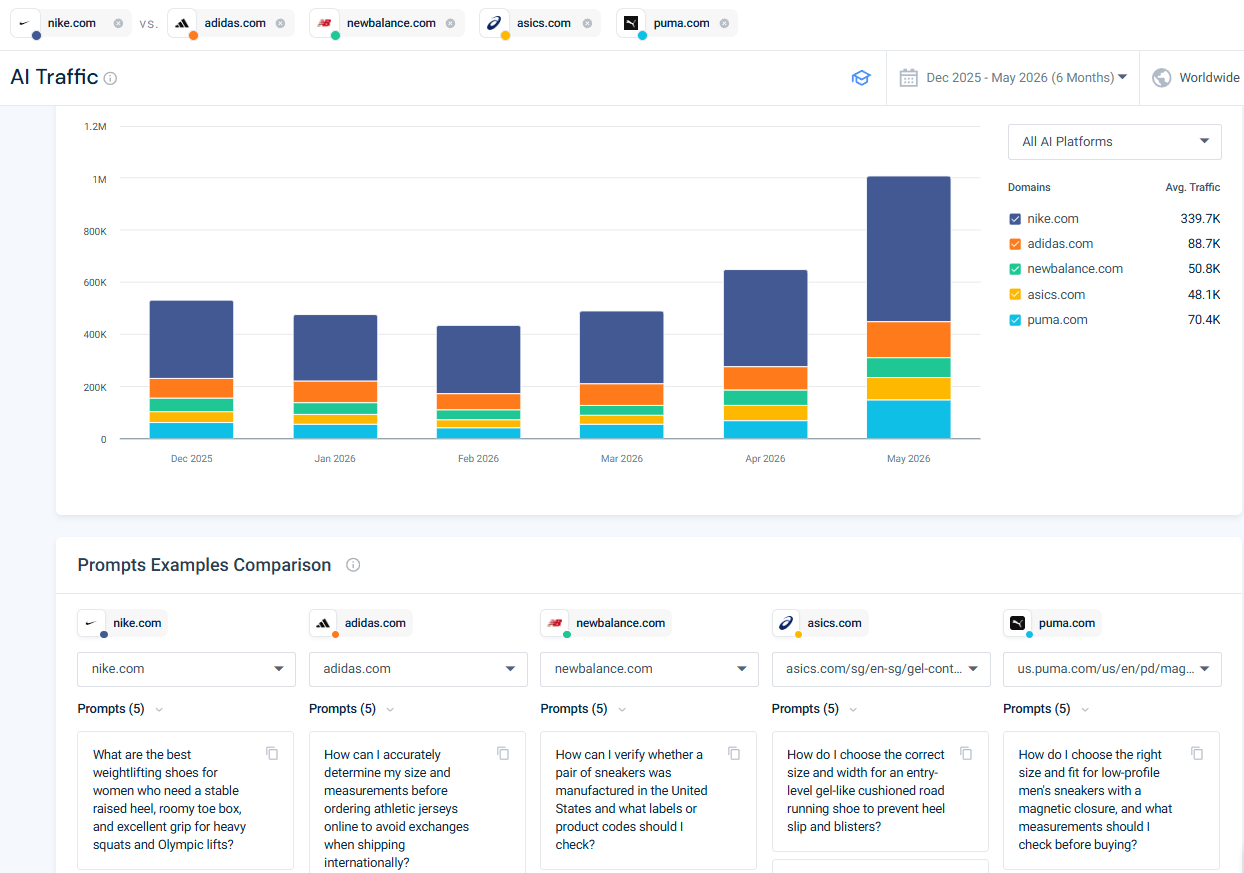
Similarweb AI Traffic data for five major sportswear brands (Dec 2025–May 2026).
Strong product content does two jobs: it helps the product rank, and it converts the shoppers who arrive. The tension is that content improvements that help ranking, like keyword density and attribute completeness, can conflict with content designed to convert, like benefit-led copy and emotional storytelling. Winning brands resolve this tension rather than optimizing for one side.
The most common failure is inconsistency, not poor content quality on any single listing. A brand may have excellent hero imagery on Amazon but a blurry thumbnail on a third-party marketplace, benefit-driven bullets on its DTC site but spec-only descriptions on the retailer portal. That inconsistency actively suppresses ranking on platforms with content quality scoring built into their algorithms. Digital shelf analytics tools generate content compliance and completeness scores SKU by SKU and retailer by retailer, so brands can prioritize the lowest-scoring assets.
In this example, a Samsung Galaxy Tab A9+ listing on conrad.de is evaluated across title, description, bullet points, and images, with character counts and similarity scores compared against targets.
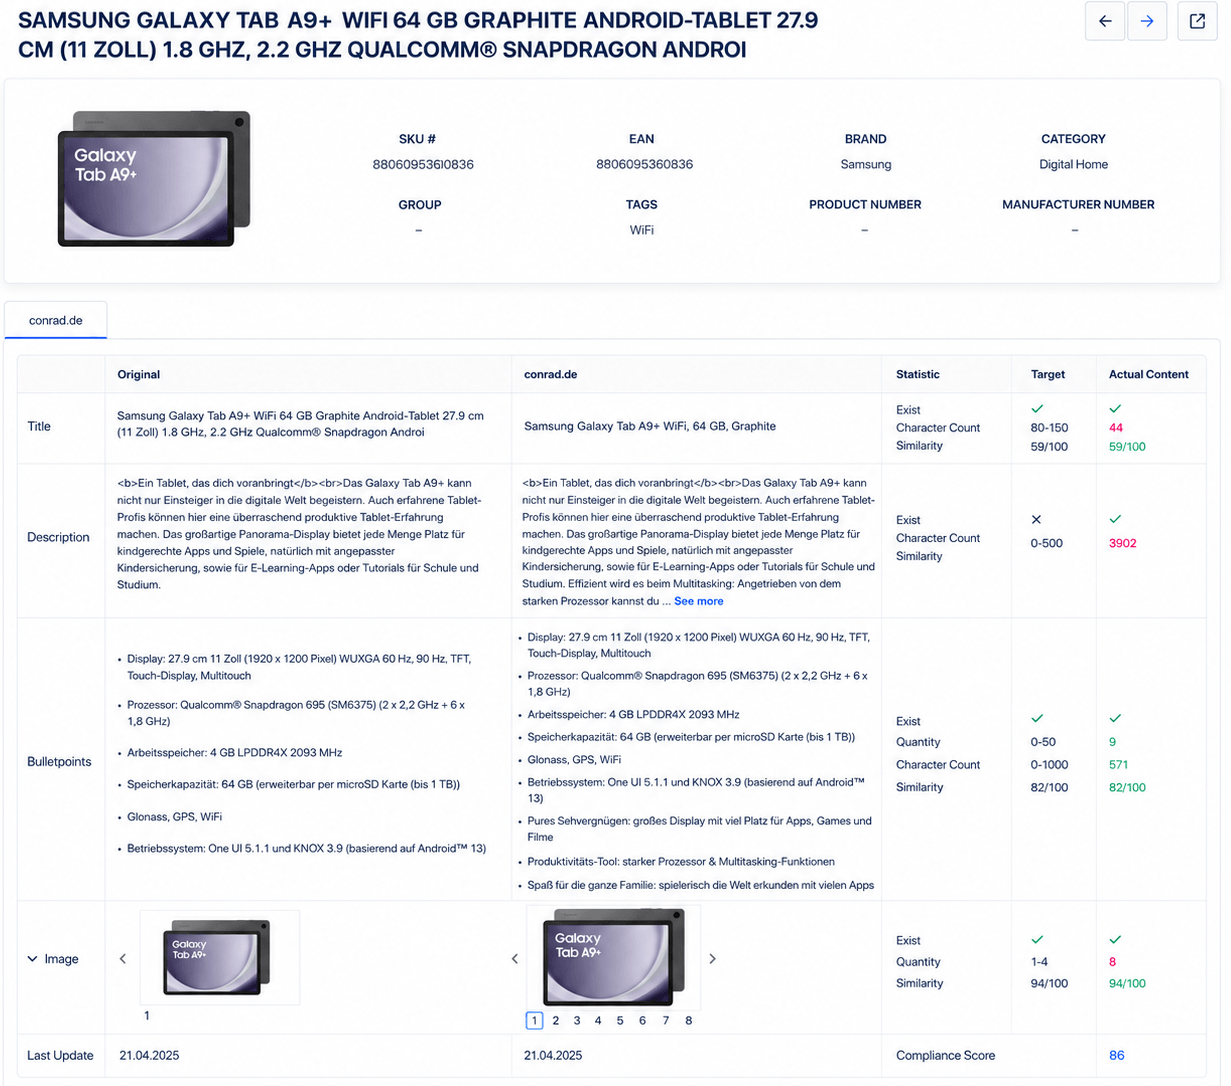
Content compliance scoring at the SKU level
The best content also anticipates shopper doubt before it becomes a reason not to buy. Review content is the richest source of unresolved questions: if the same concern appears repeatedly in one-star reviews, it belongs in the product description. In categories where performance is the purchase driver, a 30- to 60-second demonstration video consistently outperforms any static asset combination for conversion lift.
Going out of stock costs more than the immediate transaction. Retailer algorithms treat availability as a ranking signal. So a stock gap suppresses search position even after inventory is restored. The next shopper searching your category may never see your product at all. Running paid media on out-of-stock items makes the damage worse.
Most inventory systems are designed for the supply chain, not the digital shelf. They report warehouse stock levels but don’t connect to real-time shopper demand at the category level or regional distribution gaps. Similarweb’s Amazon IQ tracks real-time product-level demand signals across the world’s largest marketplace, connecting availability monitoring to actual shopper behavior data so inventory decisions are made against demand, not just stock counts.
Consistent availability also builds retailer confidence. On Amazon specifically, it factors directly into Buy Box eligibility. A brand that fills orders reliably and flags risk before it becomes a problem earns better initial placement, inclusion in promotional programs, and more favorable shelf allocation. Those advantages create an edge that out-of-stock competitors can’t easily replicate.
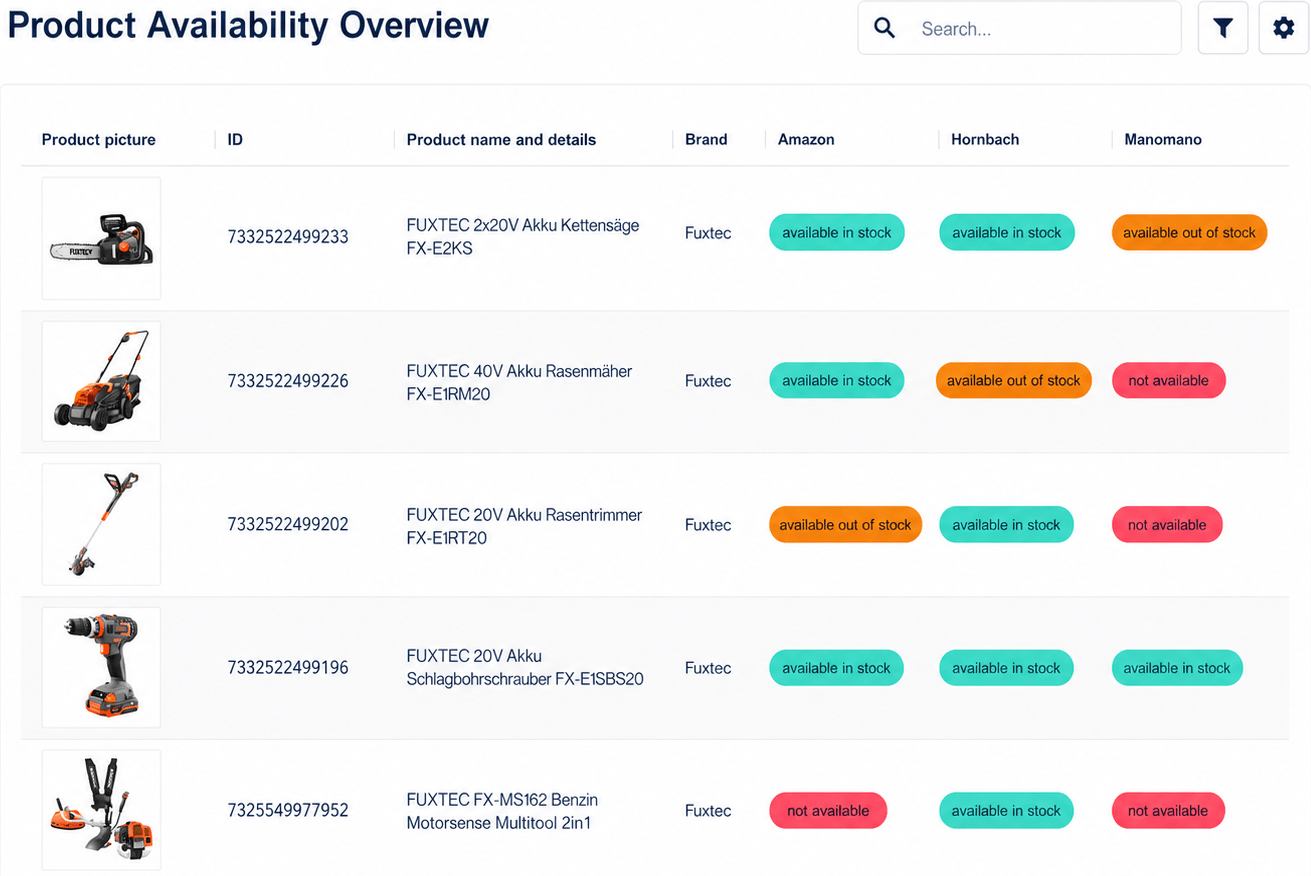
See this example: you get real-time product availability across Amazon, Hornbach, ManoMano, and any other retailers selling your products. Similarweb’s digital shelf solution flags out-of-stock and unavailable listings by retailer, so brands can spot and fix availability gaps before they impact sales.
Shoppers treat ratings and reviews as the most reliable signal available because they come from people with no commercial stake in the decision. Products with more reviews convert at substantially higher rates than those with none. Review velocity also influences search rank directly: regular new reviews signal continued demand.
The starting point is the product experience itself. No review generation tactic compensates for a product that consistently disappoints. For legitimate ways to get more Amazon reviews: post-purchase follow-up via retailer communication programs and packaging inserts that invite feedback (without incentivizing positive reviews, which violates platform policies).
Negative review response is an underused conversion lever. A well-handled response to a one-star review demonstrates brand accountability to every shopper reading that thread. Brands that respond consistently tend to see meaningful sentiment improvements within 60 to 90 days.
Reviews are also one of the fastest issue-detection tools available if someone is watching for the pattern rather than the average rating alone. A cluster of negative reviews arriving in a short window is rarely random: it usually points to a fixable root cause, maybe a wrong product description, a manufacturing defect, a packaging change, or a fulfillment problem with a specific retailer or warehouse. Catching that cluster early and tracing it to the cause lets a brand fix the actual problem, not just the symptom, before it drags down the rating long-term.
Similarweb’s Retail Intelligence monitors ratings and review trends across the digital shelf, using AI to group feedback themes and surface the issues most influencing shopper trust and purchase behavior.
This is where most brands have the largest untapped opportunity. Search optimization and review management are widely practiced. The consistency of brand execution, in titles, imagery, pricing, descriptions, and enhanced content, across dozens of retailer portals is where the gap between leading brands and the rest is widest.
Product content gets created once and syndicated. Over time, retailers update templates, change character limits, and adjust image requirements. The brand’s story fragments. A shopper comparing the same product on Amazon, Target, and a third-party marketplace sees three slightly different versions of the brand, and that inconsistency chips away at trust without anyone on the brand team noticing.
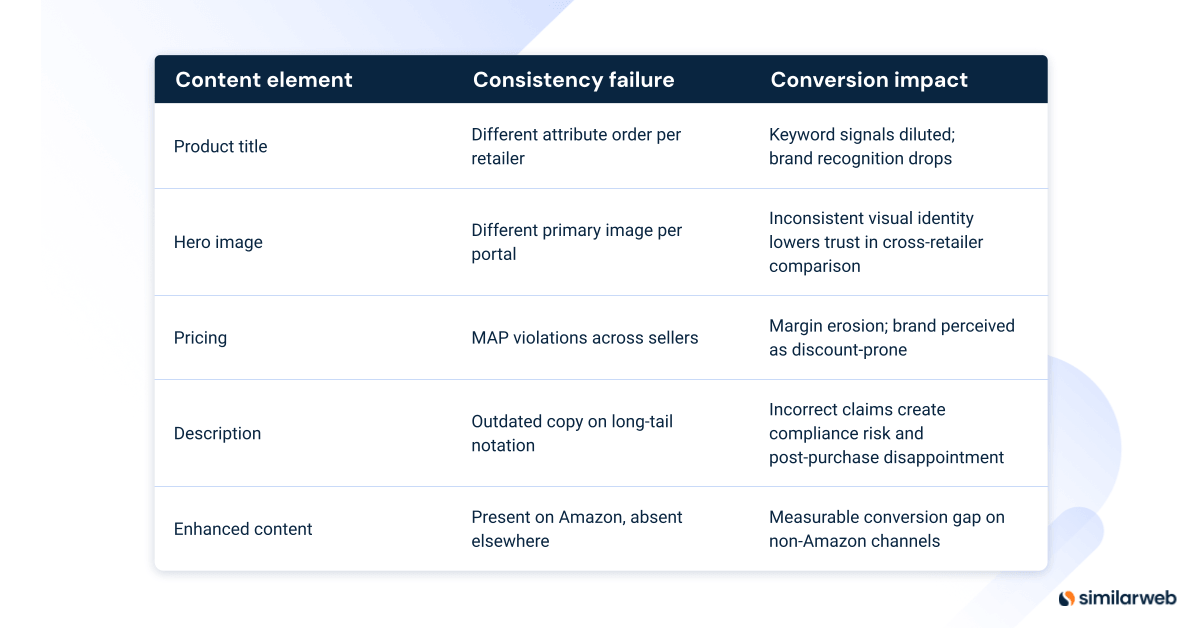
Digital shelf analytics platforms, including Similarweb’s, track product content across retailers and flag deviations: missing images, below-threshold descriptions, pricing inconsistencies, and gaps in enhanced brand content or A+ content. This turns content governance into an ongoing quality check instead of a cleanup job.
The brands that consistently outperform have one operational characteristic in common: they use performance data to make decisions, not to explain what already happened. Most digital shelf reporting is backward-looking, weekly or monthly rollups with little connection to the decision that needs to happen next.
But tracking the right metrics is only half the job. A single metric, viewed in isolation, tells you that something changed. It rarely tells you why, or what to do about it, or whether it’s even worth fixing compared to everything else competing for the team’s attention.
The brands that get the most out of their data go a level deeper: they link metrics from different areas of the business so that one number provides context for another. That linking is where prioritization actually happens.
Four examples show what this looks like in practice:
A drop in share of search means little on its own. The useful next step is to look at the actual keywords and their search volume for that product, then use that information to enhance the product content: working the highest-volume terms more deliberately into the title, bullets, and backend fields. This link turns a generic alert into a concrete content fix.
A content quality score tells you a listing is incomplete. It doesn’t tell you what’s actually missing in the shopper’s mind. Reviews do. When a product’s content quality score is low and reviews repeatedly mention the same confusion, like wrong size guidance, unclear ingredients, or missing usage instructions, that’s not a coincidence: the gap in the listing is the gap shoppers are describing. Linking the two turns the review text into a content brief.
Share of shelf shows where you’re visible relative to competitors, but visibility alone doesn’t tell you where the upside is. Running a proper competitor analysis on Amazon and comparing share of shelf against competitor sales performance for the same category shows where a visibility gap is actually costing revenue, versus where a competitor is visible but not converting. That distinction determines whether the right response is a content or pricing fix, or simply a category where the competitive bar is lower than it looks.
An out-of-stock SKU is a problem on its own. An out-of-stock SKU with paid media or a retailer promotion still running against it is a different order of problem: budget is actively being spent to drive traffic to a page that can’t convert. Linking inventory data to the promotional calendar catches this before the spend happens, not after the campaign report shows a conversion rate that doesn’t make sense.
These examples don’t need a new metric, just treating the metrics you already track as connected, not as separate dashboards owned by separate teams. Getting there also requires the right team structure, since cross-metric thinking breaks down fast if the teams that own each metric never talk to each other.
Similarweb’s Retail Intelligence is built around this kind of cross-metric view, joining search, content, pricing, availability, and competitive data so a change in one area surfaces its likely cause and its likely cost elsewhere, rather than landing as an isolated data point that someone has to go investigate manually.
Teams working from different data and different priorities produce collectively suboptimal results. Marketing, supply chain, ecommerce, and trade each influence the product listing a shopper sees, but rarely operate on the same KPI rhythm. Marketing runs a campaign on a product supply chain that knows it will be short-staffed in three weeks. Ecommerce updates content without coordinating with the concurrent promotional pricing change. Analytics reports on performance that no single team has the ownership to fix.
The real cause is ownership: no single function traditionally owns the digital shelf the way someone owns a media budget. The fix is a shared data layer and explicit KPI ownership by function:
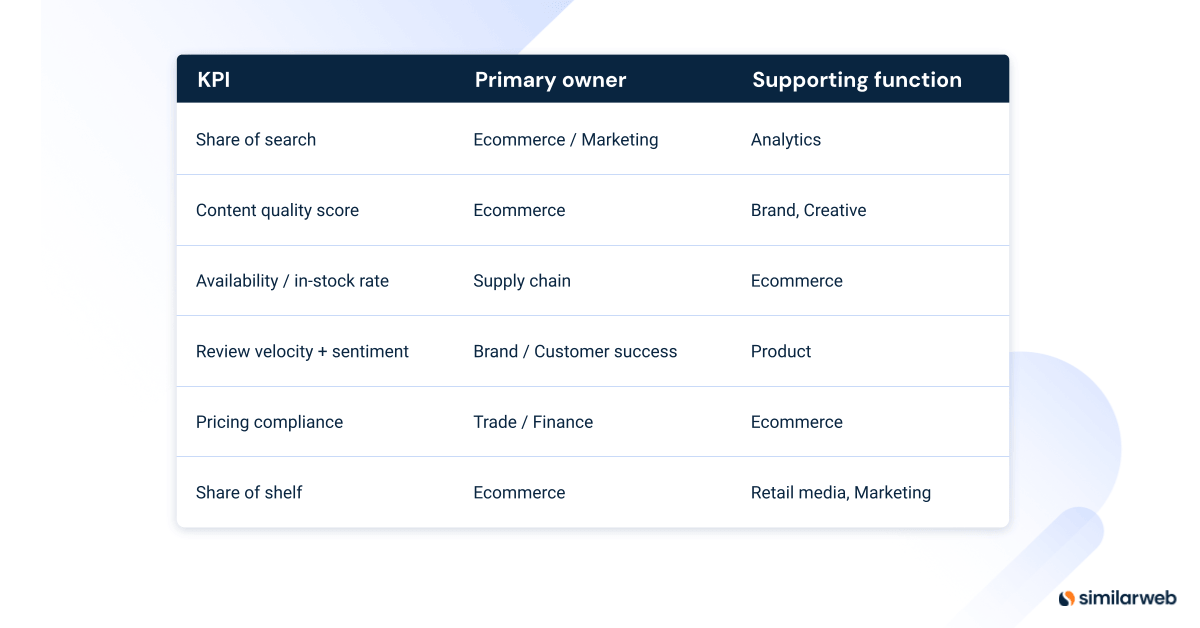
A 2025 survey of more than 100 CPG manufacturers by Acosta Group found that establishing ecommerce KPIs and digital shelf monitoring were among the top cross-functional challenges brands face. The data exists. What’s missing is clear ownership and a review cadence. Brands that resolve this tend to catch and respond to competitive shelf events while they’re still small, rather than after they’ve shown up in a quarterly report.
The brands that hold shelf position long-term are not necessarily the ones with the biggest budgets or the most SKUs. They are the ones who have built consistent execution habits across search, content, availability, reviews, and brand consistency.
Each of the seven digital shelf strategies in the SEARCH framework reinforces the others: strong content improves search rank, which drives more conversion data, which sharpens future optimization decisions. Availability protects the search position that content worked to earn.
Reviews surface the product and description issues that content teams need to fix. A consistent brand story ensures that the investment made in one retail channel carries through to every other. And none of it works the way it should if the teams responsible for each piece are not working from the same data and the same priorities.
The digital shelf does not reward one-time projects. It rewards brands that have turned these habits into an operational rhythm. Use the SEARCH framework as the structure for that rhythm.
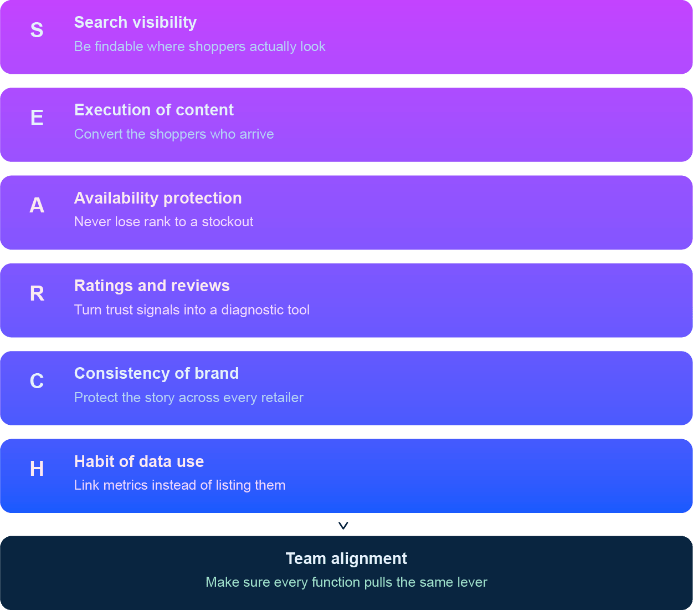
The seven strategies work as one system, not seven separate projects:
Similarweb Retail Intelligence covers 650+ online storefronts, so brands can benchmark availability, content, and competitive positioning across the full breadth of where their shoppers actually buy. Explore Similarweb Retail Intelligence.
What is the digital shelf?
The digital shelf is the online environment where products are discovered, evaluated, and purchased, including retailer search results, category pages, product detail pages, ratings and reviews, and AI shopping assistant recommendations. It functions like a physical store shelf, but is algorithm-driven, dynamic, and visible across multiple retailers and marketplaces simultaneously.
Does content quality affect search rank on retailer platforms?
Yes, directly. Major retail platforms, including Amazon and Walmart, use content quality scores as a ranking signal. Products with incomplete titles, missing attributes, or below-threshold image counts may be ineligible for top positions regardless of conversion history. Content quality is both a search and conversion driver.
What is the share of search on the digital shelf?
Share of search measures the percentage of total search clicks your products receive for relevant category keywords on a specific platform. Changes in share of search typically precede revenue changes by four to eight weeks, making it one of the most valuable early-warning metrics in digital shelf analytics.
How do I know which digital shelf issue to fix first?
Don’t look at metrics in isolation: look for where two signals point to the same root cause. A drop in share of search paired with low keyword coverage in your title points to a content fix. A low content quality score paired with reviews describing the same confusion points to a specific missing detail, not a general content refresh. An out-of-stock SKU with active paid media pointed at it should be fixed before anything else, since budget is being wasted in real time. Linking metrics this way turns a long list of issues into a short list of issues worth fixing now.
Is it realistic for a brand managing hundreds of SKUs to execute all seven strategies simultaneously?
Not all at once, and that’s not the goal. Most brands start with search visibility and content, since those two reinforce each other quickly, plus availability, which is the floor for everything else. Reviews and brand consistency follow as the team builds rhythm. Linking data analytics across departments and team alignment matures last. The SEARCH framework works as a maturity model: identify where you are strongest, address the weakest link, and expand from there.

by Ida Lorenz
Content Writer & Marketing Manager
Ida is a Content Writer & Marketing Manager at XPLN, specializing in Digital Shelf Analytics, ecommerce, and digital transformation. With 18 years of experience in B2B marketing, she transforms complex data and technical concepts into clear, actionable content that helps businesses navigate the evolving digital commerce landscape. She holds a Diploma in Media Studies with a focus on Media Informatics from the University of Paderborn, Germany, and is also a certified Graphic Design Assistant. Her published articles combine data-driven insights with compelling storytelling to help companies understand how the digital world is changing and what it means for their business. Outside of work, she enjoys reading, hiking, spending time with her family, and discovering great coffee.
The Top 100 Most Visited Websites in the USA (August 2026)
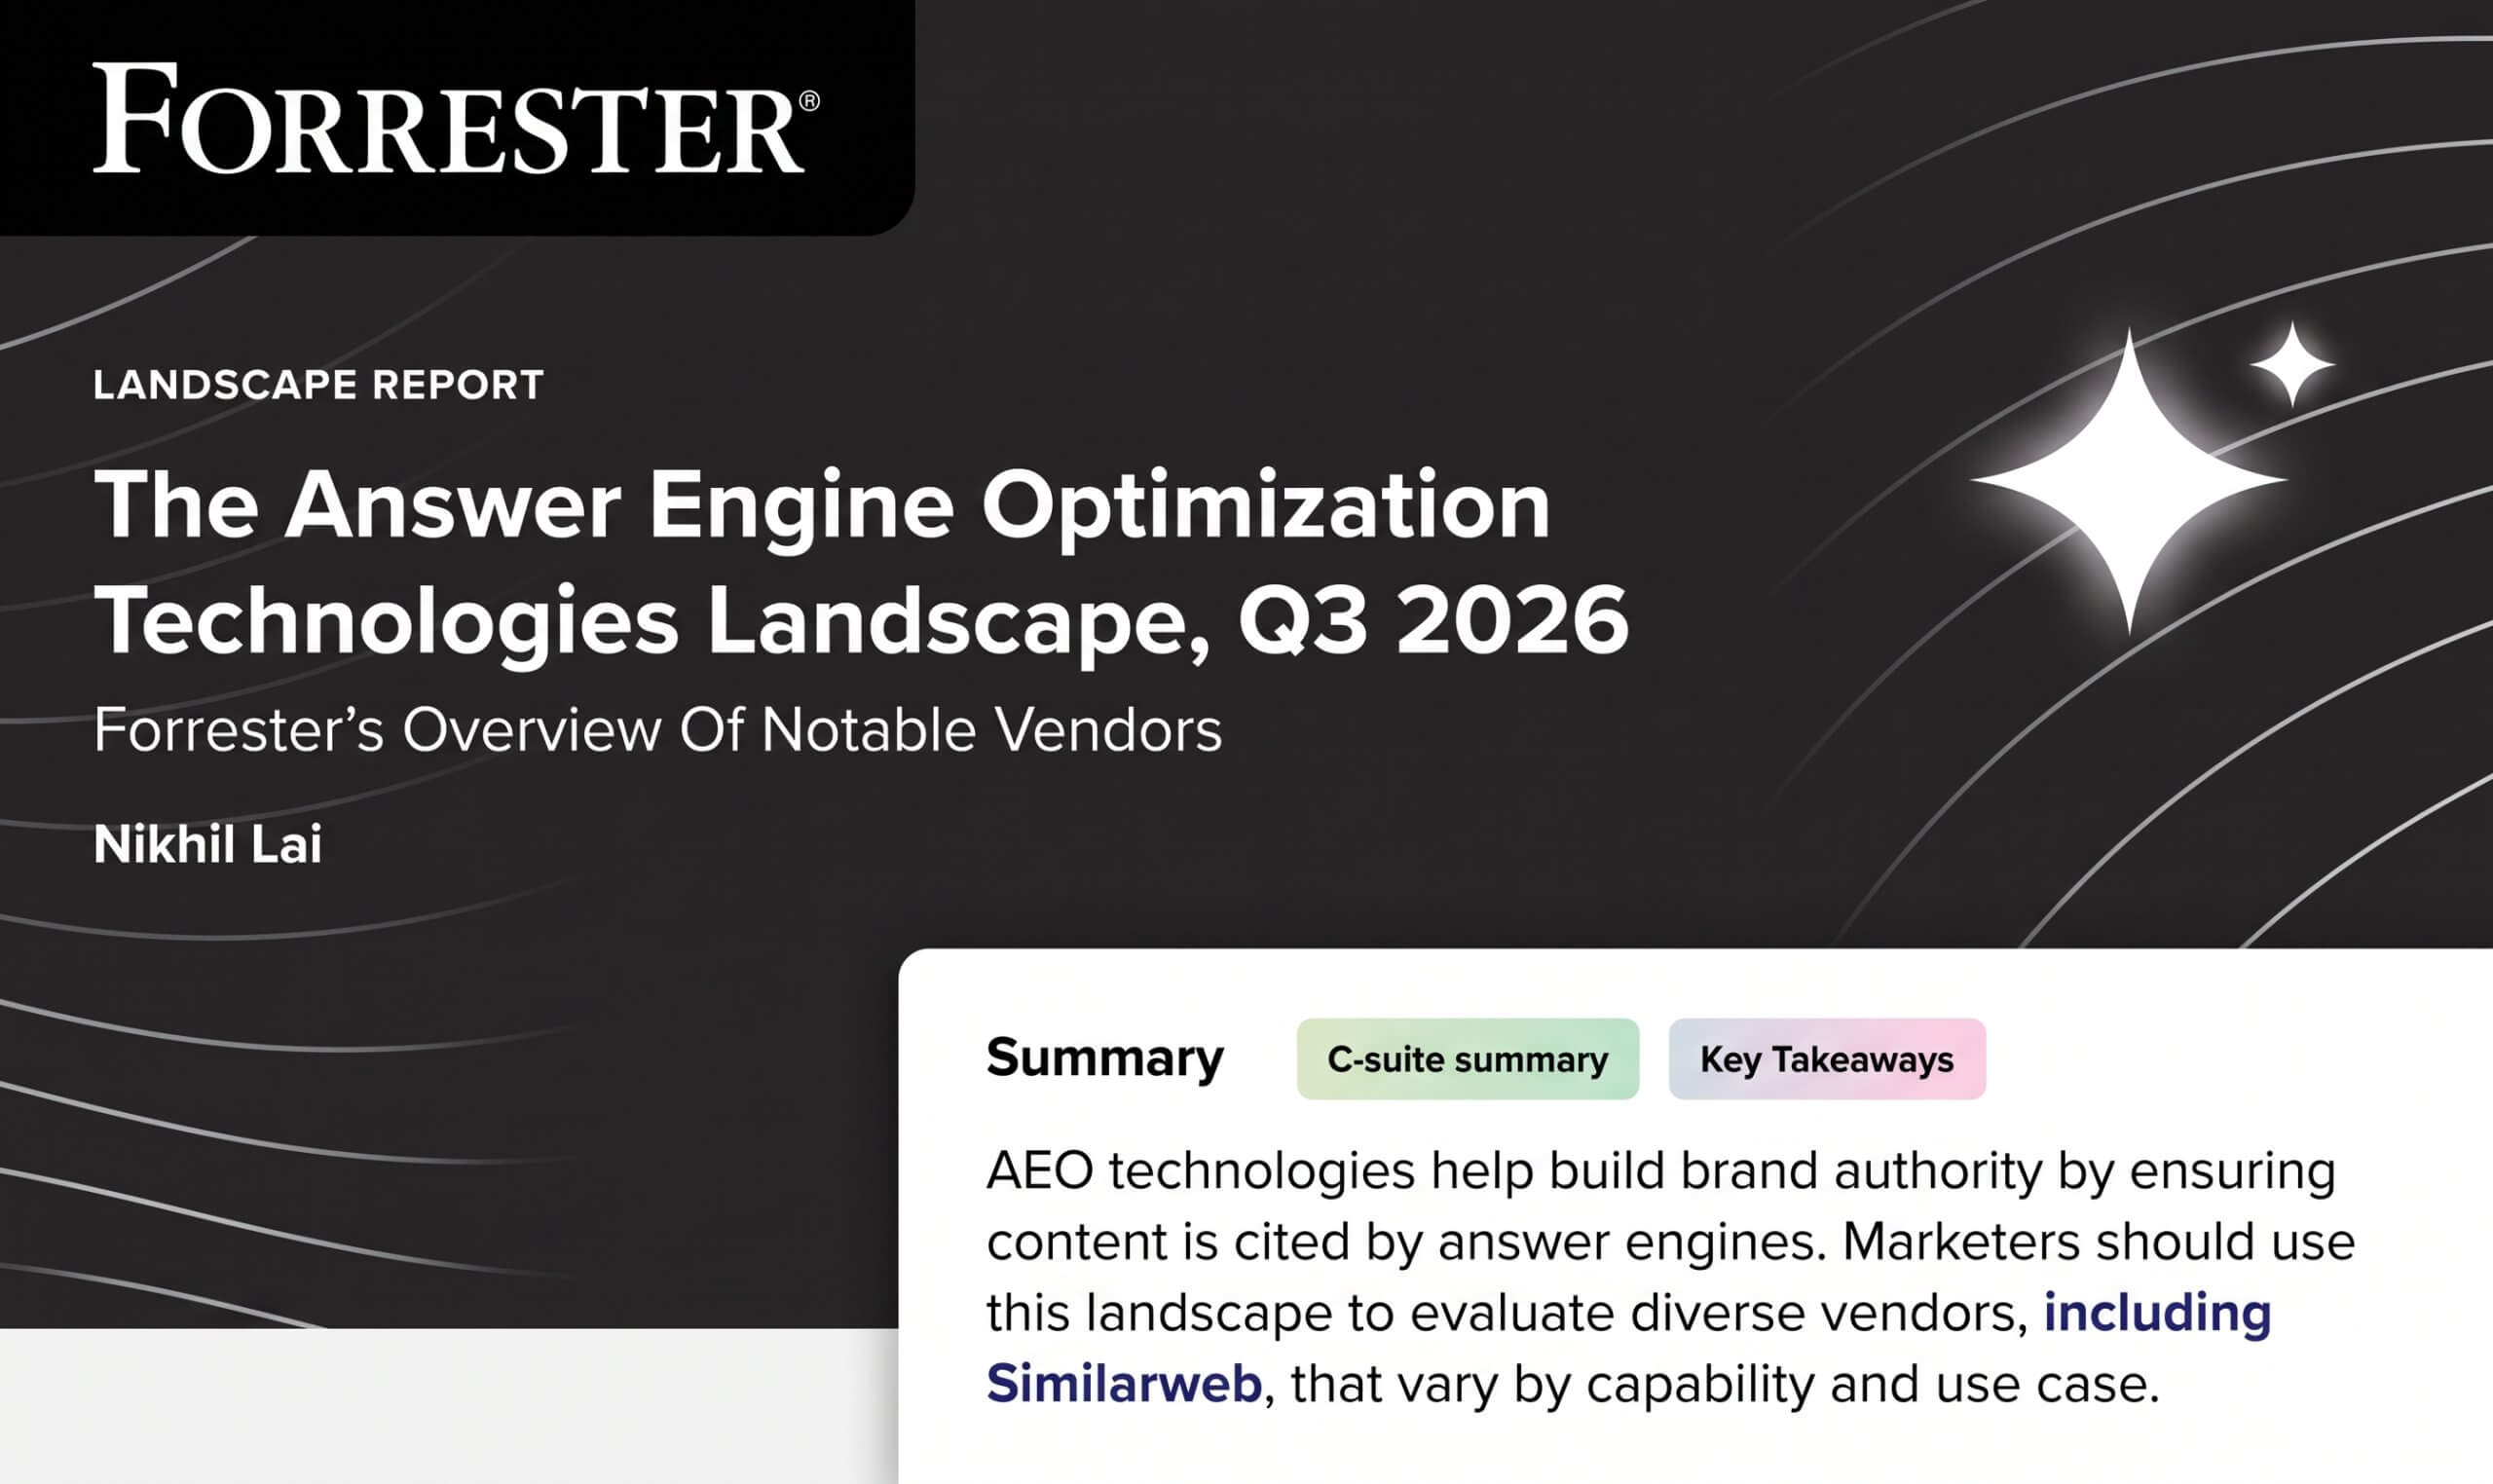
Similarweb Named in Forrester's Answer Engine Optimization Technologies Landscape, Q3 2026
Anthropic IPO: What Claude's Web and App Data Show
Put the full picture at your fingertips to drive product views and sales
