

Best Selling Video Games Products & Brands on amazon.ca
See the full list of Market Leaders In Amazon Video Games in amazon.ca for October 1, and read the full analysis below
Last updated : October 1, 2026
Top Brands on the Video Games category
See which brands are leading the Video Games category on amazon.ca. Analyze data on top brands, including their revenue, product views, and conversion rates, offering a clear picture of brand competitiveness within the category.
| Brand | Revenue share | Change | Product views | Change | CVR | Change | ASP | Change | |||||||||||||||||||||||||||||||||||||||||||||||||||||||||||||||||||||||||||||||||||||||||||
|---|---|---|---|---|---|---|---|---|---|---|---|---|---|---|---|---|---|---|---|---|---|---|---|---|---|---|---|---|---|---|---|---|---|---|---|---|---|---|---|---|---|---|---|---|---|---|---|---|---|---|---|---|---|---|---|---|---|---|---|---|---|---|---|---|---|---|---|---|---|---|---|---|---|---|---|---|---|---|---|---|---|---|---|---|---|---|---|---|---|---|---|---|---|---|---|---|---|---|---|
| Nintendo | 25.43% | 8.78pp | 1.5M | 10.08% | 6.46% | 73.49% | CDN$193.21 | 5.77% | |||||||||||||||||||||||||||||||||||||||||||||||||||||||||||||||||||||||||||||||||||||||||||
| PlayStation | 17.35% | 3.85pp | 1.1M | 5.13% | 5.35% | 5.06% | CDN$105.48 | 0.70% | |||||||||||||||||||||||||||||||||||||||||||||||||||||||||||||||||||||||||||||||||||||||||||
| Xbox | 8.89% | 2.93pp | 1M | 9.52% | 6.44% | 73.16% | CDN$188.60 | 3.77% | |||||||||||||||||||||||||||||||||||||||||||||||||||||||||||||||||||||||||||||||||||||||||||
| Capcom | 0.99% | 0.81pp | 1.4M | 4.78% | 6.07% | 73.13% | CDN$159.66 | 4.39% | |||||||||||||||||||||||||||||||||||||||||||||||||||||||||||||||||||||||||||||||||||||||||||
| Redragon | 1.97% | 0.68pp | 334.3K | 3.64% | 2.26% | 31.32% | CDN$192.27 | 3.51% | |||||||||||||||||||||||||||||||||||||||||||||||||||||||||||||||||||||||||||||||||||||||||||
Who’s winning your category? See top brands by revenue, views, and conversion rate. | |||||||||||||||||||||||||||||||||||||||||||||||||||||||||||||||||||||||||||||||||||||||||||||||||||
Channels Breakdown & Performance
Understand where the top brands in the Video Games category get their traffic. This section breaks down the leading traffic sources, revealing which channels drive the most visibility and sales for top-performing brands.
See how top brands drive traffic and sales on Amazon.
See full channel breakdownTop selling sub-categories in the Video Games category
Explore the breakdown of sub-categories within the Video Games category. This section provides insights into the performance of different sub-categories, helping to identify which segments are growing, which are most competitive, and where consumer interest is shifting.
Top Products on the Video Games Category
Discover the most-viewed products in the Video Games category. This section highlights the top-performing products based on product views, revenue, and units sold, giving a snapshot of what’s driving consumer interest and purchases.
| Product | Category | Brand | Product Views | Change | Revenue | Change | Units Sold | Change | |||||||||||||||||||||||||||||||||||||||||||||||||||||||||||||||||||||||||||||||||||||||||||
|---|---|---|---|---|---|---|---|---|---|---|---|---|---|---|---|---|---|---|---|---|---|---|---|---|---|---|---|---|---|---|---|---|---|---|---|---|---|---|---|---|---|---|---|---|---|---|---|---|---|---|---|---|---|---|---|---|---|---|---|---|---|---|---|---|---|---|---|---|---|---|---|---|---|---|---|---|---|---|---|---|---|---|---|---|---|---|---|---|---|---|---|---|---|---|---|---|---|---|---|
 | ...> Consoles | PlayStation | 198.5K | = | 1.26% | 14.81% | 89 | 1.68% | |||||||||||||||||||||||||||||||||||||||||||||||||||||||||||||||||||||||||||||||||||||||||||
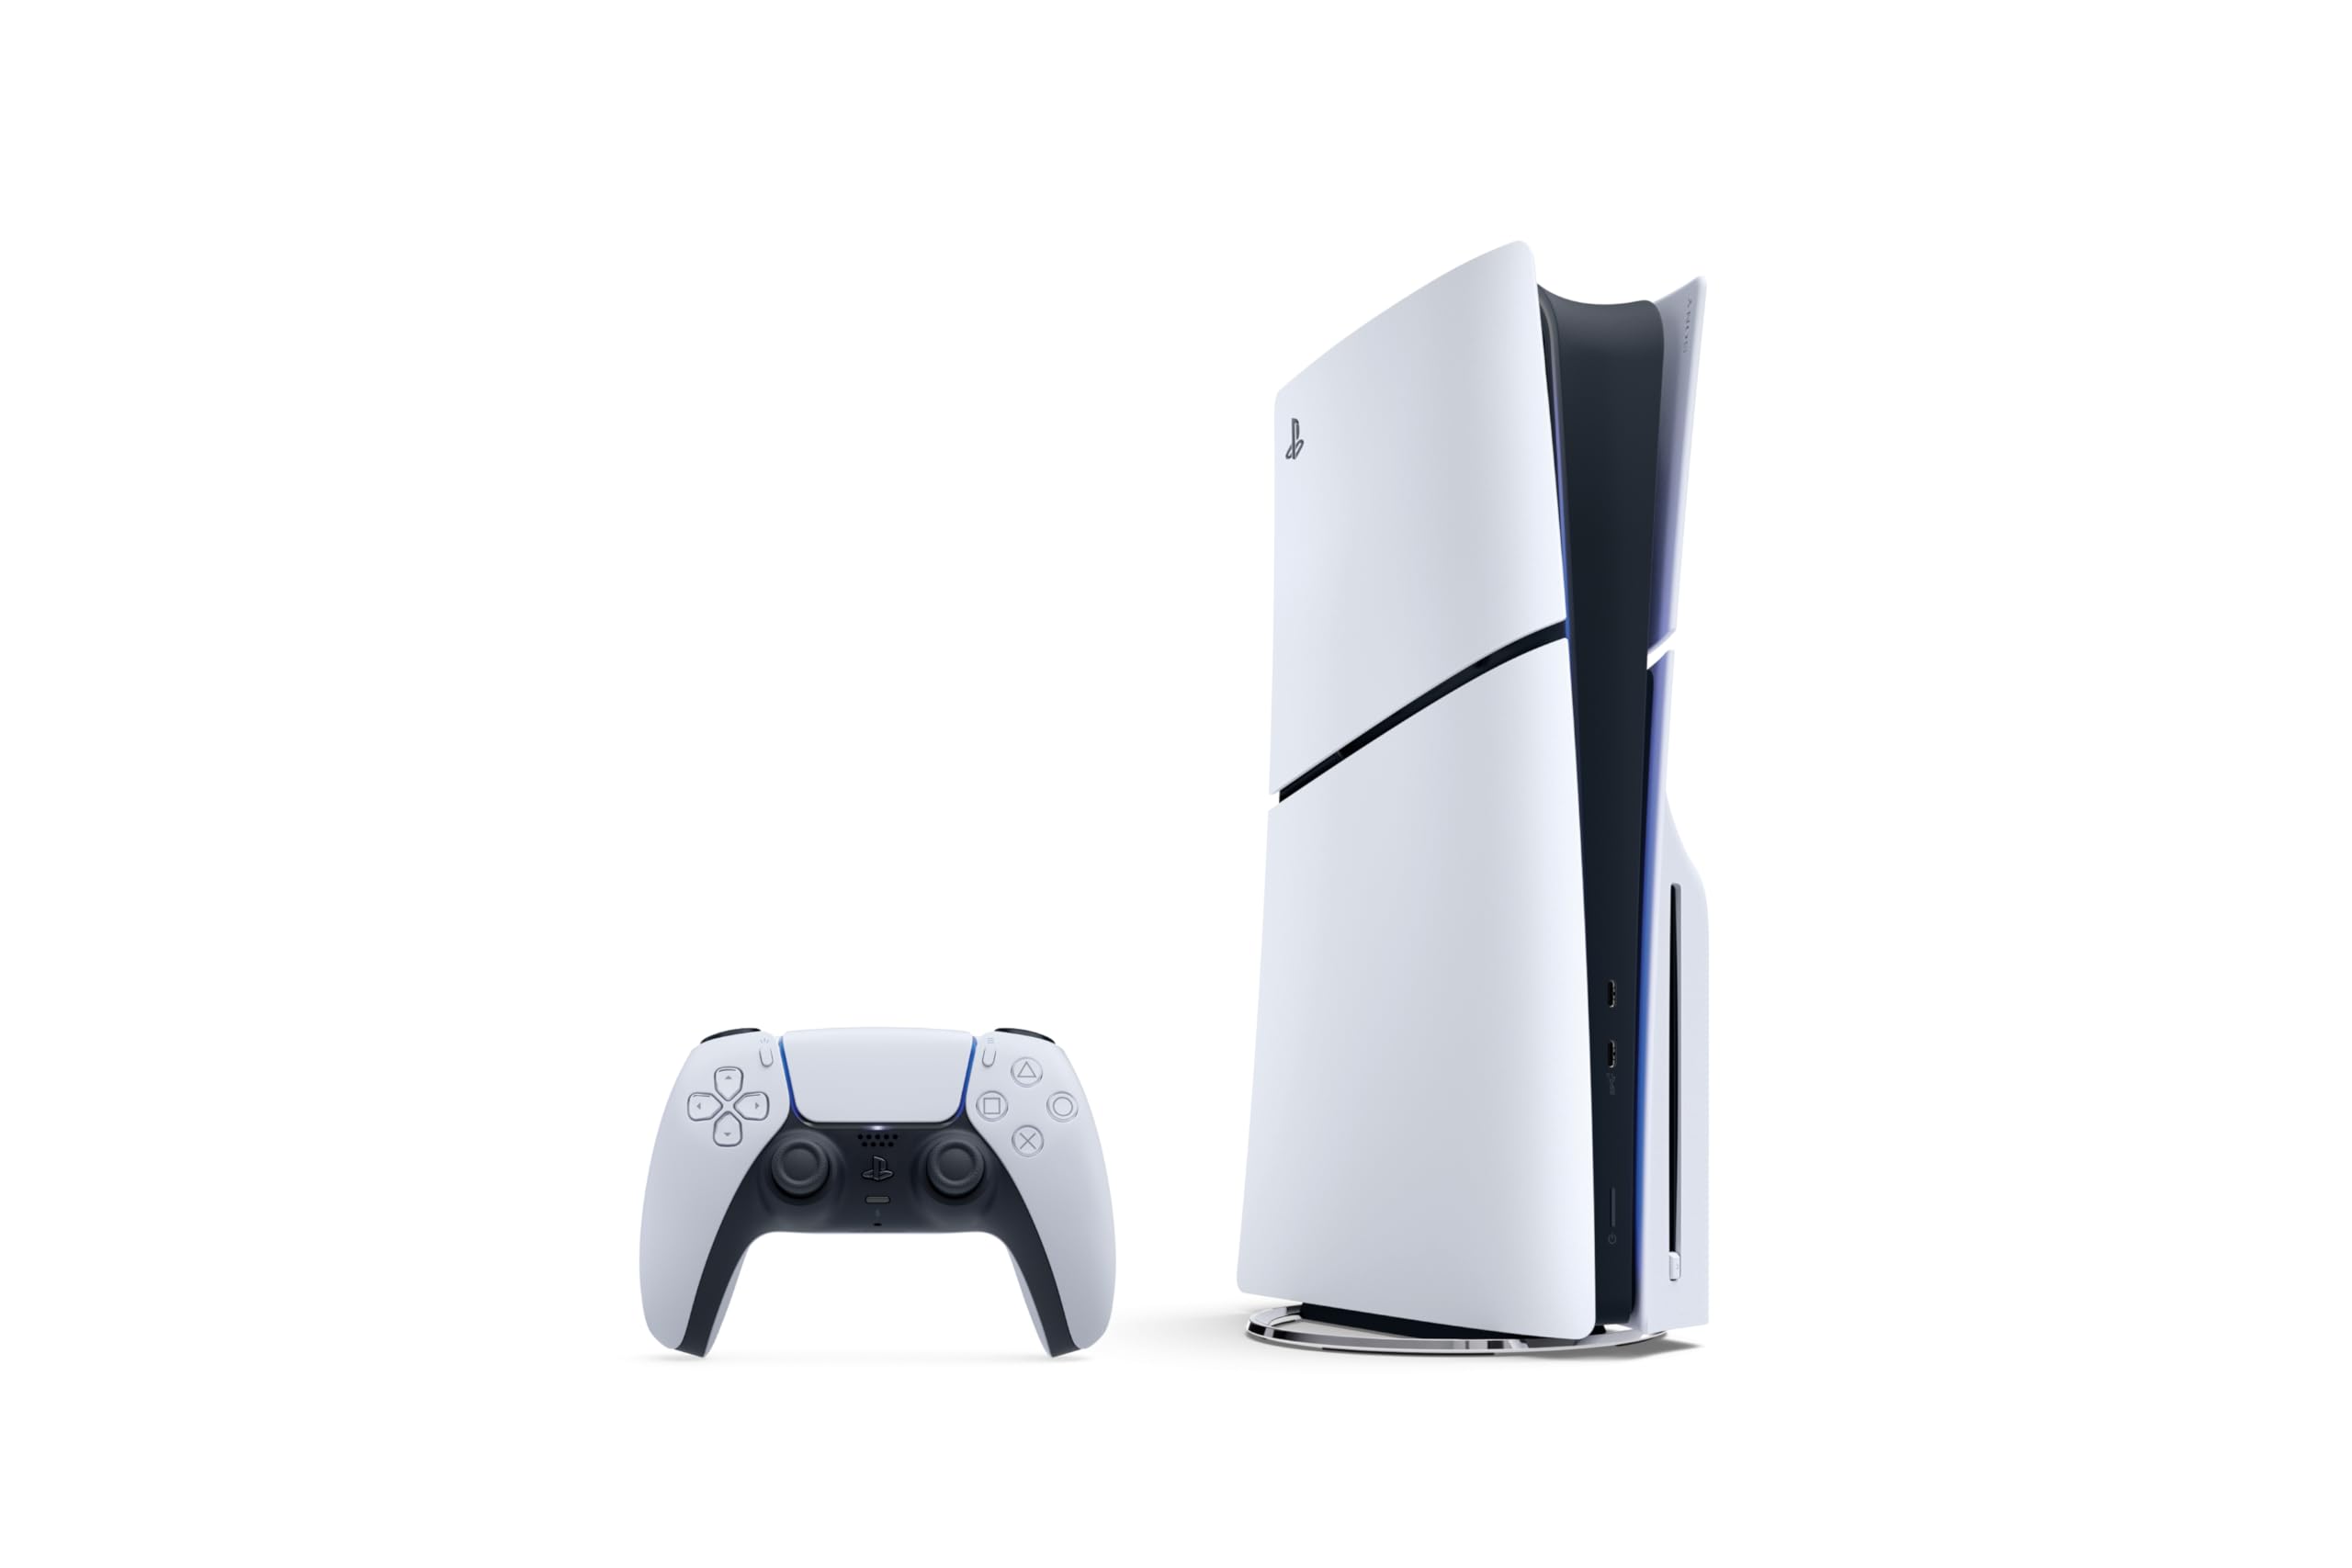 | ...> Consoles | PlayStation | 132.6K | = | 3.00% | 9.47% | 74 | 7.48% | |||||||||||||||||||||||||||||||||||||||||||||||||||||||||||||||||||||||||||||||||||||||||||
 | ...> Consoles | PlayStation | 122.3K | = | 7.47% | 6.95% | 89 | 9.94% | |||||||||||||||||||||||||||||||||||||||||||||||||||||||||||||||||||||||||||||||||||||||||||
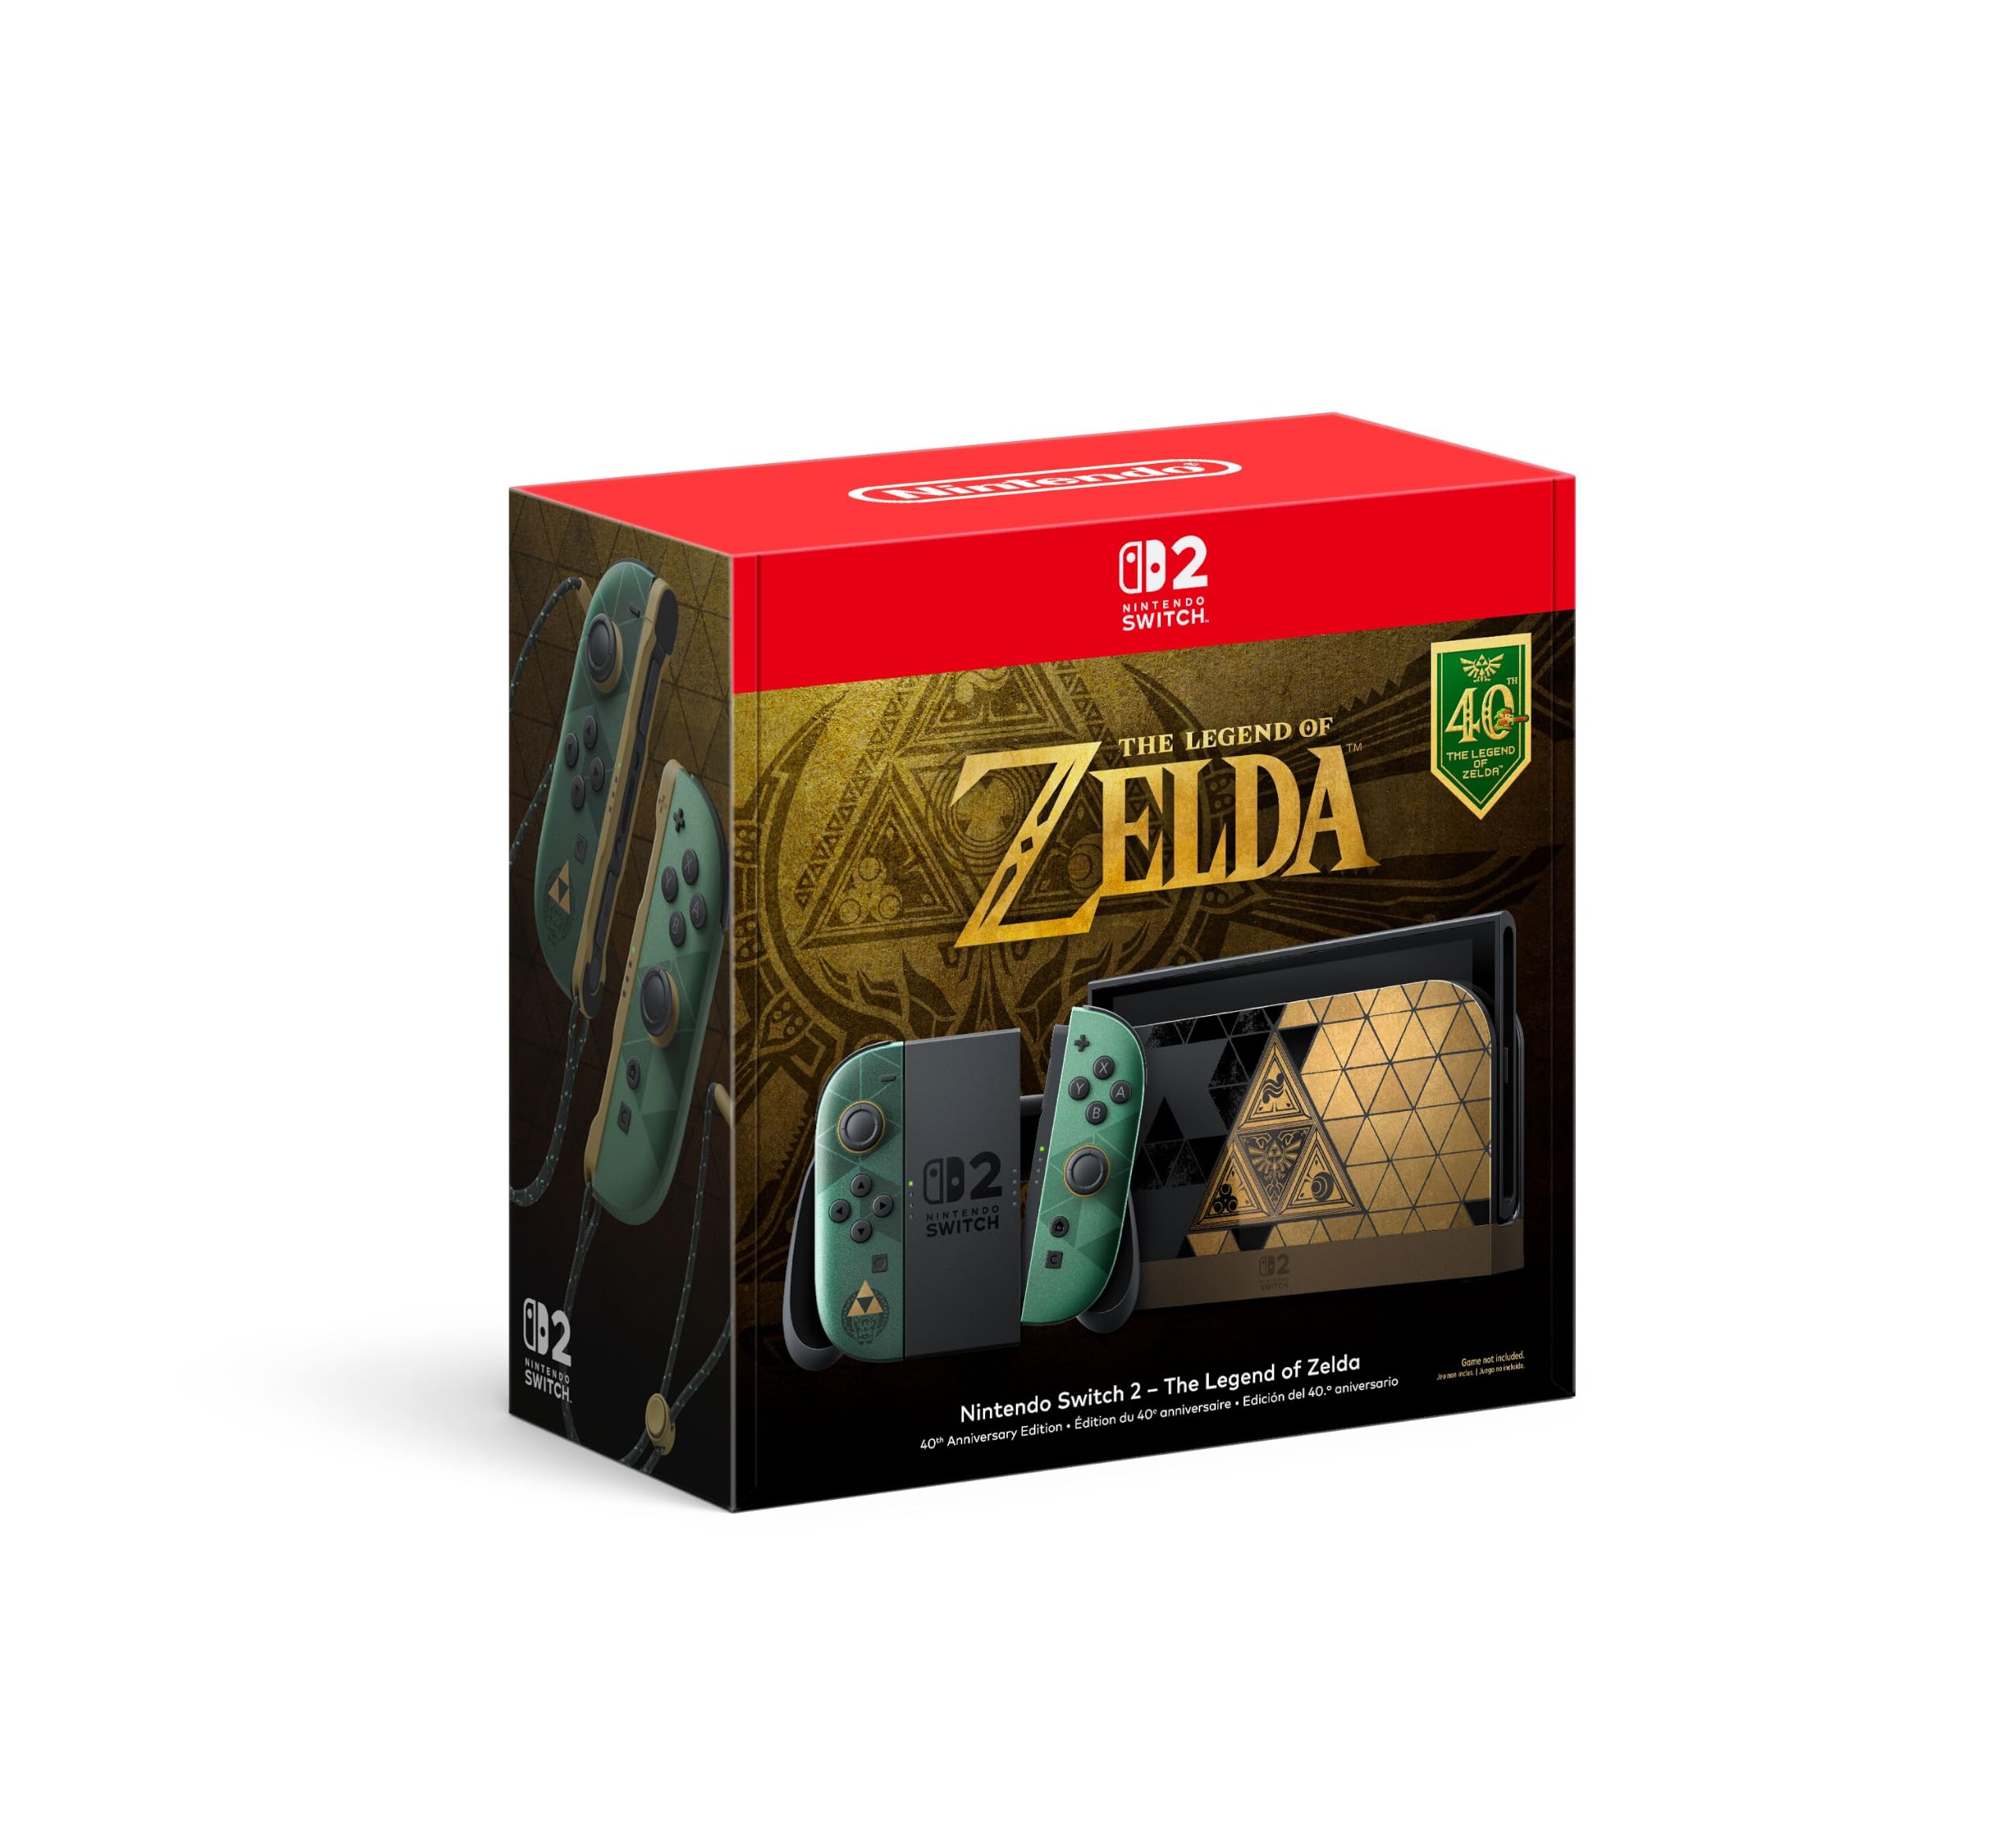 | ...> Video Games | Nintendo | 103.5K | = | 8.88% | 10.00% | < 50 | 6.48% | |||||||||||||||||||||||||||||||||||||||||||||||||||||||||||||||||||||||||||||||||||||||||||
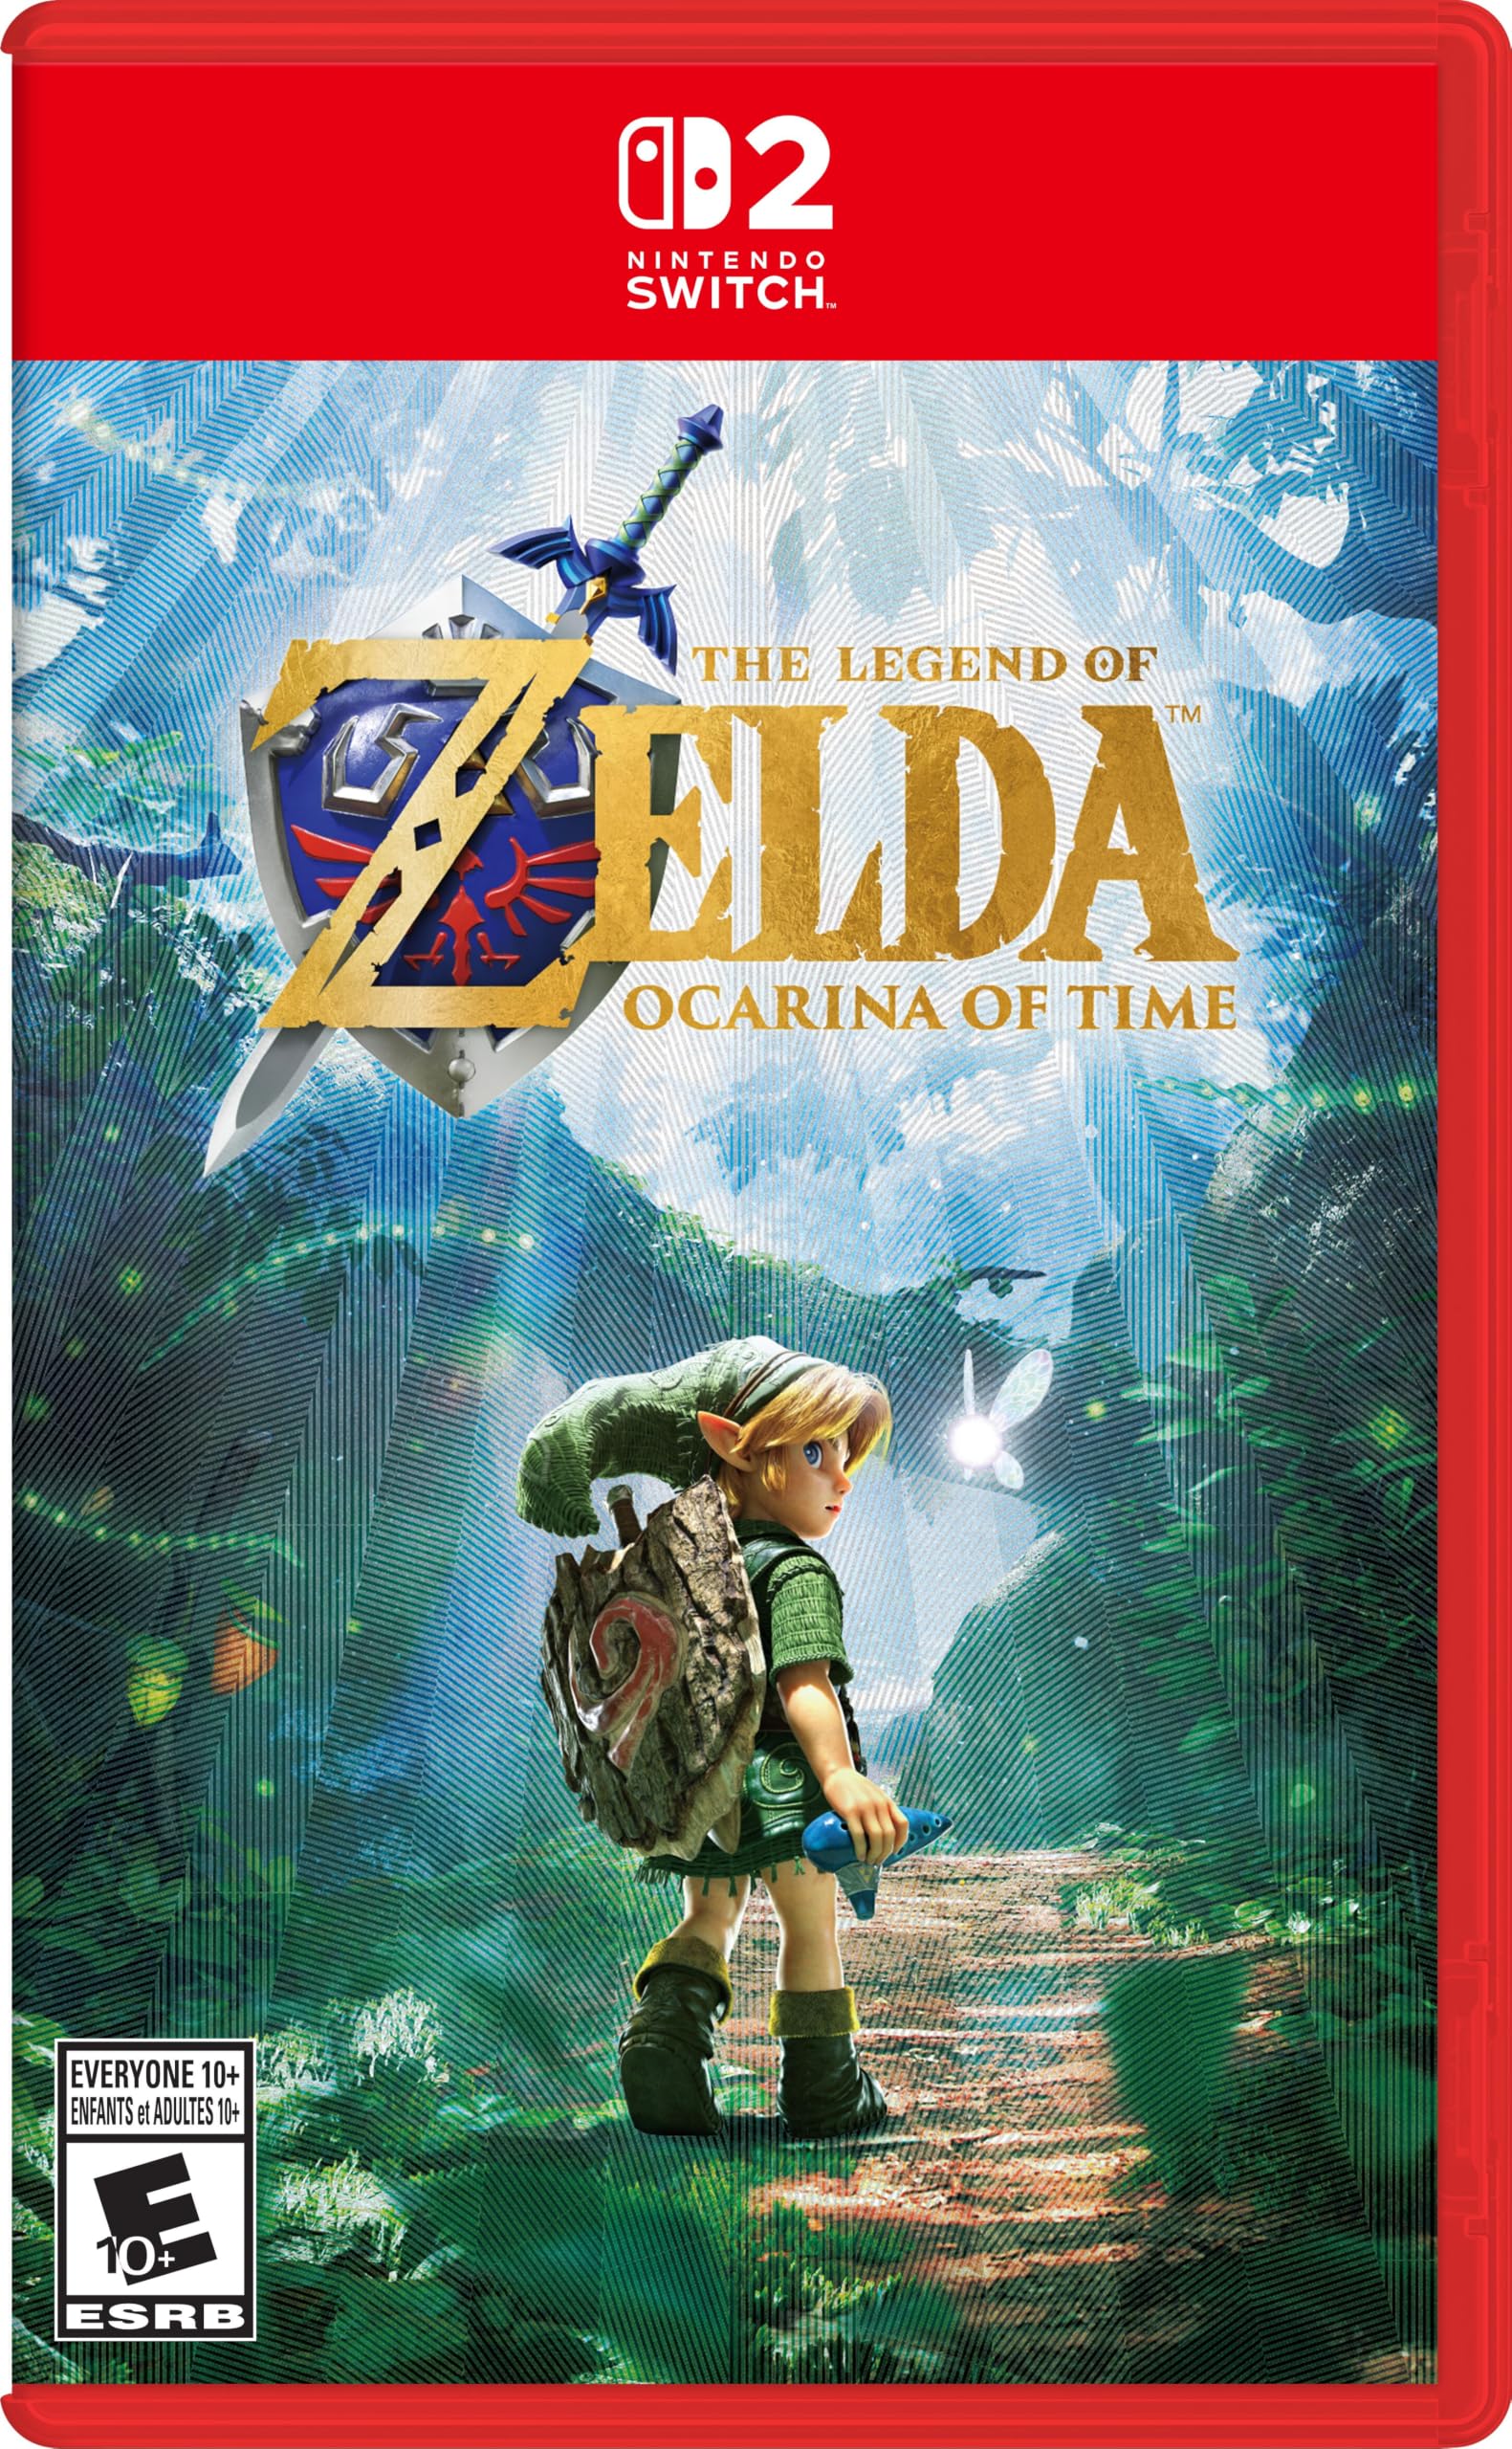 | ...> Games | Nintendo | 96.5K | = | 4.31% | 2.02% | 80 | 9.82% | |||||||||||||||||||||||||||||||||||||||||||||||||||||||||||||||||||||||||||||||||||||||||||
| ...> Consoles | PlayStation | 198.5K | = | 1.26% | 14.81% | 89 | 1.68% | |||||||||||||||||||||||||||||||||||||||||||||||||||||||||||||||||||||||||||||||||||||||||||
| ...> Consoles | PlayStation | 132.6K | = | 3.00% | 9.47% | 74 | 7.48% | |||||||||||||||||||||||||||||||||||||||||||||||||||||||||||||||||||||||||||||||||||||||||||
| ...> Consoles | PlayStation | 122.3K | = | 7.47% | 6.95% | 89 | 9.94% | |||||||||||||||||||||||||||||||||||||||||||||||||||||||||||||||||||||||||||||||||||||||||||
| ...> Video Games | Nintendo | 103.5K | = | 8.88% | 10.00% | < 50 | 6.48% | |||||||||||||||||||||||||||||||||||||||||||||||||||||||||||||||||||||||||||||||||||||||||||
| ...> Games | Nintendo | 96.5K | = | 4.31% | 2.02% | 80 | 9.82% | |||||||||||||||||||||||||||||||||||||||||||||||||||||||||||||||||||||||||||||||||||||||||||
What’s selling—and why Explore the top-performing products on Amazon based on product views, sales, and revenue.Spot trends, category winners, and emerging bestsellers at a glance. | |||||||||||||||||||||||||||||||||||||||||||||||||||||||||||||||||||||||||||||||||||||||||||||||||||