You’ve hit your search limit
Start your free trial to keep exploring full traffic and performance insights.
Get StartedGrafanaUI app analytics for July 17
GrafanaUI
- Roman Senchuk
- Apple App Store
- Paid
- Developer Tools
Access Your Grafana Dashboards and Alerts Anywhere, Anytime
GrafanaUI brings complete Grafana monitoring to your iPhone and iPad. Monitor dashboards and get instant push notifications for critical alerts—even when the app is closed. Perfect for on-call engineers, SREs, and DevOps teams.
WHAT’S NEW IN 2.1.0: GRAFANA CLOUD & NOTIFICATIONS
Version 2.1.0 adds Grafana Cloud support via a Service Account API token—Web Auth does not work with Grafana Cloud (`*.grafana.net`); use the Grafana Cloud tab and a Viewer (read-only) token. A new Notification Center (bell icon, unread badge) delivers push for support replies and app news. Self-hosted Web Auth is more reliable for OAuth/SSO (GitHub, Google, Authentik) with Safari and passkeys. Grafana Cloud dashboard panels load correctly with API tokens; dashboard lists scroll smoothly without flicker.
Also includes full alert monitoring from 2.0.x: push on the lock screen, background updates with an Alerts API token, filters, notification rules, multi-server aggregation, and battery-focused Low Power Mode & Adaptive Refresh.
KEY FEATURES
Alert monitoring & notifications
• Push notifications; background alert updates while the app is closed
• All alert states; filter by state, dashboard, folder, server, or date range
• Alert detail view with metadata, labels, annotations; notification rules for muting noise
• Configurable intervals; multi-server aggregation; badge counts
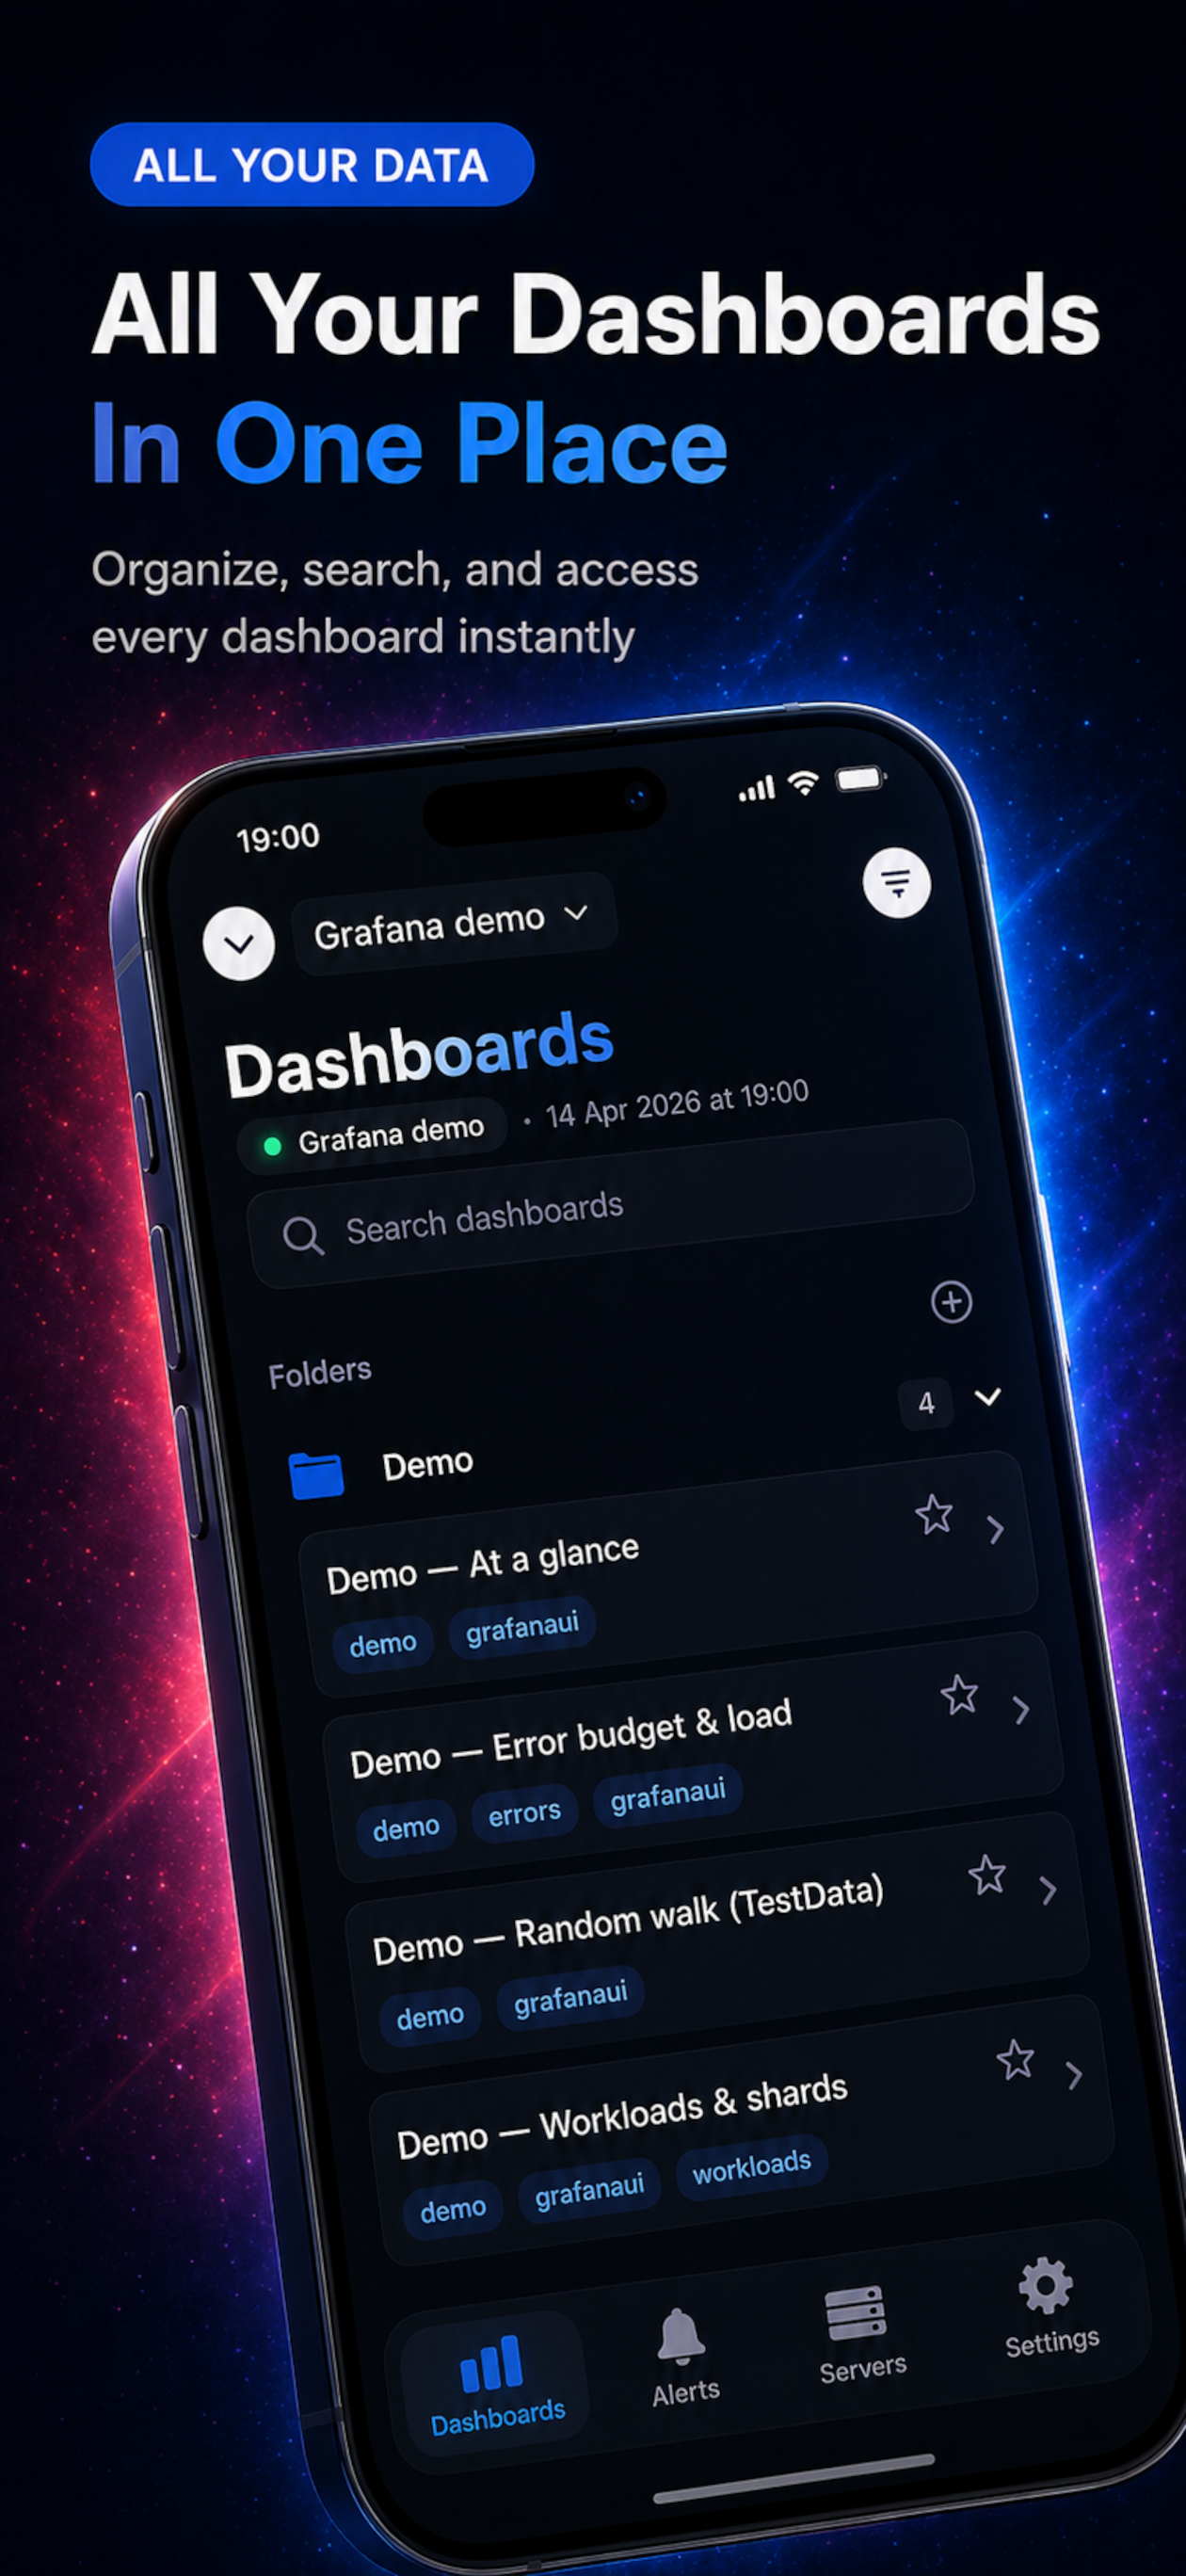
Dashboards
• Browse and search dashboards; tags; folders; favorites; WebView-based viewing with pull-to-refresh
Multiple servers & authentication
• Connect to multiple Grafana servers; cloud or self-hosted
• Grafana Cloud: Service Account API token (Web Auth not supported on `*.grafana.net`)
• Self-hosted: Web Authentication (OAuth, SAML, SSO), Basic Auth, or API tokens for alerts
• In-app guide: info icon on the Grafana Cloud tab for token setup steps
• Credentials stored in iOS Keychain
Performance, security & design
• Low Power Mode, Adaptive Refresh, smart caching
• Optional PIN/biometrics; no third-party ad analytics SDKs
• Offline dashboard cache where applicable; Dark Mode; 9 languages
PERFECT FOR
DevOps, SREs, system administrators, data analysts, and anyone using Grafana.
USE CASES
On-call and incident response; remote work with secure connections; quick status checks on the go.
Your credentials stay in Keychain; biometrics adds an optional extra layer.
REQUIREMENTS
• iPhone and iPad compatible
• iOS 15.0 or later
• Access to your Grafana server (cloud or self-hosted)
IMPORTANT NOTE
Unofficial Grafana client—not affiliated with, endorsed by, or sponsored by Grafana Labs.
GETTING STARTED
1. Add your Grafana server URL
2. For Grafana Cloud: choose Authentication → Grafana Cloud, add a Viewer Service Account token (tap the info icon for steps)
3. For self-hosted: choose Web Auth, Basic Auth, or None
4. Configure an Alerts API Token in server settings for notifications (premium)
5. Enable notifications; optional PIN or biometric authentication
Start monitoring your Grafana dashboards and alerts today.
SUPPORT
Having issues or suggestions? Follow us on Instagram @freshlab.app for updates and support.
Store Rank
The Store Rank is based on multiple parameters set by Google and Apple.
All Categories in
United States--
Developer Tools in
United States#73
Top Competitors & Alternative Apps
Apps with a high probability of being used by the same users, from the same store.
YAML Tools
GrafLens
RebootX
Text Editor - Document Editor
July 17, 2026