Key takeaways:
- Online Market Share: In August 2019 BKNG’s sites accounted for the highest share of non-bounced visits in EMEA, APAC, and LATAM; 58%, 48.5%, and 55.3% respectively. In North America EXPE’s sites accounted for the highest share of non-bounced visits, 44.7%.
- Online Market Share Growth: In August 2019 Airbnb’s sites were the only ones to display positive YOY growth in the share of non-bounced visits in every region. EXPE’s sites experienced negative YOY growth in EMEA (-1.5%), APAC (-2.7%), and LATAM (-3.4%), whilst BKNG’s sites experienced negative growth in North America (-3.2%) and LATAM (-0.8%).
- Brand Strength: Airbnb has the strongest brand strength compared to EXPE and BKNG – displayed by the highest share of direct traffic in EMEA, North America, APAC, and LATAM.
Introduction
This report explores trends in site visits to BKNG, EXPE’s, Airbnb’s, and regional OTAs’ sites in different regions, as well as exploring the brand strength of these players.
We start by setting the context by looking at the total number of global non-bounced visits (visits that go past the landing page), and seeing how these are split by company and by region. Next, we explore trends in the number of non-bounced visits, YOY growth in share of non-bounced visits, and share of direct traffic for BKNG’s, EXPE’s, Airbnb’s, and regional OTA’s sites in EMEA, followed by North America, APAC, and finally LATAM.
Methodology
All data for this report is based on Desktop and Mobile Web, unless otherwise noted.
The analysis covers the period from July 1, 2017, to August 31, 2019.

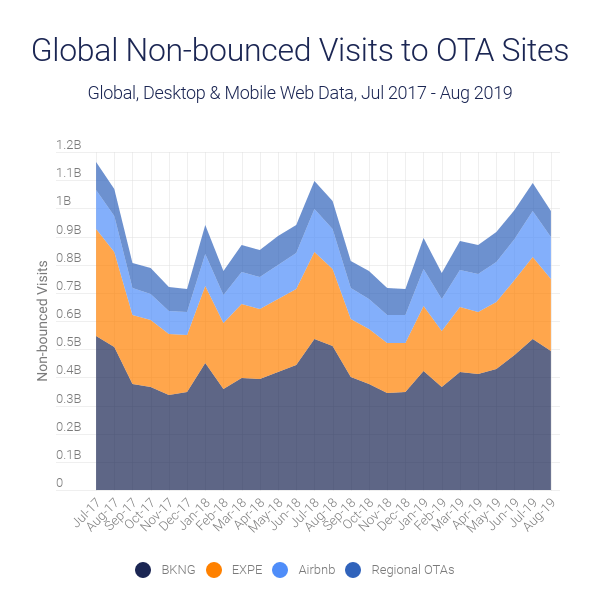
Global non-bounced visits to OTA sites
Global non-bounced visits (visits that go past the landing page) to OTA sites totaled 991 million in August 2019, down 3.4% YOY.
BKNG accounted for 49.9% of non-bounced visits globally, followed by EXPE which accounted for 25.7%.
In August 2019 EMEA accounted for 53.7% of global non-bounced visits to OTA sites, North America accounted for 29.1%, APAC for 12.7%, and LATAM for 4.5%.
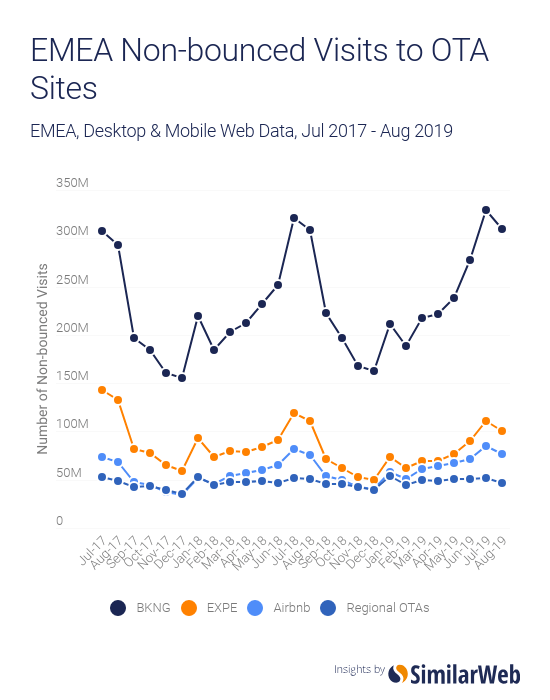
EMEA
In August 2019 there were 533 million non-bounced visits to OTA sites in EMEA, down 2.3% YOY.
Since July 2017 BKNG’s sites have consistently accounted for the majority of non-bounced visits to OTA sites in EMEA, 58% in August 2019.
EXPE accounted for a further 18.8% of non-bounced visits to OTA sites, Airbnb for 14.4%, and regional OTAs for 8.8%.
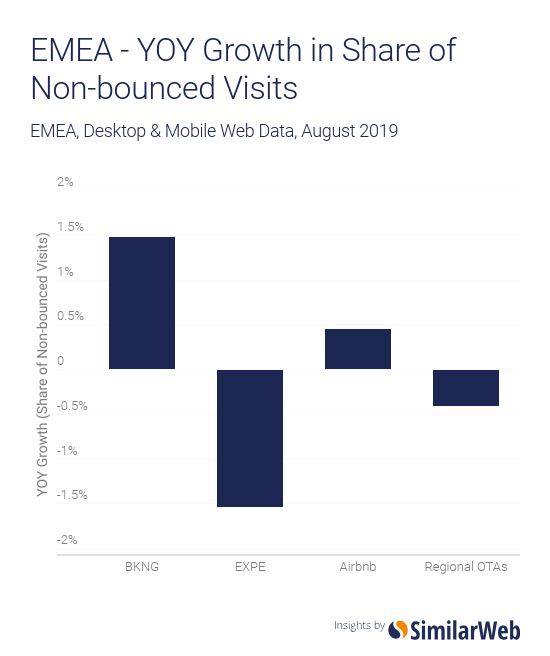
Who is gaining share in EMEA?
In addition to having the highest number of Non-bounced visits in the region, in August 2019 BKNG’s sites also experienced the highest YOY growth in share of non-bounced visits in EMEA, 1.47%.
This was driven by growth to Agoda’s, OpenTable’s, and Priceline’s sites in Finland, Romania, Russia, and Poland.
EXPE’s sites experienced the largest YOY decline in the share of non-bounced visits in the region, -1.53%, driven by decreases to Trivago’s and Expedia’s sites in Romania, the Czech Republic, and Bulgaria.
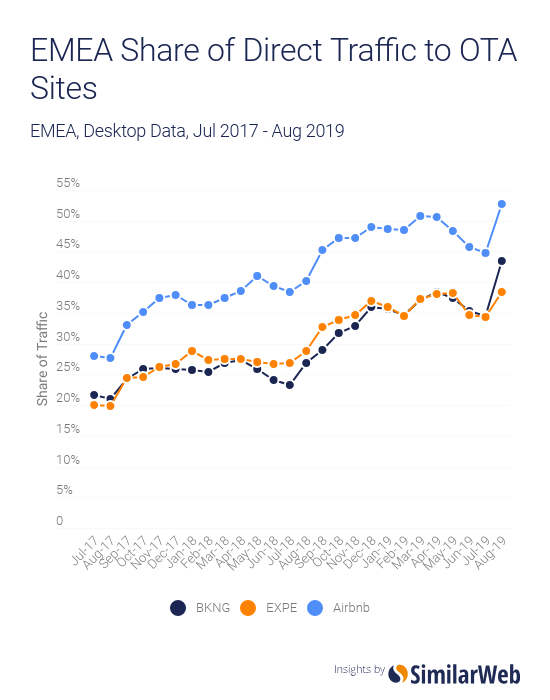
Brand strength in EMEA
The share of direct traffic to BKNG’s, EXPE’s, and Airbnb’s sites in EMEA has been increasing since July 2017.
Despite a lower volume of non-bounced visits to Airbnb’s sites compared to BKNG’s and EXPE’s in EMEA, it appears that Airbnb has the strongest brand strength in the region – displayed by the highest share of direct traffic.
North America
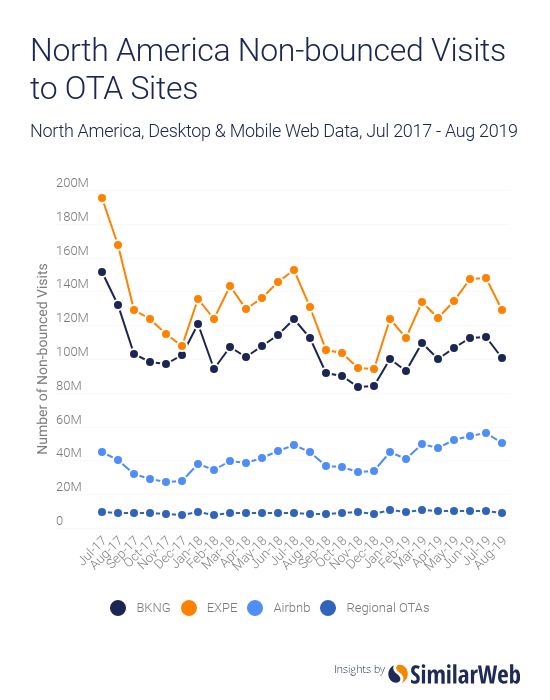
In August 2019 there were 289 million non-bounced visits to OTA sites in North America, down 2.6% YOY.
The number of non-bounced visits to BKNG’s and EXPE’s sites in the region has been strongly correlated since July 2017, however, EXPE’s sites have consistently received more visits.
In August 2019 EXPE’s sites accounted for the highest percentage of non-bounced visits in the region, 44.7%, followed by BKNG’s sites which accounted for 34.8%. Airbnb’s sites accounted for 17.5% of non-bounced visits, and regional OTAs accounted for 3.1%.
Who is gaining share in North America?
Airbnb’s sites in North America have significantly less non-bounced visits than EXPE’s and BKNG’s, however, in August 2019 the company’s sites experienced the highest YOY growth in share of non-bounced visits in the region. This growth, 2.4%, was driven by increases in the US.
Despite accounting for almost 35% of non-bounced visits to OTA sites in North America, BKNG’s sites experienced a 3.2% YOY decrease in share of non-bounced visits in August 2019. This was driven by declines in visits to Priceline’s and Rentalcars’ sites in the US.
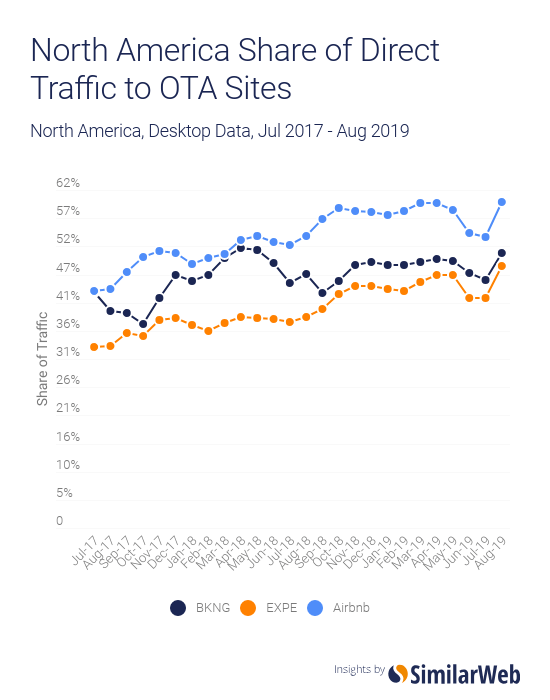
Brand strength in North America
As in EMEA, the share of direct traffic to BKNG’s, EXPE’s, and Airbnb’s sites in North America has been increasing since July 2017; and Airbnb has the strongest brand strength in the region – displayed by the highest share of direct traffic.
APAC
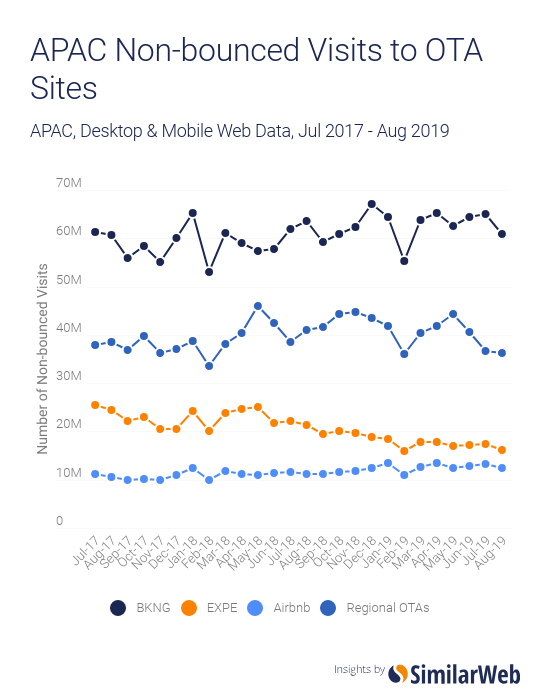
In August 2019 there were 126 million non-bounced visits to OTA sites in APAC, down 8.3% YOY.
Since July 2017 the regional OTAs have consistently had a higher number of non-bounced visits in the region than EXPE’s and Airbnb’s sites.
In August 2019 BKNG’s sites accounted for the highest percentage of non-bounced visits, 48.5%, followed by regional OTAs that accounted for 28.8%, EXPE’s sites at 12.7%, and finally Airbnb’s sites at 9.9%.
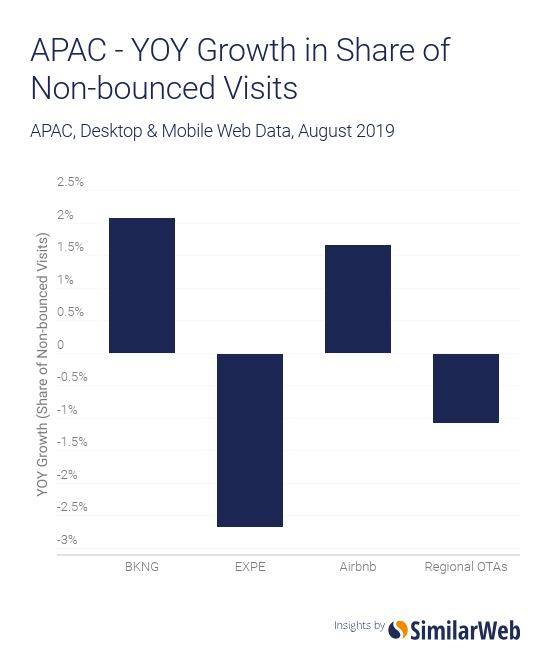
Who is gaining share in APAC?
In addition to having the highest number of non-bounced visits in the region, in August 2019 BKNG also experienced the highest YOY growth in share of non-bounced visits in APAC, 2.07%. This growth was driven by visits to Kayak’s and Agoda’s sites in the Philippines, Japan, and Hong Kong.
EXPE’s sites displayed the largest YOY decline in share of non-bounced visits in the region in August 2019, -2.66%, driven by declines in Japan, the Philippines, and Malaysia.
LATAM
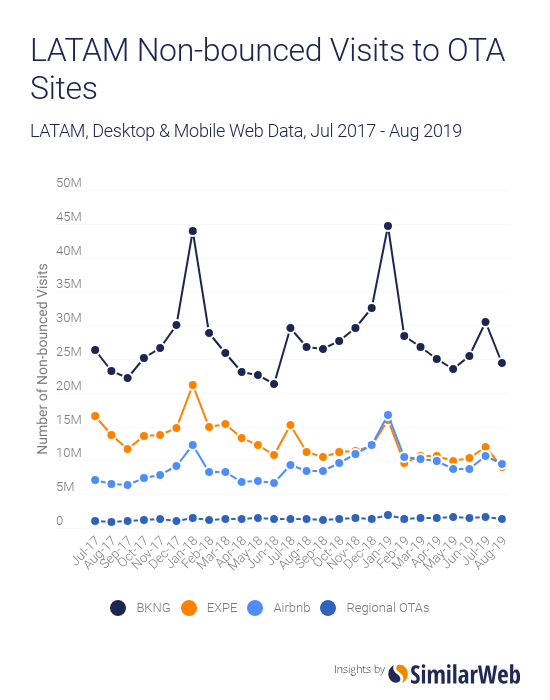
In August 2019 there were 44 million non-bounced visits to OTA sites in LATAM, down 7.1% YOY.
Since July 2017 BKNG’s sites have consistently had a higher number of non-bounced visits in the region than the other players.
In August 2019 BKNG’s sites accounted for the highest percentage of non-bounced visits, 55.3%, followed by Airbnb’s sites which accounted for 21.4%, EXPE’s sites at 20.3%, and finally regional OTAs at 3.1%.
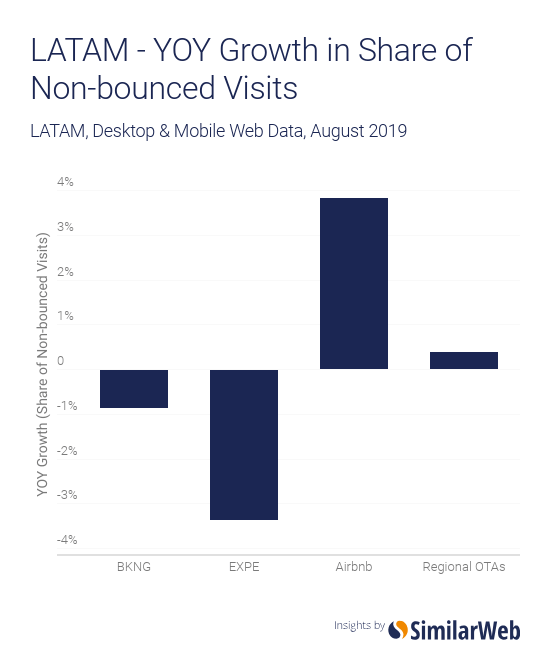
Who is gaining share in LATAM?
In August 2019 Airbnb’s sites experienced the highest YOY growth in share of non-bounced visits in LATAM, 3.82%, driven by growth in Chile and Mexico.
EXPE’s sites displayed the largest decline in growth in the region, -3.35%, driven by Brazil, Mexico, and Chile.
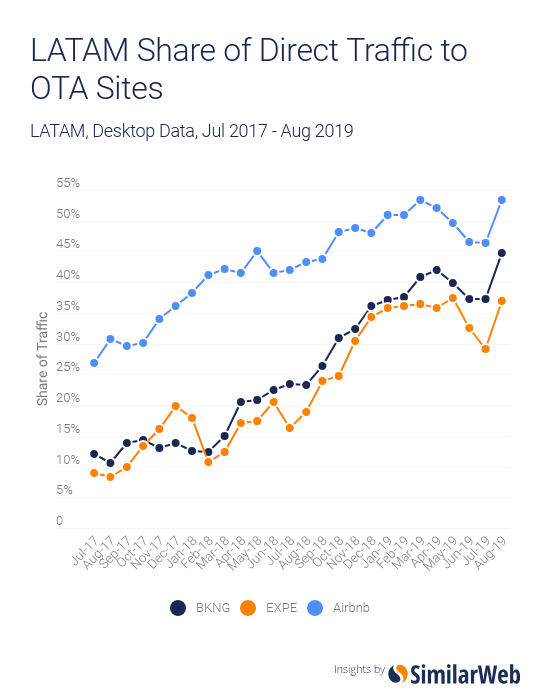
Brand strength in LATAM
As in EMEA, North America, and APAC the share of direct traffic to BKNG’s, EXPE’s, and Airbnb’s sites in LATAM has been experiencing an upward trend since July 2017.
Again, we see that Airbnb has the strongest brand strength in the region, displayed by the highest share of direct traffic.
Conclusion
BKNG’s sites receive the highest number of non-bounced visits compared to other OTAs in all regions, apart from North America where the EXPE’s sites receive the highest number of non-bounced visits.
Despite a lower number of non-bounced visits than BKNG’s and EXPE’s sites in most regions, when it comes to YOY growth in share of non-bounced visits Airbnb’s sites are the only ones to display positive growth in every region. In addition, Airbnb has the strongest brand strength of the group displayed by the highest percentage of direct traffic in all regions.

Want the latest data? Try Similarweb for free.
