COVID-19 Travel Index

Check out our recovery index to get the latest on how COVID-19 is impacting the travel industry.

Recovery Index

Borders closed. Flights disrupted. Fears growing. Variants spreading. For nearly two years, the travel industry has been tested on a truly unparalleled scale.

How can you navigate this ever-changing landscape and still come out on top? Real-time data is the key. Get onboard with insights to stay ahead of the industry’s swift evolution.

blue button gradient background
Recovery Index

Country-Level Recovery Index
Explore the map to see bookings by country and how this has changed since pre-COVID-19

Global Accommodation Country Destination Bookings % Change
Desktop and Mobile Web, January 2022 vs. January 2019

International Bookings Recovery Index

International share of bookings increased in all regions in January despite Omicron setbacks. For Europe, the UK, Canada, the US, Australia, and New Zealand, shares of international bookings were the highest they’ve been throughout the pandemic due to relaxed restrictions and promises of imminent border reopenings. As we head into the spring and summer of 2022, we predict that international bookings will reach pre-pandemic levels, barring severe societal impacts of possible new variants.

Global Accommodation Origin Bookings, Share of International Travel, Desktop and Mobile Web

Top 30 Global Destinations Recovery Index
2021 Bookings

Global Accommodation City Destination Bookings and % Change
Desktop and Mobile Web, January 2022 vs. January 2019

Sector Traffic Recovery Index

Global traffic recovery took a nosedive in January for all sectors except car rental as travelers shied away from booking due to Omicron uncertainty. Although car rental demand is still outpacing supply for most major companies, fleets are becoming larger and rates are normalizing again, signaling continued success for the industry overall. As consumers start to book more international vacations, we expect air travel, vacation rental, and hotel sectors to pick up momentum, too.

Global traffic to top domains in each sector compared to 2019, Desktop and Mobile Web

*Does not include Google Travel

Recovery Index

Borders closed. Flights disrupted. Fears growing. Variants spreading. In the last 18 months, the travel industry has been tested on a truly unparalleled scale.

How can you navigate this ever-changing landscape and still come out on top? Real-time data is the key. Get onboard with insights to stay ahead of the industry’s swift evolution.
blue button gradient background
Recovery Index

Country-Level Recovery Index
Explore the map to see bookings by country and how this has changed since pre COVID-19

Global Accommodation City Destination Bookings and % Change
Desktop and Mobile Web, September 2021 vs September 2019

Top 30 Global Destinations Recovery Index
2021 Bookings

Global Accommodation City Destination Bookings and % Change
Desktop and Mobile Web, September 2021 vs September 2019

Sector Traffic Recovery Index
Traffic recovery compared to 2019 slowed for all industries except cruise. Traffic to the top cruise sites was still down 30% compared to 2019, but that performance was better than August (-36%). Slowdown for all industries is due to concerns about the Delta variant as well as the end of the summer holiday season

Global traffic to top domains in each sector, Desktop and Mobile Web
*does not include Google Travel

Delta Variant Index

The Delta Variant is top-of-mind for consumers since May, when the World Health Organization officially named this new variant of COVID-19.

How is the Delta Variant impacting travel?

Are You Onboard?

Unlock powerful travel data with Travel Intelligence

Industry Performance

Understand hotel booking origin across 58 countries and worldwide – measure consumer booking patterns, including where they’re traveling, which providers they’re booking with across desktop and mobile devices

Industry Performance
destination and demand

Destination and Demand

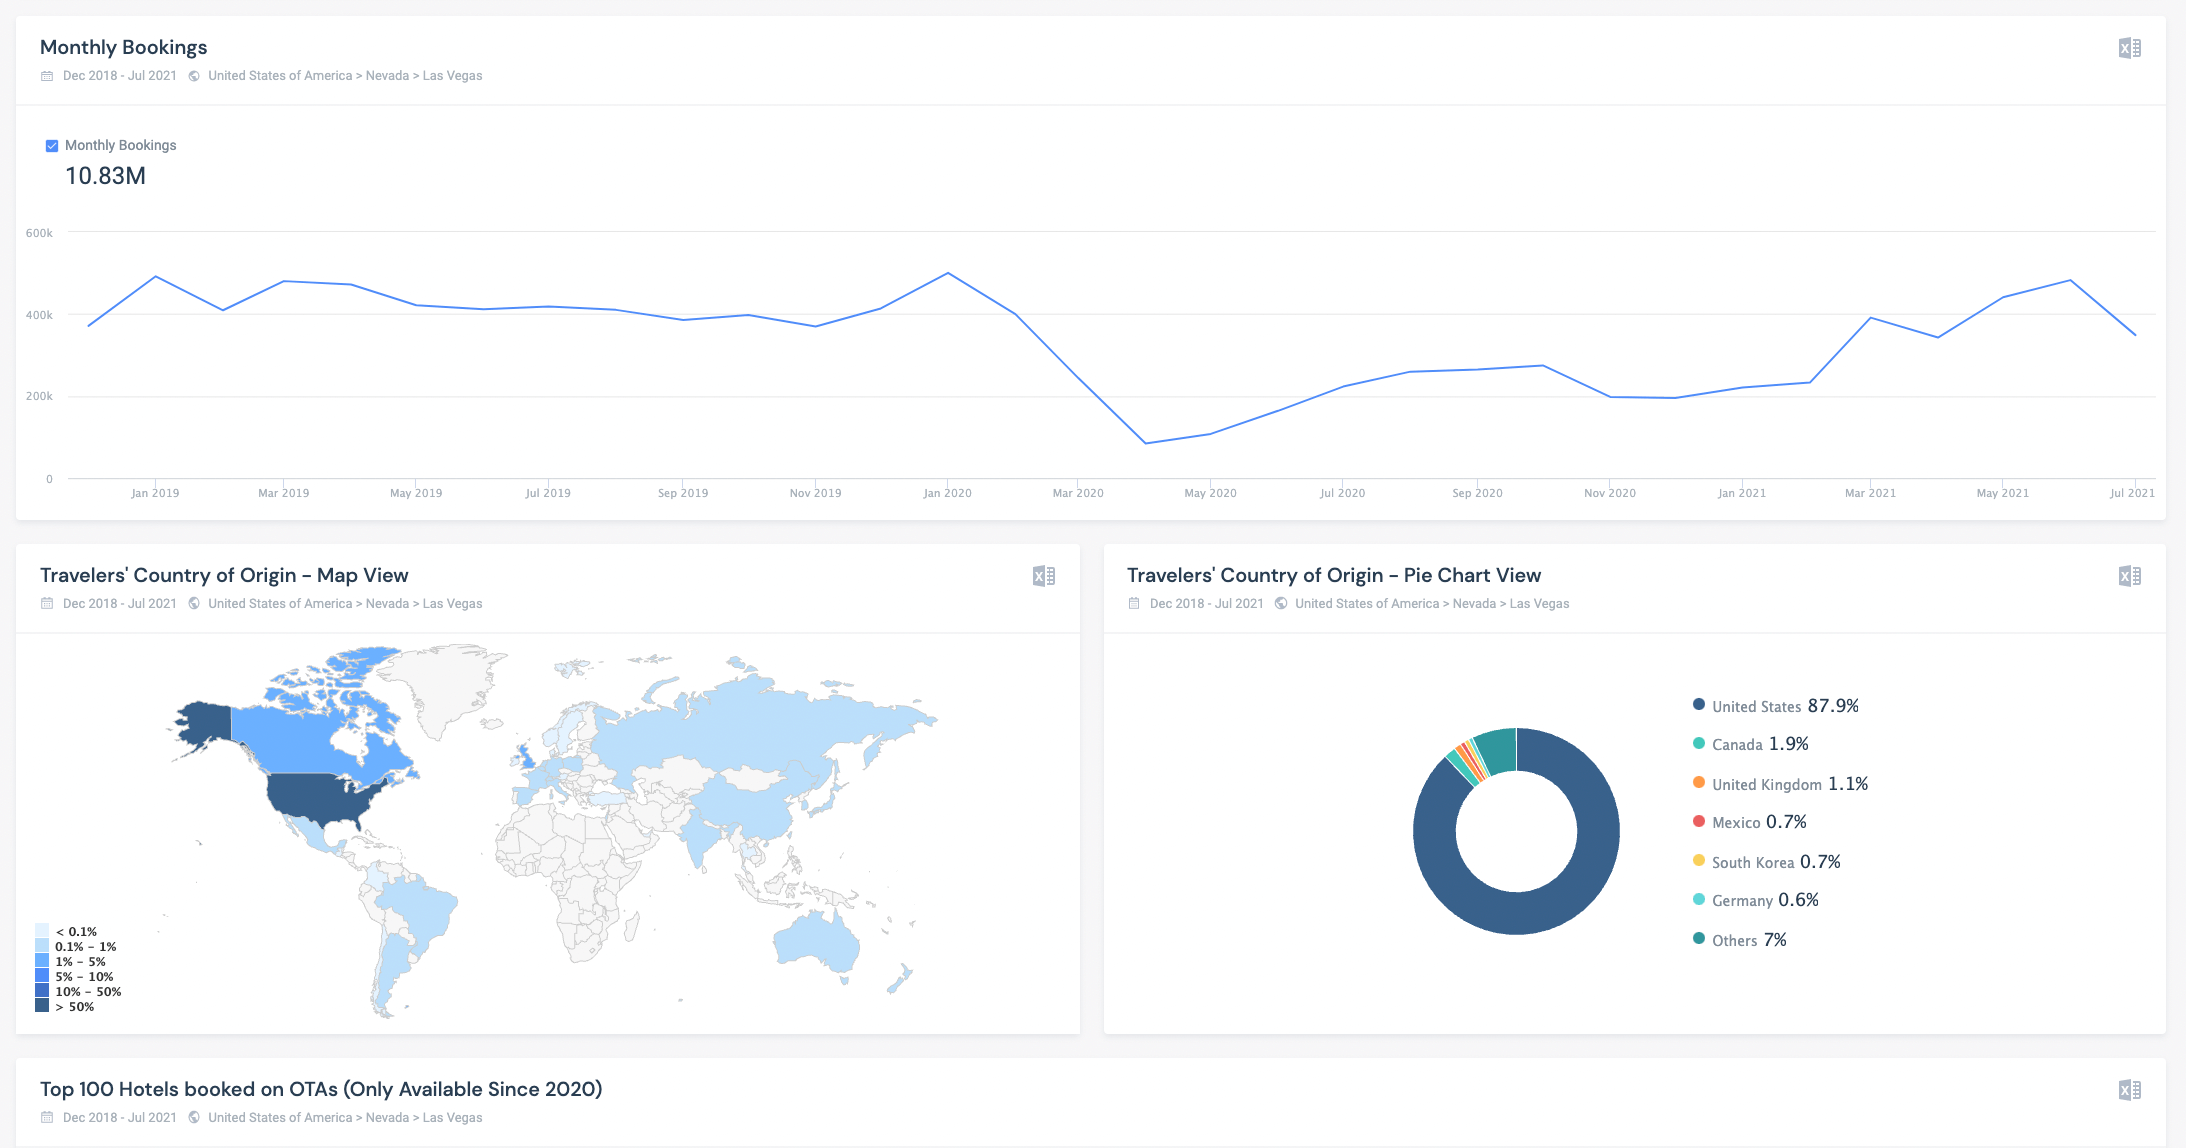
Quantify and track consumer demand and bookings on a country, state, city, and individual property level

Platform Bookings

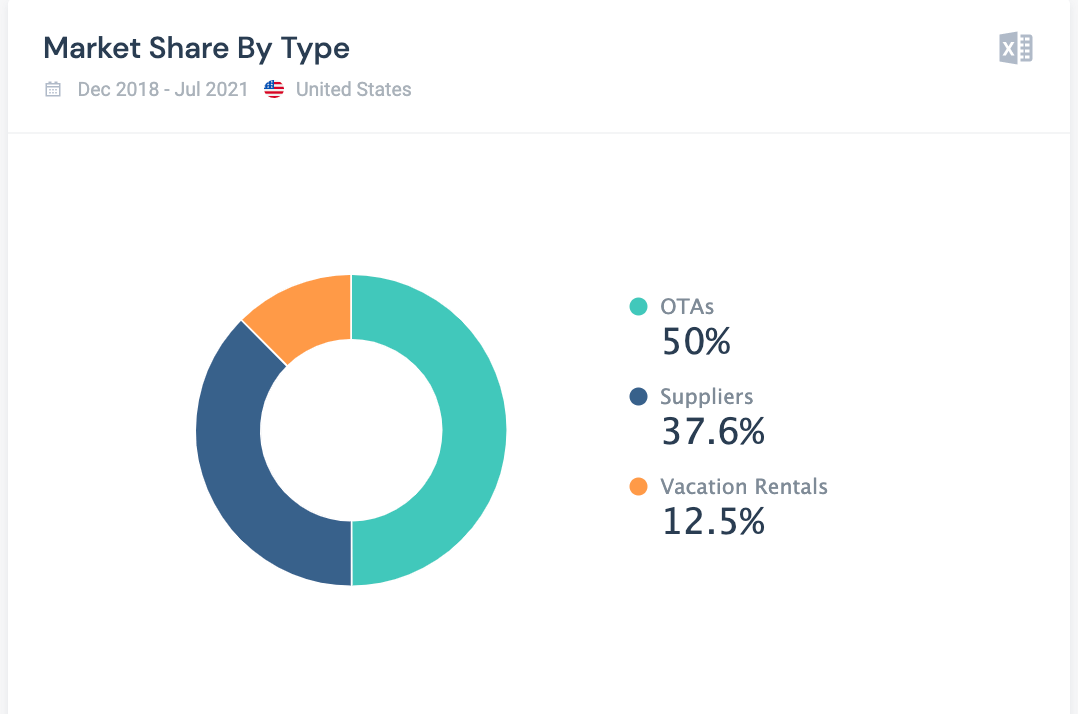
Compare overall market share of OTAs vs. Vacation Rentals and Suppliers by origin and destination

Travel Hub - platform booking

Are You Onboard?

Unlock powerful travel data with Travel Intelligence

Industry Performance

Understand hotel booking origin across 58 countries and worldwide – measure consumer booking patterns, including where they’re traveling, which providers they’re booking with across desktop and mobile devices

Industry Performance

Destination and Demand

Quantify and track consumer demand and bookings on a country, state, city, and individual property level

destination and demand

Platform Bookings

Compare overall market share of OTAs vs. Vacation Rentals and Suppliers by origin and destination

Travel Hub - platform booking

Travel Intelligence is trusted by the world's leading brands

Booking logo
skyscanner logo
loveholidays logo
culture trip logo

Take off with more travel insights