This white paper was written in 2019. Now you can access the full report here for free:
Looking for updated data? Try Similarweb now.
Each holiday season the top digital brands prepare new ways to increase sales and hit their end of year targets.
Discover how top brands like ASOS and Next performed during the holidays from September 2017 to July 2019, and who was the big winner in both user acquisition and overall sales.
Here’s what we’ll cover in this white paper:
- Introduction
- Key takeaways
- Industry traffic patterns
- Holiday season
- 2018 holiday winner
- 2018 desktop trends
- Search focus
- Conversions and returning users
- About Similarweb
Introduction
United Kingdom’s fashion sites ready for the holidays
From September 2017 to July 2019, overall traffic to U.K. fashion brands stabilized at around 270M monthly visits, with little change YoY.
Despite the stability in overall traffic, a key traffic driver in the category was mobile web browsing – responsible for over 70% of the category’s traffic and growing. That said, desktop should not be overlooked, as those browsing on the larger screen are far more likely to be engaged, and eventually convert. This is true both year-round and during the holiday shopping season.
As brands look to attract more shoppers, they should be aware of different browsing habits on each device. While desktop visits are more likely to be direct, mobile traffic is highly likely to stem from search. In the holiday season, growth on both devices is more likely to come from search, making search optimization a key strategy for brands to focus on in the coming months.
Key takeaways
This whitepaper will explore the major digital traffic and brand trends in the U.K. fashion space in the time leading up to the holiday season.
- Though overall traffic to the U.K. fashion industry hasn’t changed YoY, the holiday season continues to be a time when companies improve performance both YoY and MoM.
- Mobile web drove 72% of the category’s traffic. While desktop shoppers were fewer, they were more engaged and more likely to convert.
- ASOS was the only site that saw holiday season traffic decrease YoY, mostly driven by a lack of mobile web growth.
- Focusing on search on both desktop and mobile web proved effective at driving traffic during the holiday season.
- Continually monitoring top category keywords and optimizing for them is an excellent strategy to obtain the undecided shoppers of the season.
- Next.co.uk saw the most dramatic increases in overall conversions, both in the holiday season, and after it, placing them as the top player to watch in the 2019 holiday season.
Industry traffic patterns
Mobile growth and desktop engagement
Fashion brands in the U.K. saw an average of 270M monthly visits, with little changes in YoY traffic. The real story is in where traffic is coming from: Over the past 12 months desktop traffic saw a 4.8% decrease, and mobile web a 3.7% increase, highlighting that users are most likely to turn to their mobile device for browsing.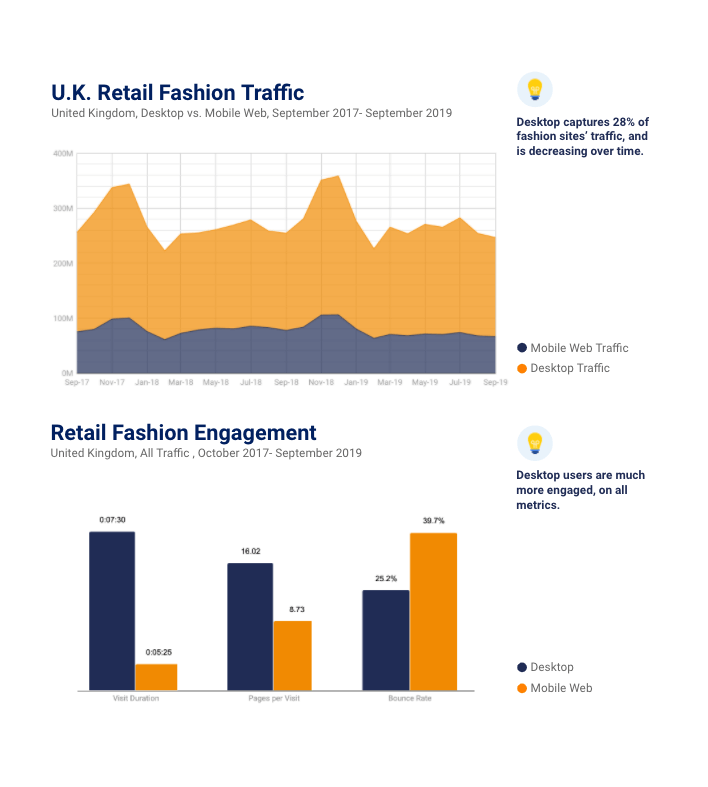
However, we find that when users were more serious about making an actual purchase, they turned to their desktop device.
Examining mobile web and desktop engagement figures, we find that while desktop was only responsible for 28% of the category’s traffic, it was responsible for 35% of time spent on fashion sites, and 45% of the pages viewed. Mobile web visitors were also far more likely to bounce off sites – with an average bounce rate of 44.1%, compared to desktop’s 26.3%.
These figures combined, indicate that while it’s important to attract visitor attention on the mobile device, it is equally important to focus on desktop to reach engaged shoppers.
2020 Insights: How U.K. Apparel and Accessories Performed
Holiday season trends
While overall annual traffic hasn’t changed, the shopping season presents a dramatic growth opportunity, as traffic rises 35% over the baseline. That said, YoY holiday season traffic grew 4.2% in the last two months of 2018, compared to the same months in 2017.
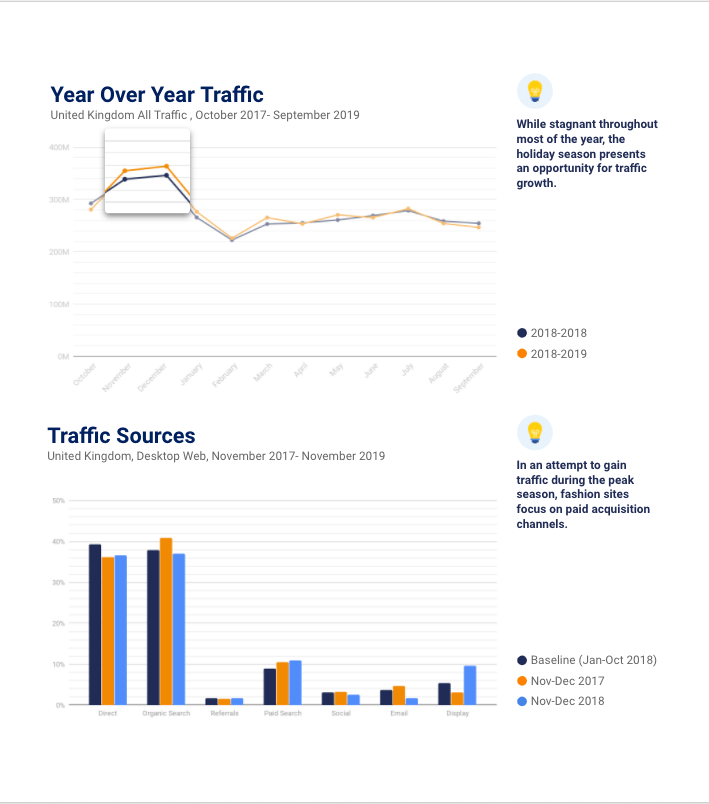
This traffic increase is fueled by desktop, with a 6.5% increase in desktop traffic during the holiday shopping peak, while mobile web only increases by 3%. This shift in browsing patterns further indicates a tendency to switch to desktop as consumers become more likely to make an actual purchase, rather than browse.
Aware of this inclination, brands up their paid spend during the holiday season, in an attempt to win over engaged shoppers. In the 2018 holiday season, we saw an even greater reliance on paid search and display ads over the 2017 season. This increase in paid traffic is apparent even after taking popular Chinese apparel site shein.com (known for display-heavy tactics) out of the mix.
2018 holiday winners
Successful holiday mobile strategies
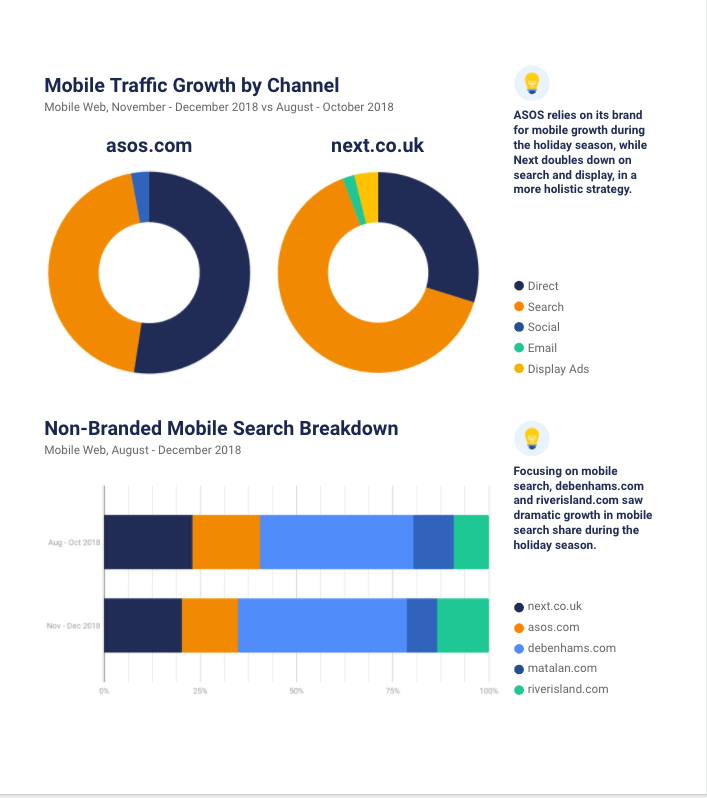
While most of the top 10 fashion sites saw holiday traffic gains in 2018 over 2017, asos.com actually saw a 7% decrease.
Interestingly, while the category as a whole saw desktop traffic increase, a few of the top sites, including next.co.uk and asos.com saw desktop traffic decrease. Unlike other players, however, ASOS was unable to make up for lost traffic on mobile.
With 70% of fashion sites’ mobile traffic arriving through search, a focus on mobile search is expected to bring more visibility. Indeed, all sites in the group besides asos.com, utilized this strategy, with more than 70% of growth coming from mobile search. Asos.com instead focused on brand, and as a result, lost significant shares of non-branded mobile search traffic, down from 17.5% on the baseline to 14.6% in the holiday season.
As shops gear up for the 2019 season, non-branded search optimization, particularly on mobile, is even more important.
2020 Insights: U.K. Apparel and Accessories
2018 digital trends
Desktop traffic is quality traffic
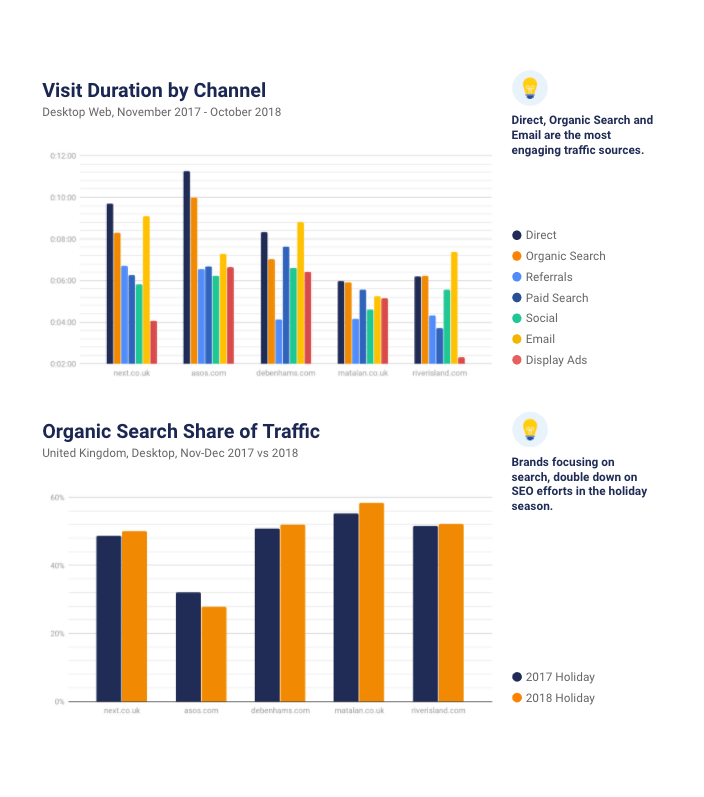
While Mobile Web allows for greater visibility, Desktop traffic is more likely to convert, simply because consumers prefer to make a purchase decision on the larger screen. As such, when choosing a desktop strategy, it is important to choose the methods that bring about not just traffic volume, but also better quality (read: more engaged) traffic.
Using visit duration as a representative metric for engagement, we find that after Direct, Organic Search is the second-best source for engaged traffic, with an average of 8:05 minutes spent on site. Email is another powerful channel, though may indicate past engagement with the site – as users generally opt-in for email communications.
A look at the top-performing fashion sites highlights that all have improved their SEO strategy over the year, bringing themselves a higher share of Organic Search traffic in the 2018 holidays over 2017. We can only assume that brands will continue this trend heading into the 2019 season.
Seasonal search optimization
As shown previously, the non-branded search is the driver for growth in the holiday season. As brands look for ways to improve their strategy towards the upcoming season, we have looked at the most popular category keywords over the past few months, and suggest a few with a recent rise in traffic to focus on.
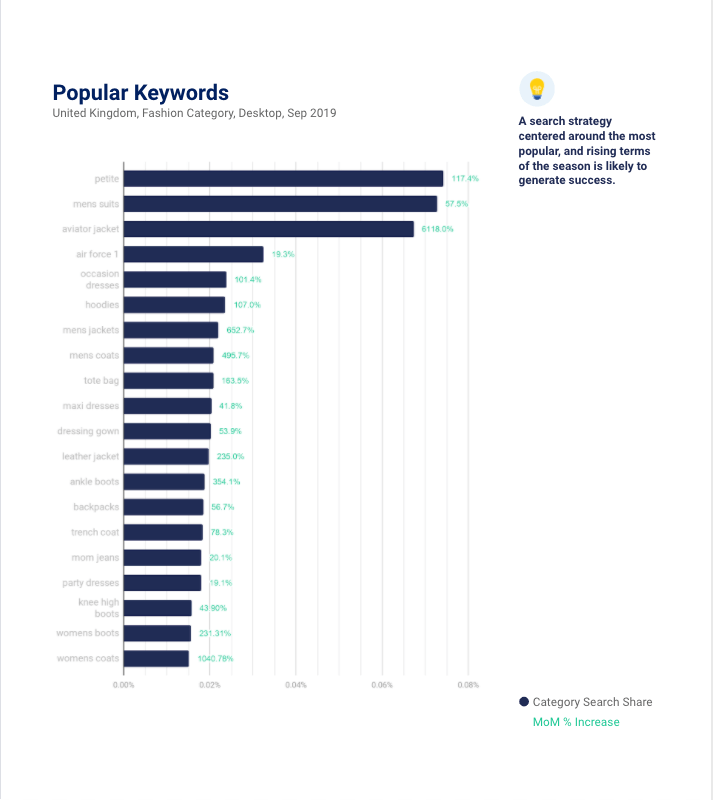
Seen here, one of the most lucrative keywords to focus on – aviator jacket has seen a 61X rise in traffic as users look to invest in their fall and winter wardrobe. Occasion dresses and party dresses are also on the rise, as audiences prepare for holiday parties.
Considering that fluctuations in keyword popularity towards the season are likely, fashion sites should constantly evaluate top category keywords. Optimizing for the most popular keywords on both desktop and mobile have proven to be great strategies for obtaining holiday season traffic.
Converting traffic to sales
Next and ASOS are best in class
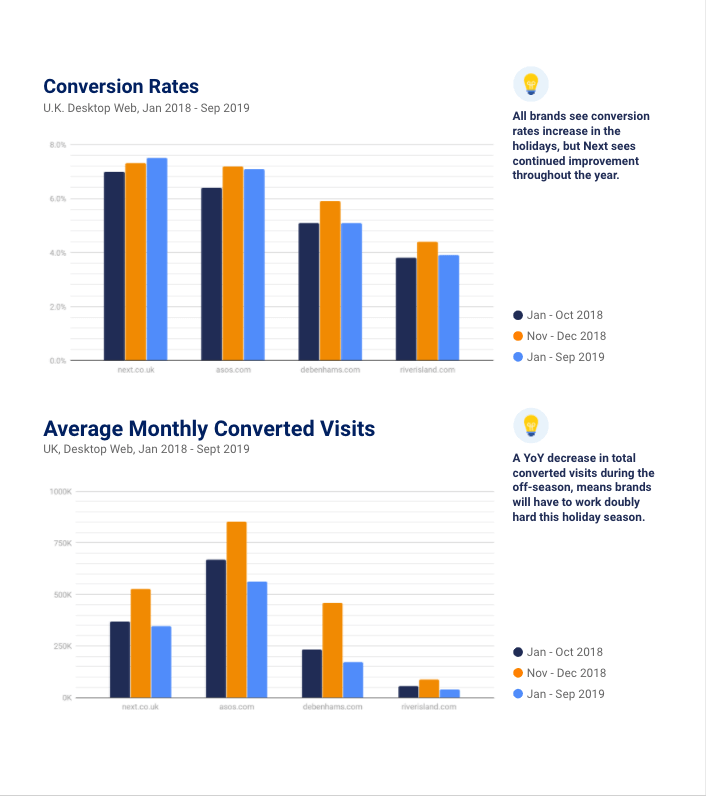
Traffic and engagement patterns are excellent ways to obtain an initial gauge of performance. However, a deeper analysis allows us to see which sites are actually converting more visits.
Seen here, the top-performing UK fashion brand, next.co.uk saw baseline conversion figures in the 7% range – only to continue increasing, to 7.3% during the holidays, and 7.5% in the months since. Next is the only site of the group that managed to continue improving its conversion rates in the months following the holiday season, positioning it as the brand to watch in the 2019 season.
Moreover, in total converted visits, Next sees almost identical monthly conversions comparing Jan-Sep 2019 vs 2018, while other sites actually see a decrease in converted visits. This decrease in converted visits means brands will have to work harder to obtain engaged visitors during the holiday season. Focusing on the successful strategies of past seasons, like SEO and mobile search is a great starting point.
Knowing your market means knowing your competitors. Similarweb offers breadth and depth of digital market Intelligence.
Ready to set up a live demo with a Similarweb Consultant? Contact us now.
This post is subject to Similarweb legal notices and disclaimers
